 Wenwu Zhang
 Baoshan Zhu3
94% of researchers rate our articles as excellent or good
Learn more about the work of our research integrity team to safeguard the quality of each article we publish.
Find out more
ORIGINAL RESEARCH article
Front. Energy Res. , 08 June 2022
Sec. Process and Energy Systems Engineering
Volume 10 - 2022 | https://doi.org/10.3389/fenrg.2022.900182
The development of multiphase pumps is restricted because of low efficiency and poor mixing transportation capacity. In this study, a two-step multi-objective optimization design system for a multiphase pump is constructed using a three-dimensional (3D) design theory and multi-objective optimization techniques. The transportability improvement for the pump impeller is achieved by implementing the optimization variables of its geometry and blade loading and the optimization objectives containing the pump efficiency and gas uniformity. The optimal results of impeller geometry show that the blade wrap angle and control parameters of the hub have remarkable effects on the pump efficiency and gas uniformity. The optimal results of impeller blade loading show that the pump efficiency is improved if the impeller with large loading at the leading edge, large slope at the middle part, and large negative high-pressure edge angle. The gas uniformity is improved if the hub loading at the middle and trailing parts is larger than the shroud loading. Compared to the original test impeller, the pump efficiency with the impeller T-Opt1 and the gas uniformity at the impeller outlet are improved by 10.81% and 6.91%, respectively. The maximum fluctuation amplitudes in T-Opt1 and its corresponding guide vane are reduced by 0.61% and 67.76%, respectively.
Multiphase pumps are applied in petrochemical, food, and nuclear industries extensively (Wang et al., 2015; Parikh et al., 2020). It is usually divided into displacement pump and rotodynamic pump (Cao et al., 2005). The multiphase rotodynamic pump has some advantages. It not only has a small volume and large conveying flow rate but also has low requirements for manufacturing accuracy and low sensitivity to solid particles (Zhang et al., 2016a).
The internal flow in the gas–liquid rotodynamic pump is complicated because of the high-speed rotating effect of the impeller, the rotor-stator action, and the phase interaction (Zhu and Zhang, 2017; Li et al., 2019). The complex multiphase flow is usually accompanied by the merging and splitting of bubbles and phase content pulsation (Barrios and Prado, 2011; Cubas et al., 2020). In addition, nonuniform flow patterns, such as the isolated bubble flow, bubble flow, gas pocket flow, and segregated gas flow usually occur (Murakami and Minemura, 1974; Zhang et al., 2016b; Minemura and Murakami, 1980; Zhang et al., 2015). The complex flow mentioned above results in significant performance degradation and mixing transportation capacity reduction of the gas–liquid rotodynamic pump.
To expand the performance of gas–liquid rotodynamic pumps, a combination of optimization design technology and CFD simulation is usually adopted (Suh et al., 2017b; Zhang et al., 2011; Zhang et al., 2017). The optimization design methods usually include the design of experiment (DOE) (Taguchi, 1976), response surface method (RSM) (Bonaiuti and Zangeneh, 2009), and multi-objective optimization algorithm (MGOA) (Deb et al., 2002). Kim et al. (2015) combined DOE, RSM, and CFD to expand the performance of a gas–liquid rotodynamic pump, which proved that nonuniform flow patterns were suppressed and the energy loss was reduced with their proposed optimized model. Suh et al. (2017b) improved the efficiency and head of a gas–liquid rotodynamic pump with two stages by combining central composite methods and multi-objective evolutionary algorithms. Zhang et al. (2011) increased the region of high efficiency for a multiphase pump by combining the genetic algorithm and the quasi-3D hydraulic design.
It is found from the optimization designs of the multiphase pump that the optimization variables are mainly the blade shape parameters, and parameters directly controlling the blade loading are not taken into consideration. Meanwhile, the optimization objectives are mainly the efficiency and head of the pump, and the gas–liquid flow parameters are hardly considered. As a result, the performance of the multiphase pump has not yet reached the expected level.
The purpose of this article is to improve the transportability of a multiphase rotodynamic pump with a two-step multi-objective optimization strategy. The transportability improvement for the pump impeller is achieved by implementing the optimization variables of its geometry and blade loading and the optimization objectives containing the pump efficiency and gas uniformity. The structure of the article is arranged as follows. First, the structural parameters of the optimization object and the purpose of this article are introduced. Second, a two-step multi-objective optimization design system is constructed using a 3D design theory and multi-objective optimization techniques. Then, both the geometry and loading of the impeller are optimized to obtain a multiphase pump with excellent performance. Finally, the gas void fraction, turbulence kinetic energy, vortex structure, and pressure fluctuation are deeply analyzed to clarify the biphasic characterization in the pump before and after optimization.
Figure 1A is the original multiphase rotodynamic pump model. Its nominal flow rate is 50 m3/h, the nominal head is 15 m, and the nominal speed is 2,950 r/min. The number of impeller and guide vane blades is 4 and 11, respectively. The other structural characteristics of impeller and guide vane, such as the radius of shroud and hub at inlet and outlet and the axial distance are shown in Figure 1B.
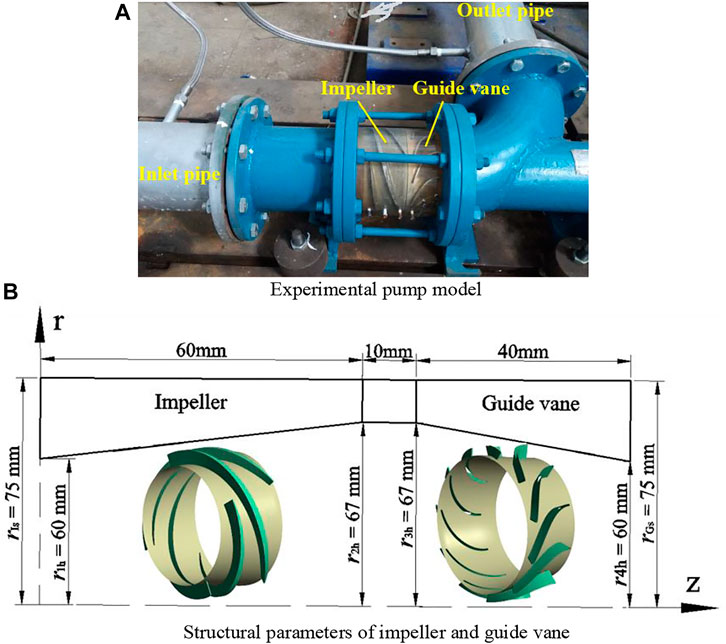
FIGURE 1. Gas–liquid rotodynamic pump model and structural parameters. (A) Experimental pump model. (B) Structural parameters of impeller and guide vane.
The high-speed rotating impeller is the main pressurization part of the gas–liquid rotodynamic pump, so it is also regarded as the most important component. The flow separation between gas and liquid is usually obvious because of the centrifugal force, resulting in a significant decrease in pump performance (Barrios and Prado, 2011; Monte Verde et al., 2017). Therefore, in this study, the optimization design of the impeller is carried out to extend the transportability of the original gas–liquid rotodynamic pump.
Figure 2 is the optimization design system for the gas–liquid rotodynamic pump, which includes the BladeGen, TurboDesign, and iSIGHT platforms. The BladeGen and TurboDesign platforms with 3D design theory are used to create the impeller geometry and blade loading, respectively. The iSIGHT is the optimization platform of the multiphase pump, which integrates the CFD simulation, DOE, RSM, and MGOA. In the optimization design process, the gas–liquid flow parameter is contained to improve the transportability of the pump significantly.

FIGURE 2. Multi-objective optimization design system.
The impeller model can be created with many softwares which are developed based on 1D theory, 2D theory, or 3D theory (Zhao et al., 1985; Wu, 1952). BladeGen is a software for 3D design of fluid machinery. In BladeGen, the meridional shape of the impeller is obtained by inputting the radius of the leading and trailing edges and the axial distance. A 3D impeller could be created by providing the blade angle of pressure and suction surfaces or the blade thickness and blade wrap angle.
TurboDesign is another 3D software, which is developed based on the flow inviscid 3D inverse design method (Zangeneh, 1991; Zangeneh et al., 1998; Zangeneh et al., 2009). In solving process, the velocity in the impeller is divided into the circumferential average component and the periodic component. The vortex, source, and sink on the blade center surface are used to stand for the blade effect on the flow. The circumferential average flow is solved using Euler equations, while the periodic flow is solved using Clebsch transformation (Goto et al., 2002; Peng et al., 2002). The blade shape can be obtained by integrating the blade wrap angle along the projection direction of streamlines on the meridian plane. The blade equation is given as follows (Zhu et al., 2015):
where
The optimization methods for the multiphase pump mainly include the DOE (Taguchi, 1976; Shi et al., 2020), RSM (Bonaiuti and Zangeneh, 2009), and MGOA (Deb et al., 2002).
DOE method is adopted to ensure the reasonable layout of the impellers in the design space. It is helpful to get an accurate functional model that represents the relationship between variables and objectives. Latin hypercube design (LHD) is a popular method in DOE, which can realize good space-filling and nonlinear response fitting. (Myers et al., 2009). The optimal Latin hypercube design (OLHD) makes test points distribution more uniform than the random Latin hypercube design (RLHD), as shown in Supplementary Figure S1. Therefore, OLHD can make an accurate fitting between factor and response (McKay et al., 2000; Ghorani et al., 2020; Xie et al., 2021) and is adopted in this study.
RSM is a commonly adopted approximate model method with good robustness, which is used to obtain an accurate approximation function relationship in the local range with fewer sample points (Myers et al., 1989; Myers, 1999). Supplementary Figure S2 shows the RSM results of optimization of a gas–liquid rotodynamic pump (Suh et al., 2017a), that is, the response surface relationship between the design variables (d_betal_s, d_betal_h) and the optimized pump efficiency (ƞ).
The minimum number of sample points to establish the response surface model is closely related to the model order and input variable numbers. For the second-order polynomial and m input variables, the mathematical expression is as follows:
where
The calculation method of the minimum number of samples is as follows:
The unknown coefficient in the approximate response surface function is solved by minimizing the quadratic sum of response errors using the least-squares principle.
The multi-objective algorithms mainly include VEGA (Schaffer, 1985), MOGA (Dias and Vasconcelos, 2002), NPGA (Horn et al., 1994), NSGA (Nandasana et al., 2003), and NSGA-II (Deb, 2000). NSGA-II is widely popular because of the application of the fast non-dominated sorting, crowded-comparison operator, and elitist strategy. Compared to NSGA, NSGA-II has some strengths, such as high optimization accuracy, low computational complexity, and good distribution uniformity of Pareto optimal solution. The NSGA-II procedure is shown in Supplementary Figure S3 (Deb et al., 2002).
In this study, the Reynolds average N-S equations are solved by ANSYS-CFX. The basic governing equations in the Cartesian coordinate are as follows (Lane et al., 2005; Tabib and Schwarz, 2011; Liu et al., 2017):
Continuity equations
Momentum equations
where subscripts k = l and g denote water and gas, respectively. αk is the void fraction, and αl + αg = 1. τ is the viscous stress tensor and can be expressed as follows:
where
The turbulent transport term in time-averaged equations is solved with the SST k-ω model. This model joins the modeling idea of the k-ε and k-ω models. In the near-wall and mainstream regions, the k-ω and k-ε models are adopted, respectively. The defect law layer of the boundary layer is solved jointly by the k-ω and k-ε models. Therefore, the SST k-ω model could predict the flow separation with inverse pressure gradient more accurately. (Menter, 1994; Zhang, 2000). The expressions of the k and ω equations are as follows.
and
where
A two-phase flow model is very important for the simulation of a multiphase pump, which includes the Lagrange and Euler models. In this study, Euler two-fluid model is used because of its higher numerical accuracy than the homogeneous model and diffusion model (Monte Verde et al., 2017; Suh et al., 2018). In this model, the conservation equation is established for each component. Not only does the momentum and energy exchange exist in two components but sometimes the mass exchange also exists. Moreover, the equations for each component are coupled by the interaction in components.
Figure 3 is the grid of the computational domain with the whole flow passage. The grids of the inlet and outlet pipes are generated using ICEM CFD software. The grids of the impeller and guide vane are generated using TurboGrid software. Moreover, the grid independence analysis for the original pump is conducted in the previous study (Zhang et al., 2019). The influence of grid numbers can be ignored if it exceeds 3.68 million. The mass flow rate and phase void fraction are specified for the inlet, and the pressure is specified for the outlet. Meanwhile, the frozen rotor model and the transient rotor-stator model are applied for describing the rotor-stator interaction effects in steady and unsteady simulations, respectively. The second-order upwind scheme is used to solve the convection and turbulent kinetic energy terms. The RSM residual error is set as 1 × 10⁻⁴.
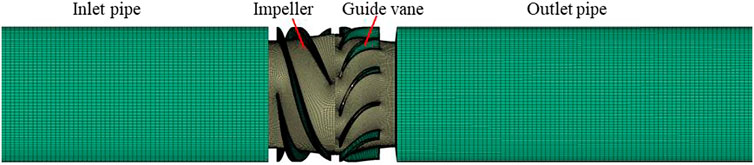
FIGURE 3. Grid of the computational domain with whole flow passage.
The numerical methods are proved to be reliable by comparing numerical values with experimental data of the original pump. Supplementary Figure S4 shows the pump head at different IGVFs (Q = Qd, n = 2950 r/min) and different rotating speeds (Q = Qd, IGVF = 9%). At different IGVFs and different rotating speeds, the variation trend of numerical results of the pump head is the same as the experimental values, and the maximum errors are 3.27% at IGVF = 15% and 4.35% at n = 3,250 r/min, respectively. In addition, the internal flow results from the high-speed photography and CFD simulation are obtained at the conditions of IGVF = 9%, Q = Qd, and n = 2,950 r/min, as shown in Supplementary Figure S5. The internal flow results from the experiment and CFD simulation show that the gas in the impeller accumulates near the blade SS of the impeller outlet. This is caused by the combined action of the centrifugal force generated by the rotating impeller and the pressure difference between SS and PS. Meanwhile, the range of gas accumulation in the guide vane is larger. Compared to the experiment, the CFD results capture more abundant flow information, that is, large-scale vortexes in the guide vane are obtained.
The optimization variables of impeller geometry include the height at impeller inlet (b), the abscissa and ordinate coordinates of the control point on hub curve (M(zi, ri)), and other three important parameters for impeller shape, that is, blade thickness (δ), maximum thickness location (h), and blade wrap angle (f). The meridional geometry of the impeller and distribution law of the blade thickness are shown in Figure 4, respectively. More specifically, the hub curve of the impeller meridional plane is a second-order Bessel curve in the optimization process. The range of selected optimization variables is listed in Table 1 from design experiences. b0, f0, δ0, h0, z0, and r0 are the corresponding parameters of the original impeller shown in Figure 1.
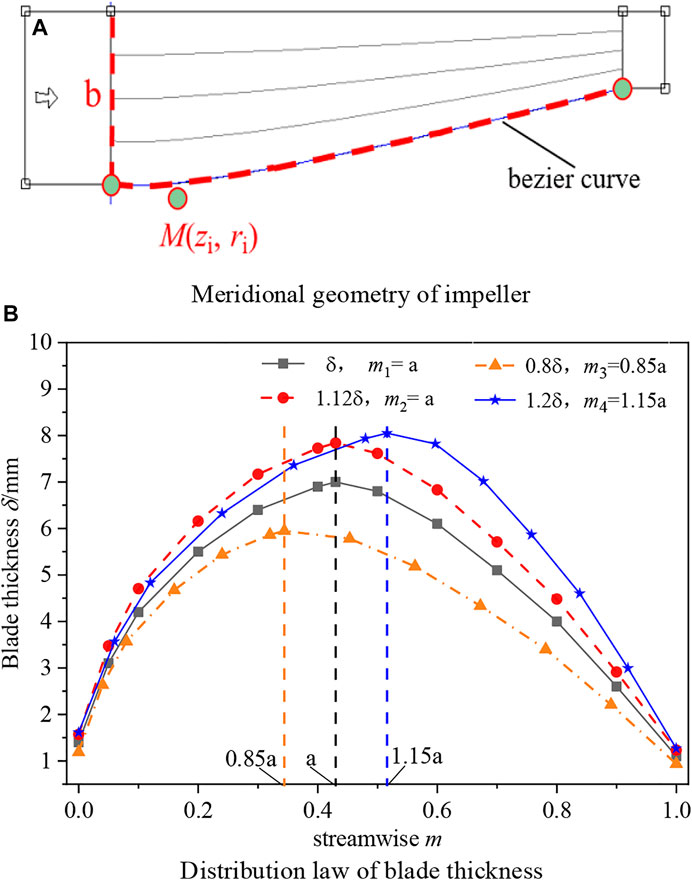
FIGURE 4. Distribution law of meridional geometry and blade thickness of impeller. (A) Meridional geometry of impeller. (B) Distribution law of blade thickness.
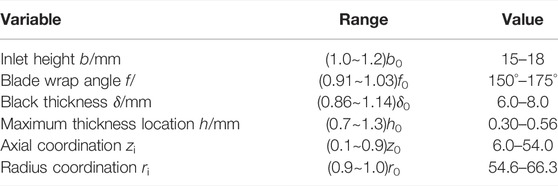
TABLE 1. Optimization variables.
Two optimization objectives are selected, that is, pump efficiency at IGVF = 10% (η) and gas uniformity at impeller outlet (S). S is defined as follows:
where
For the two optimization objectives, the higher pump efficiency at IGVF = 10% is better, while the gas uniformity at the impeller outlet is closed related to the pressure and velocity fields therein. The more uniform gas void fraction at the impeller outlet (i.e., higher S) represents the better flow state in the impeller, which is conducive to the transportation of fluid medium in the next unit stage of the multiphase pump.
The response surface function with the quadratic polynomial is determined by the numerical results of 50 original samples, which is larger than 28 samples that required at least. In the optimization process, the NSGA-II algorithm is applied. The generation numbers and population size are set as 100. The crossover probability, crossover index, and mutation index are set as 0.9, 10, and 20, respectively.
Supplementary Figure S6 shows the global effect of optimization variables on pump efficiency and gas uniformity. The global effect degree of independent variable xi from the dependent variable E (x1, x2, … , xn) could be calculated as follows:
Supplementary Figure S6A shows that the effect of blade wrap angle f on the pump efficiency is the largest, followed by the variables zi, ri, δ, h, and b. For the gas uniformity, Supplementary Figure S6B displays that the influence of ordinate coordinate ri of point M(zi, ri) is the greatest, followed by the f, zi, δ, b, and h. Therefore, the blade wrap angle f and point M(zi, ri) have relatively large effects on pump efficiency and gas uniformity, while the influences of the height at impeller inlet b and the maximum thickness location h are relatively small. According to the above mentioned analyses, more attention should be paid to the blade wrap angle and hub shape for the optimization of the multiphase pump impeller.
In this study, 10,000 impellers are obtained based on the established response surface model. The abscissa and ordinate in Figure 5 represent the gas uniformity and pump efficiency, respectively. Blue dots represent impellers that form Pareto optimal solutions. Three representative optimized impellers, that is, B-Opt1, B-Opt2, and B-Opt3, on the Pareto front are simulated to prove the precision of the response surface model.
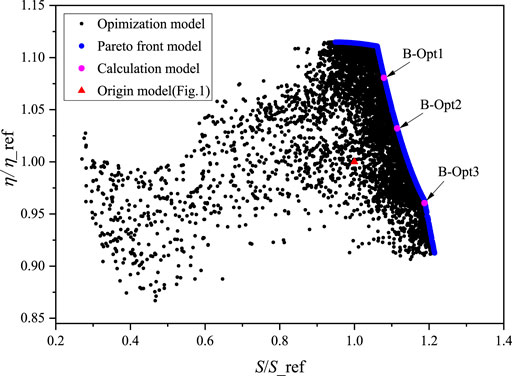
FIGURE 5. Pareto distribution of optimization results of impeller geometry.
Comparative analyses of the pump efficiency and gas uniformity from CFD simulations and the RSM are performed, as listed in Table 2. Results of the original pump shown in Figure 1 are also included. It is known from Table 2 that the pump efficiency and gas uniformity from CFD simulations are generally consistent with that of the RSM. The maximum differences in the pump efficiency and gas uniformity between the CFD simulations and the RSM are 2.79% and 4.99%, respectively. These analyses indicate that the established response surface model is reliable.
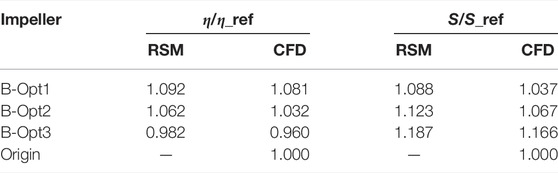
TABLE 2. Optimization results of impeller geometry.
The pump numerical efficiencies with B-Opt1, B-Opt2, and B-Opt3 are 1.081, 1.032, and 0.960 times that of the original pump, while their gas uniformities are 1.037, 1.067, and 1.166 times that of the original impeller. In other words, except for a slight drop in the pump efficiency of B-Opt3, the three optimized impellers improve their pump efficiency and gas uniformity.
Figure 6 shows the meridional shape and blade wrap angle of the impeller before and after optimization. Compared to the original impeller, the meridional flow passage area of B-Opt1, B-Opt2, and B-Opt3 is large. Meanwhile, the blade wrap angle of B-Opt1 with the highest efficiency is smaller than that of the B-Opt2, B-Opt3, and original impeller. Therefore, it can be concluded that a relatively large impeller passage is helpful to the transportation of medium, while a relatively small blade wrap angle improves the pump efficiency significantly.
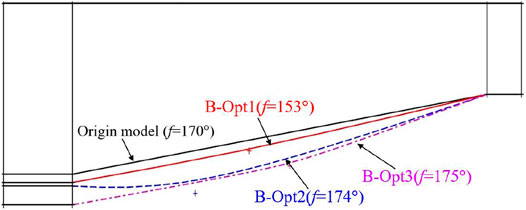
FIGURE 6. Meridional shape for impellers before and after optimization.
The pressure of blade pressure and suction surfaces for the impeller is shown in Figure 7. The pressure of blade pressure and suction surface at the impeller inlet changes sharply, which is attributed to the transition from the irrotational flow to the rotational flow. Compared with the original impeller, the pressure difference with different spans is larger at the front part of optimized impellers, while it is smaller at the middle and tail parts. This illustrates that the differential pressure at the blade front part is important to the work capacity of the multiphase pump. B-Opt1 has the largest pressure difference at the blade front part. Furthermore, it changes smoothly along the streamwise direction. Therefore, B-Opt1 is selected as the initial impeller to carry out the optimization design of impeller loading in the next step.
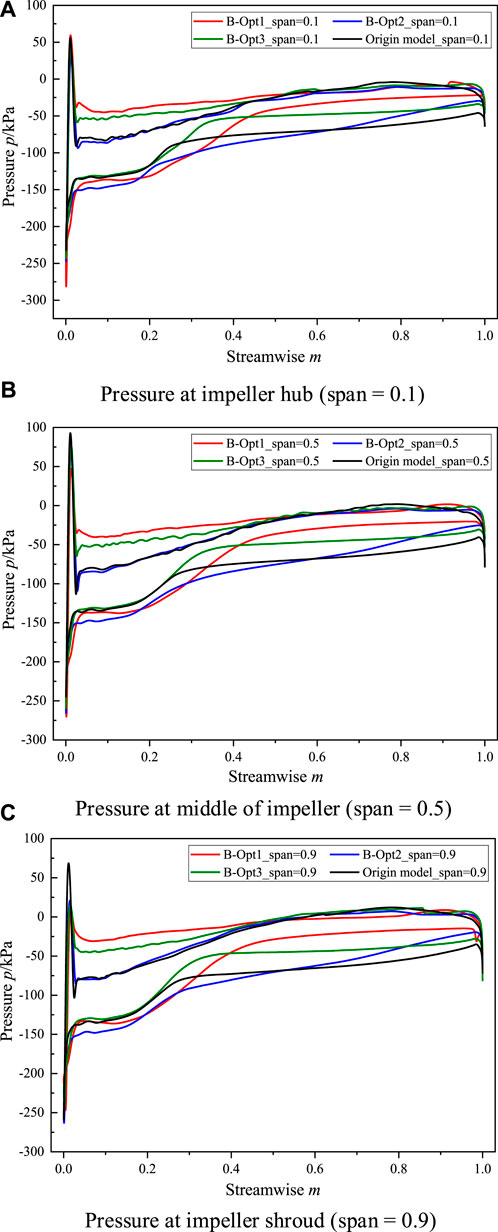
FIGURE 7. Pressure distribution for impellers (IGVF = 10%). (A) Pressure at impeller hub (span = 0.1). (B) Pressure at middle of impeller (span = 0.5). (C) Pressure at impeller shroud (span = 0.9).
Through the optimization of impeller geometry, the impeller with high efficiency and good gas uniformity is obtained at IGVF = 10%. However, the overall performance of the gas–liquid rotodynamic pump has not yet reached an expected level. Moreover, the blade loading is not optimized directly in the first step. To further improve the pump transportability, the blade loading is optimized directly in the second step.
When TURBO design software is used to design an impeller, the blade loading and high-pressure edge angle are the main input variables. The blade loading is represented by
Figure 8 is the distribution law of impeller blade loading, which has three parts, that is, the parts of the leading and trailing edges are parabolic, and the middle part is linear. In the optimization process, dH and dS are set as 0 because of the irrotational flow at the inlet of the impeller. According to the optimization results of impeller geometry, the loading distribution at the blade front part is important. Therefore, the value range of intersection points m1,S, m1,H is set to 0.05–0.35, the value range of m2,S, m2,H is set to 0.65–0.95, and the value range of kS and kH is set to −2.0–0.

FIGURE 8. Loading distribution for impeller blade.
The high-pressure edge angle θ is the initial boundary condition for solving the blade equation, and its definition is shown in Figure 9. The relationship between high-pressure edge angle θ and blade lean angle b is given in expression Eq. 16. We assume that the θ is positive if it is consistent with the rotation of the impeller; otherwise, it is negative. As it is difficult to obtain a smooth blade shape if the θ > 10°or θ < -10°, the value range of θ is set to −10°–10°.
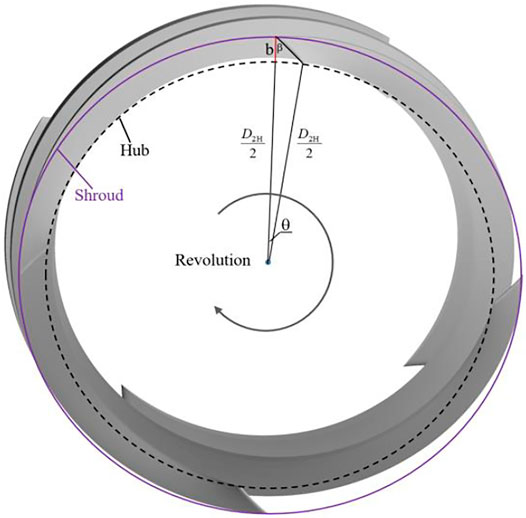
FIGURE 9. Definition of high-pressure edge angle.
Table 3 shows the information of optimization variables, which include m1,S, m1,H, m2,S, m2,H, kS, kH, and θ. The optimization objectives are consistent with that in Section 4, that is, pump efficiency at IGVF = 10% and gas uniformity at impeller outlet. The parameter settings of the multi-objective optimization algorithm are the same as those in the optimization of the impeller geometry.
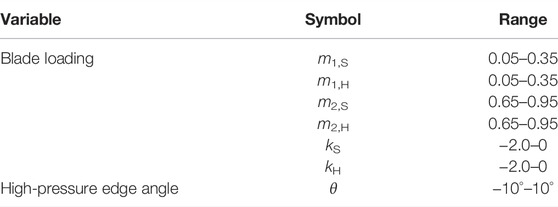
TABLE 3. Optimization variables.
Figure 10 shows the influence degree of variables (i.e., m1,S, m1,H, m2,S, m2,H, kS, kH, θ) on the optimization objectives (i.e., η and S). At the intersection point m1,H, the slopes kS and kH have significant impacts on the pump efficiency, while at the high-pressure edge angle θ, the slopes kS and kH are prominent for the gas uniformity.
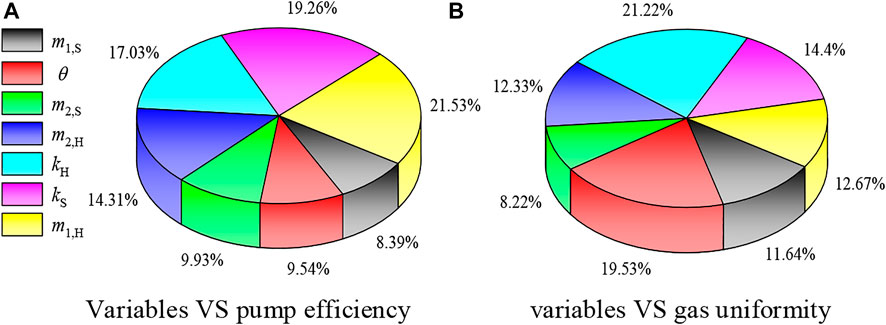
FIGURE 10. Influence of variables on pump efficiency and gas uniformity (IGVF = 10%). (A) Variables VS. pump efficiency. (B) variables VS. gas uniformity.
Figure 11 is the Pareto results of impeller loading optimization. Here, B-Opt1 from the optimization of impeller geometry is marked. Three optimized impellers (T-Opt1, T-Opt2, and T-Opt3) are simulated to compare with the RSM results, as listed in Table 4. The pump efficiency and gas uniformity from CFD simulation are generally consistent with that from RSM. The maximum difference in pump efficiency between CFD and RSM is about 3.55%, while it is about 4.46% for the gas uniformity. The CFD efficiencies of T-Opt1, T-Opt2, and T-Opt3 are 1.026, 1.010, and 0.965 times that of B-Opt1, respectively. The gas uniformities of T-Opt1, T-Opt2, and T-Opt3 are 1.031, 1.033, and 1.068 times that of B-Opt1, respectively. Meanwhile, except for T-Opt3, the other three impellers have a large negative high-pressure edge angle.
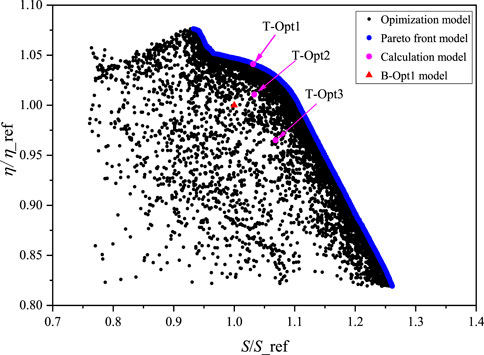
FIGURE 11. Pareto results of impeller loading optimization.
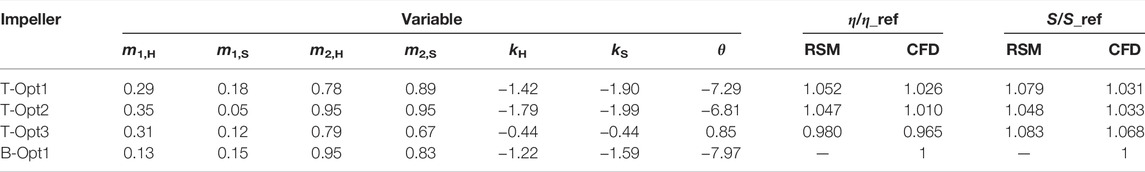
TABLE 4. Optimization results of impeller blade loading.
Figure 12 shows the impeller loading distributions. The loading at the leading edge part and the slope at the middle part of T-Opt1, T-Opt2, and B-Opt1 are larger than that of T-Opt3. When m is greater than 0.33, 0.22, or 0.24, the hub loadings of T-Opt1, T-Opt2, and T-Opt3 are larger than their shroud loadings, while the value of m is 0.57 for B-Opt1. Combining the analysis results in Table 4, it can be concluded that large loading at the leading edge part, large slope at the middle part, and large negative high-pressure edge angle are helpful to the improvement of pump efficiency. The gas uniformity in the pump can be improved if the hub loading at the middle and trailing parts is larger than the shroud loading.
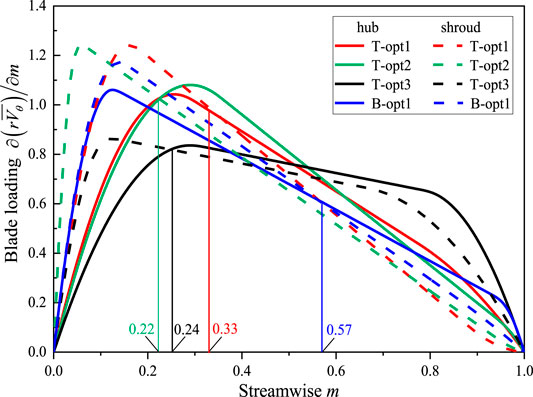
FIGURE 12. Loading distribution of impeller before and after optimization.
Through the optimization of impeller geometry and blade loading, impellers with excellent performance are obtained. Figure 13 is the GVF in the original impeller, B-Opt1, and T-Opt1. Gas accumulates at the blade suction surface for all impellers. There exists a pressure difference between blade sides, and the gas with smaller density has larger acceleration and moves to the blade suction surface. Meanwhile, the gas accumulation in the original impeller is the most severe, while there is only unobvious gas accumulation near the blade suction surface of impeller T-Opt1. Therefore, the pump transportability is improved significantly with our two-step multi-objective optimization design.
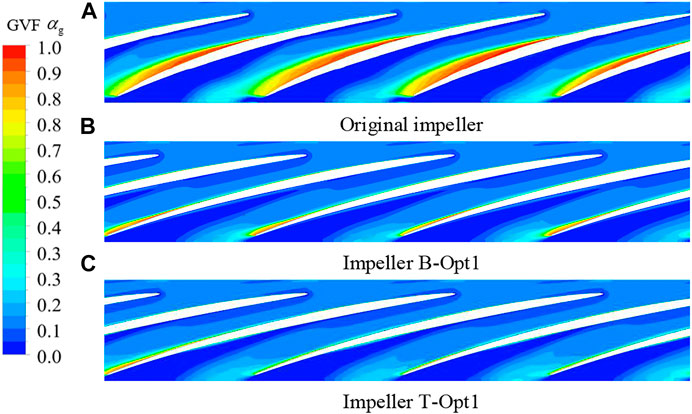
FIGURE 13. GVF in impeller before and after optimization (span = 0.5). (A) Original impeller. (B) Impeller B-Opt1. (C) Impeller T-Opt1.
The velocity, streamline, and turbulence kinetic energy (TKE) of water in the impeller before and after optimization is displayed in Figure 14. For the original impeller, an obvious low-velocity region appears near the blade suction surface, and large-scale vortexes form therein. Meanwhile, the TKE of the original impeller is also the largest, especially at the blade suction surface. After the first-step optimization design, the low-velocity region and vortex in B-Opt1 are suppressed effectively, and the TKE intensity also becomes smaller. After the second-step optimization design, the flow state in T-Opt1 is further improved. The low-velocity region is further reduced, and there is no obvious flow separation.
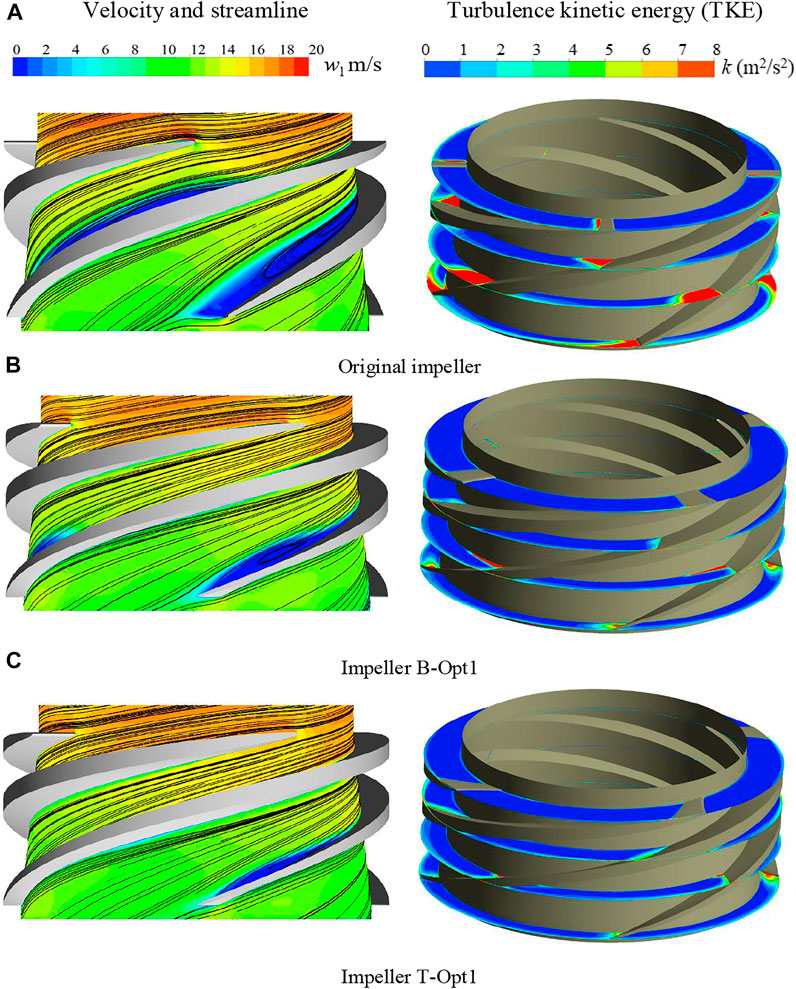
FIGURE 14. Velocity and streamline of liquid in impeller (span = 0.1). (A) Original impeller. (B) Impeller B-Opt1. (C) Impeller T-Opt1.
The unsteady CFD simulations are conducted to analyze the pressure fluctuation in the pump. The locations of monitoring points are displayed in Figure 15 Here, eight points marked as R1C ∼ R4C and S1C ∼ S4C are uniformly set in impeller and guide vane passages. The other two points, RS1C and RS2C, are located at the impeller outlet and guide vane inlet, respectively. After the time-step independence analysis, the time-step Δt is set as 1.13 × 10⁻⁴ s, which corresponds to the time that the impeller rotates 2°. In this study, a total of 20 cycles for impeller rotating are calculated.
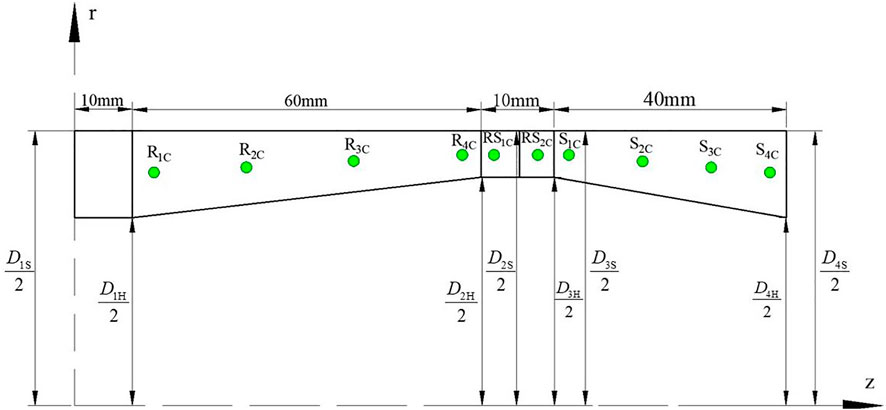
FIGURE 15. Locations of monitoring points.
Figure 16 shows the pressure variation of points R1C ∼ R4C and RS1C within a stable period. The pressure fluctuation of points R1C and R2C are insignificant and have no periodic property. This is because points R1C and R2C are located near the impeller inlet and are subject to weak rotor-stator interaction between the impeller and guide vane. The pressure increases gradually with flow direction and has an obvious periodicity for points R3C, R4C, and RS1C, which is attributed to the large rotor-stator interaction. Moreover, eleven peaks and valleys appear in one circle, which coincides with the number of guide vane blades.
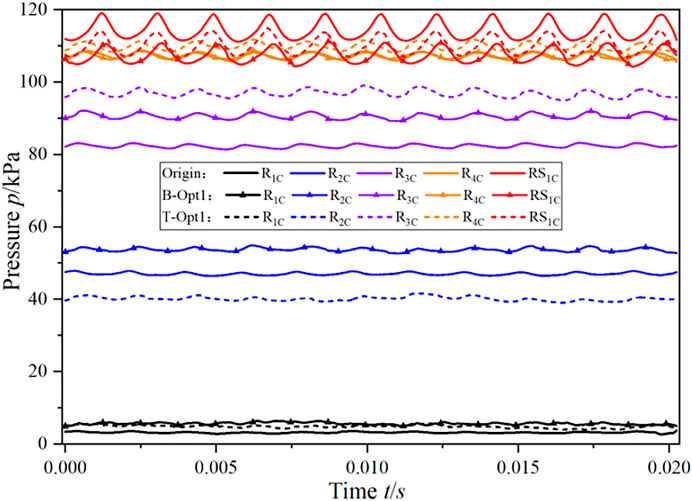
FIGURE 16. Pressure variation of points R1C ∼ R4C and RS1C (IGVF = 10%).
Figure 17 shows the frequency domain characteristics of points. The pressure fluctuation of points R1C ∼ R4C increases gradually along the flow direction. The pressure fluctuation of point RS1C increases significantly for the three impellers, which not only have the largest fluctuation amplitude with the dominant frequency of 11fn but also have a relatively large fluctuation amplitude with the second dominant frequency of 2 × 11fn.
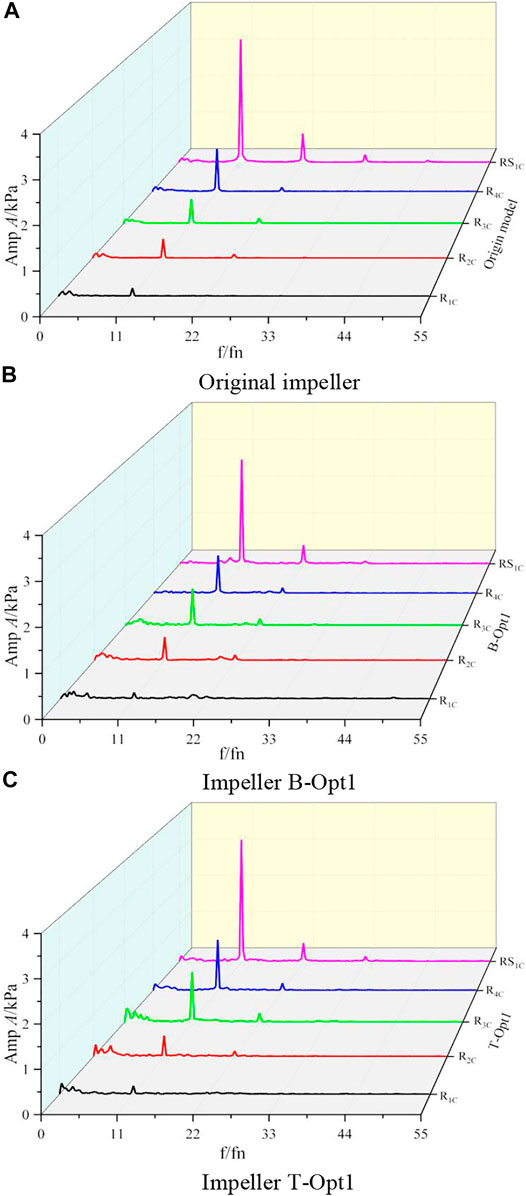
FIGURE 17. Frequency-domain characteristics of points R1C ∼ R4C and RS1C. (A) Original impeller. (B) Impeller B-Opt1. (C) Impeller T-Opt1.
Table 5 lists the dominant frequency f1 and its corresponding amplitude A1 in the impeller. Overall, the f1 of points R1C ∼ R4C and RS1C are 11fn, which illustrates that the rotor-stator action is a drive for the pressure fluctuation when the IGVF is small (IGVF = 10%). Meanwhile, the pressure fluctuation differences among the original impeller, B-Opt1, and T-Opt1 are relatively small. But it is worth mentioning that for the maximum fluctuation amplitudes, the values of the optimized impellers B-Opt1 and T-Opt1 are decreased by 15.81% and 0.61% compared to the original impeller, respectively.
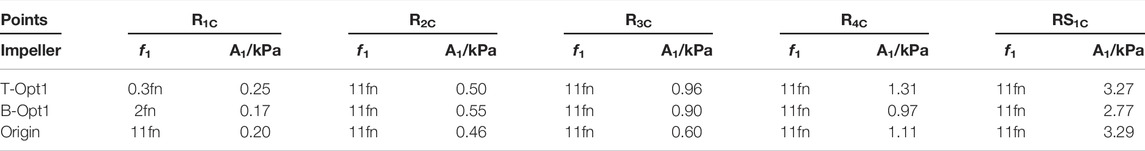
TABLE 5. Dominant frequency and its corresponding amplitude of points in impeller.
Figure 18 shows the pressure fluctuation of points RS2C and S1C ∼ S4C in the GV_O, GV_B, and GV_T, which corresponds to the original impeller, B-Opt1, and T-Opt1, respectively. The pressure fluctuation with a dominant frequency of 4fn gradually decreases from the inlet to the outlet of the guide vane, which illustrates that the rotor-stator action is gradually weakened. Furthermore, a frequency 8fn with a relatively large fluctuation amplitude occurs, especially for points RS2C and S1C, and that is also because of strong rotor-stator action.
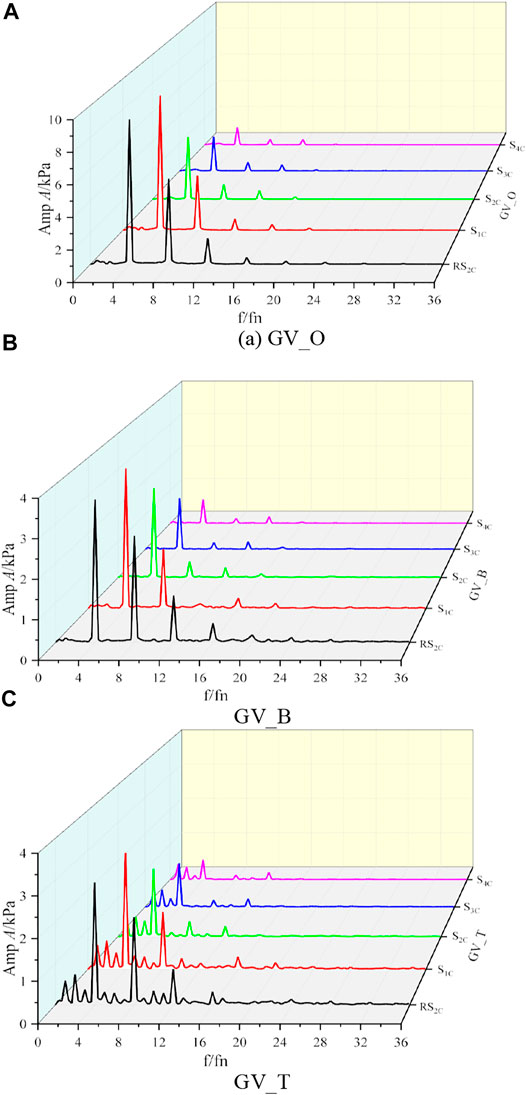
FIGURE 18. Frequency-domain characteristics of points in guide vane. (A) GV_O. (B) GV_B. (C) GV_T.
Table 6 shows the f1 and A1 in the guide vane. It is known from Table 6 that the fluctuation amplitudes of points RS2C and S1C are larger than that of the other points in the guide vane. Compared with GV_O, the fluctuations in GV_B and GV_T are small. For the maximum fluctuation amplitudes, its value in GV_B and GV_T is decreased by 59.32% and 67.76%, respectively. The pressure fluctuation behaviors are closely associated with the flow patterns in the guide vane. Figure 19 displays the vortex structures of water obtained by the vortex criterion Q. Here, the definition of Q is written as follows (Hunt and Wray, 1988; Fu et al., 2013):
where S and Ω can be expressed as follows:
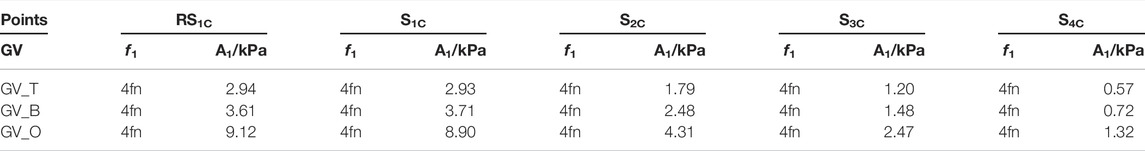
TABLE 6. Dominant frequency and its corresponding amplitude of points in guide vane.
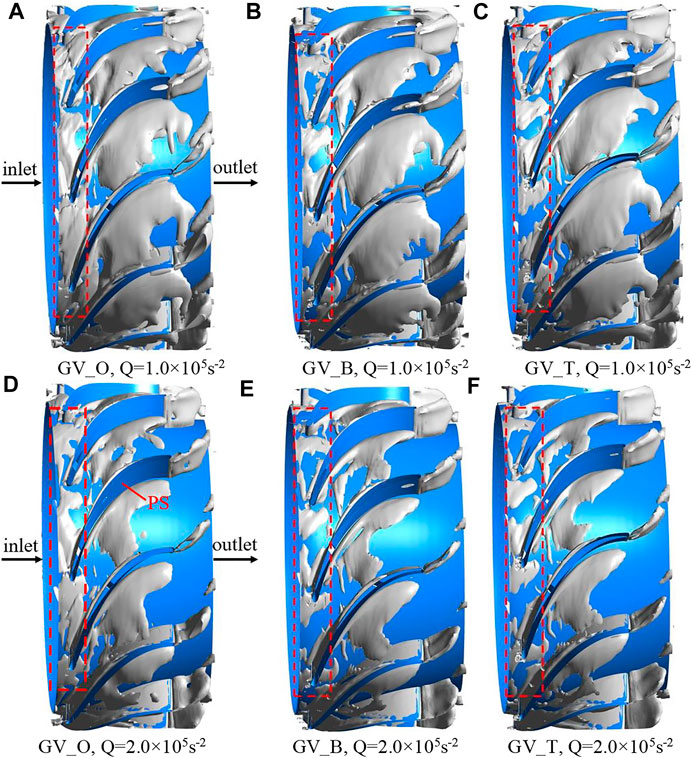
FIGURE 19. Vortex structure in the guide vane. (A) GV_O, Q = 1.0 × 10⁵s−2. (B) GV_B, Q = 1.0 × 10⁵s−2. (C) GV_T, Q = 1.0 × 10⁵s−2. (D) GV_O, Q = 2.0 × 10⁵s−2. (E) GV_B, Q = 2.0 × 10⁵s−2. (F) GV_T, Q = 2.0 × 10⁵s−2.
The Q criterion represents a balanced relationship between the rotation and deformation of fluid clusters. The rotation is dominant if Q > 0. The vorticity is large if it is close to the vortex center in the flow field. To compare and analyze the characteristics and distribution law of the vortex structures in the guide vane, Q = 1.0 × 10⁵ s−2 and Q = 2.0 × 10⁵ s−2 are selected in this study.
Figure 19 shows that there are obvious vortex structures in the guide vane at Q = 1.0×10⁵ s−2. When the Q increases to 2.0×10⁵ s−2, the vortex structures in the guide vane become less and are mainly gathered near the blade pressure surface, which illustrates that the strong vorticity is mainly concentrated at the pressure surface of the guide vane. Compared to GV_O, the vortex structures in GV_B and GV_T are reduced, indicating that our two-step optimization helps to suppress the development of vortexes. At the inlet of GV_B and GV_T, the vortex structures decrease significantly, which contributes to the decrease of fluctuation in the guide vane.
A two-step multi-objective optimization design system for a gas–liquid rotodynamic pump is constructed using a 3D design theory and multi-objective optimization techniques. The transportability improvement for the pump impeller is achieved by implementing the optimization variables of its geometry and blade loading and the optimization objectives containing the pump efficiency and gas uniformity.
1) The optimization design for the impeller geometry is carried out by considering the geometry parameters, such as the height at the impeller inlet, control parameters of hub curve, blade thickness, maximum thickness location, and blade wrap angle. The results show that the blade wrap angle and control parameters of the hub have remarkable effects on the pump efficiency and gas uniformity.
2) Based on the optimization results of impeller geometry, the impeller is further optimized by considering the blade loading and high-pressure edge angle. The results show that large loading at the leading edge, large slope at the middle part, and large negative high-pressure edge angle are helpful in improving pump efficiency. The gas uniformity is improved when the hub loading at the middle and trailing parts is larger than the shroud loading.
3) The pump efficiency and gas uniformity of B-Opt1 are 1.081 and 1.037 times that of the original test impeller, respectively. The pump efficiency and gas uniformity of T-Opt1 are 1.026 and 1.031 times that of B-Opt1, respectively. Compared to the original test impeller, the maximum fluctuation amplitudes in B-Opt1 and T-Opt1 are reduced by 15.81% and 0.61%, and the maximum fluctuation amplitudes in the corresponding guide vane are reduced by 59.32% and 67.76%, respectively.
The original contributions presented in the study are included in the article/Supplementary Material, further inquiries can be directed to the corresponding author.
WZ analyzed the data and wrote the manuscript. DZ and ZM carried out proofreading. BZ and FW conceived and designed the optimization design system. All authors listed have approved the submitted version of the manuscript.
This work was supported by the National Natural Science Foundation of China (grant number 52109107, 52009136), Open Research Subject of Key Laboratory of Fluid and Power Machinery (Xihua University), Ministry of Education (grant number LTDL 2020-002), Open Research Fund Program of State Key Laboratory of Hydroscience and Engineering (grant number sklhse-2022-E-03), Joint Open Research Fund Program of State Key Laboratory of Hydroscience and Engineering and Tsinghua–Ningxia Yinchuan Joint Institute of Internet of Waters on Digital Water Governance (grant number sklhse-2022-Iow12), and Beijing Municipal Natural Science Foundation (grant number 3212021).
Author ZM is employed by China three gorges corporation.
The remaining authors declare that the research was conducted in the absence of any commercial or financial relationships that could be construed as a potential conflict of interest
All claims expressed in this article are solely those of the authors and do not necessarily represent those of their affiliated organizations, or those of the publisher, the editors, and the reviewers. Any product that may be evaluated in this article, or claim that may be made by its manufacturer, is not guaranteed or endorsed by the publisher.
The Supplementary Material for this article can be found online at: https://www.frontiersin.org/articles/10.3389/fenrg.2022.900182/full#supplementary-material
Supplementary Figure S1 | Distribution of test points in RLHD and OLHD (A) RHLD, (B) OHLD.
Supplementary Figure S2 | RSM results of a multiphase pump (Suh et al., 2017a).
Supplementary Figure S3 | NSGA-II procedure.
Supplementary Figure S4 | Pump head with CFD simulation and experiment.
Supplementary Figure S5 | Flow field in the pump (IGVF = 9%, Q = Qd, n = 2950 r/min, SS: suction surface, PS:pressure surface) (A) Experimental flow field, (B) Numerical flow field.
Supplementary Figure S6 | Influence of variables on pump efficiency and gas uniformity (IGVF = 10%) (A) Variables VS pump efficiency. (B) Variables VS gas uniformity.
CFD, computational fluid dynamics; DOE, design of experiment; IGVF, inlet gas void fraction; LHD, Latin hypercube design; MOGA, Multi-objective genetic algorithm; NPGA, niched Pareto genetic algorithm; NSGA, non-dominated sorting genetic algorithm; OLHD, optimal Latin hypercube design; RLHD, random Latin hypercube design; RSM, response surface method; VEGA, vector evaluated genetic algorithm.
Barrios, L., and Prado, M. G. (2011). Experimental Visualization of Two-phase Flow inside an Electrical Submersible Pump Stage. J. Energy Resour. Technol. 133 (4), 1–12. doi:10.1115/1.4004966
Bonaiuti, D., and Zangeneh, M. (2009). On the Coupling of Inverse Design and Optimization Techniques for the Multiobjective, Multipoint Design of Turbomachinery Blades. J. Turbomach. 131 (2), 1–16. doi:10.1115/1.2950065
Cao, S., Peng, G., and Yu, Z. (2005). Hydrodynamic Design of Rotodynamic Pump Impeller for Multiphase Pumping by Combined Approach of Inverse Design and CFD Analysis. J. Fluids Eng. 127 (2), 330–338. doi:10.1115/1.1881697
Cubas, J. M. C., Stel, H., Ofuchi, E. M., Marcelino Neto, M. A., and Morales, R. E. M. (2020). Visualization of Two-phase Gas-Liquid Flow in a Radial Centrifugal Pump with a Vaned Diffuser. J. Petroleum Sci. Eng. 187, 1–14. doi:10.1016/j.petrol.2019.106848
Deb, K. (2000). An Efficient Constraint Handling Method for Genetic Algorithms. Comput. Methods Appl. Mech. Eng. 186 (2), 311–338. doi:10.1016/S0045-7825(99)00389-8
Deb, K., Pratap, A., Agarwal, S., and Meyarivan, T. (2002). A Fast and Elitist Multiobjective Genetic Algorithm: NSGA-II. IEEE Trans. Evol. Comput. 6 (2), 182–197. doi:10.1109/4235.996017
Dias, A. H. F., and de Vasconcelos, J. A. (2002). Multiobjective Genetic Algorithms Applied to Solve Optimization Problems. IEEE Trans. Magn. 38 (2), 1133–1136. doi:10.1109/20.996290
Fu, W.-S., Lai, Y.-C., and Li, C.-G. (2013). Estimation of Turbulent Natural Convection in Horizontal Parallel Plates by the Q Criterion. Int. Commun. Heat Mass Transf. 45, 41–46. doi:10.1016/j.icheatmasstransfer.2013.04.001
Ghorani, M. M., Sotoude Haghighi, M. H., and Riasi, A. (2020). Entropy Generation Minimization of a Pump Running in Reverse Mode Based on Surrogate Models and NSGA-II. Int. Commun. Heat Mass Transf. 118, 1–18. doi:10.1016/j.icheatmasstransfer.2020.104898
Goto, A., Nohmi, M., Sakurai, T., and Sogawa, Y. (2002). Hydrodynamic Design System for Pumps Based on 3-D CAD, CFD, and Inverse Design Method. J. Fluids Eng. 124 (2), 329–335. doi:10.1115/1.1471362
Horn, J., Nafpliotis, N., and Goldberg, D. E. (1994). A Niched Pareto Genetic Algorithm for Multiobjective Optimization. IEEE World Congr. Comput. Intell. 994, 82–87.
Hunt, V. D., and Wray, A. A. (1988). “Smart Robots,” in Eddies, Streams, and Convergence Zones in Turbulent Flows (Cambridge: Center for Tubulence Research), 193–232. doi:10.1007/978-1-4613-1063-1_7
Kim, J.-H., Lee, H.-C., Kim, J.-H., Choi, Y.-S., Yoon, J.-Y., Yoo, I.-S., et al. (2015). Improvement of Hydrodynamic Performance of a Multiphase Pump Using Design of Experiment Techniques. J. Fluids Eng. 137, 1–15. doi:10.1115/1.4029890
Lane, G. L., Schwarz, M. P., and Evans, G. M. (2005). Numerical Modelling of Gas-Liquid Flow in Stirred Tanks. Chem. Eng. Sci. 60 (8-9), 2203–2214. doi:10.1016/j.ces.2004.11.046
Li, Y., Yu, Z., Zhang, W., Yang, J., and Ye, Q. (2019). Analysis of Bubble Distribution in a Multiphase Rotodynamic Pump. Eng. Appl. Comput. Fluid Mech. 13 (1), 551–559. doi:10.1080/19942060.2019.1620859
Liu, X., Hu, Q., Shi, G., Zeng, Y., and Wang, H. (2017). Research on Transient Dynamic Characteristics of Three-Stage Axial-Flow Multi-phase Pumps Influenced by Gas Volume Fractions. Adv. Mech. Eng. 9 (12), 1–10. doi:10.1177/1687814017737669
McKay, M. D., Beckman, R. J., and Conover, W. J. (2000). A Comparison of Three Methods for Selecting Values of Input Variables in the Analysis of Output from a Computer Code. Technometrics 42 (1), 55–61. doi:10.1080/00401706.2000.10485979
Menter, F. R. (1994). Two-equation Eddy-Viscosity Turbulence Models for Engineering Applications. AIAA J. 32 (8), 1598–1605. doi:10.2514/3.12149
Minemura, K., and Murakami, M. (1980). A Theoretical Study on Air Bubble Motion in a Centrifugal Pump Impeller. J. Fluids Eng. 102 (4), 446–453. doi:10.1115/1.3240721
Monte Verde, W., Biazussi, J. L., Sassim, N. A., and Bannwart, A. C. (2017). Experimental Study of Gas-liquid Two-phase Flow Patterns within Centrifugal Pumps Impellers. Exp. Therm. Fluid Sci. 85, 37–51. doi:10.1016/j.expthermflusci.2017.02.019
Murakami, M., and Minemura, K. (1974). Effects of Entrained Air on the Performance of Centrifugal Pumps : 2nd Report, Effects of Number of Blades. Bull. JSME 17 (112), 1286–1295. doi:10.1299/jsme1958.17.1286
Myers, R., Montgomery, D., and Anderson-cook, C. A. (2009). Response Surface Methodology Process and Product Optimization Using Designed Experiments. John Wiley & Sons.
Myers, R. H., KhuriCarter, A. I. W. H., and Carter, W. H. (1989). Response Surface Methodology: 1966-l988. Technometrics 31 (2), 137–157. doi:10.1080/00401706.1989.10488509
Myers, R. H. (1999). Response Surface Methodology-Current Status and Future Directions. J. Qual. Technol. 31 (1), 30–44. doi:10.1080/00224065.1999.11979891
Nandasana, A. D., Ray, A. K., and Gupta, S. K. (2003). Applications of the Non-dominated Sorting Genetic Algorithm (NSGA) in Chemical Reaction Engineering. Int. J. Chem. React. Eng. 1, 1–14. doi:10.2202/1542-6580.1018
Parikh, T., Mansour, M., and Thévenin, D. (2020). Investigations on the Effect of Tip Clearance Gap and Inducer on the Transport of Air-Water Two-phase Flow by Centrifugal Pumps. Chem. Eng. Sci. 218, 1–21. doi:10.1016/j.ces.2020.115554
Peng, G., Cao, S., Ishizuka, M., and Hayama, S. (2002). Design Optimization of Axial Flow Hydraulic Turbine Runner: Part I?an Improved Q3D Inverse Method. Int. J. Numer. Meth. Fluids 39, 517–531. doi:10.1002//d.34210.1002/fld.342
Schaffer, J. D. (1985). “Multiple Objective Optimization with Vector Evaluated Genetic Algorithms,” in Proceedings of the 1st International Conference on Genetic Algorithms (Pittsburgh, PA, USA: DBLP), 93–100.
Shi, L., Zhu, J., Tang, F., and Wang, C. (2020). Multi-Disciplinary Optimization Design of Axial-Flow Pump Impellers Based on the Approximation Model. Energies 13 (4), 1–19. doi:10.3390/en13040779
Suh, J.-W., Kim, J.-H., Choi, Y.-S., Joo, W.-G., and Lee, K.-Y. (2017a). A Study on Numerical Optimization and Performance Verification of Multiphase Pump for Offshore Plant. Proc. Institution Mech. Eng. Part A J. Power Energy 231 (5), 382–397. doi:10.1177/0957650917702263
Suh, J.-W., Kim, J.-W., Choi, Y.-S., Kim, J.-H., Joo, W.-G., and Lee, K.-Y. (2018). Development of Numerical Eulerian-Eulerian Models for Simulating Multiphase Pumps. J. Petroleum Sci. Eng. 162, 588–601. doi:10.1016/j.petrol.2017.10.073
Suh, J.-W., Kim, J.-W., Choi, Y.-S., Kim, J.-H., Joo, W.-G., and Lee, K.-Y. (2017b). Multi-Objective Optimization of the Hydrodynamic Performance of the Second Stage of a Multi-phase Pump. Energies 10 (9), 1–21. doi:10.3390/en10091334
Tabib, M. V., and Schwarz, P. (2011). Quantifying Sub-grid Scale (SGS) Turbulent Dispersion Force and its Effect Using One-Equation SGS Large Eddy Simulation (LES) Model in a Gas-Liquid and a Liquid-Liquid System. Chem. Eng. Sci. 66 (14), 3071–3086. doi:10.1016/j.ces.2011.03.058
Wang, J., Zha, H., McDonough, J. M., and Zhang, D. (2015). Analysis and Numerical Simulation of a Novel Gas-Liquid Multiphase Scroll Pump. Int. J. Heat Mass Transf. 91, 27–36. doi:10.1016/j.ijheatmasstransfer.2015.07.086
Wu, C. (1952). A General Theory of Three-Dimensional Flow in Subsonic Turbomachines of Radial-, Axial-, and Mixed Flow Types. USA: NACA TN-D, 2604.
Xie, X., Li, Z., Zhu, B., Wang, H., and Zhang, W. (2021). Multi-objective Optimization Design of a Centrifugal Impeller by Positioning Splitters Using GMDH, NSGA-III and Entropy Weight-TOPSIS. J. Mech. Sci. Technol. 35 (5), 2021–2034. doi:10.1007/s12206-021-0419-1
Zangeneh, M. (1991). A Compressible Three-Dimensional Design Method for Radial and Mixed Flow Turbomachinery Blades. Int. J. Numer. Meth. Fluids 13 (5), 599–624. doi:10.1002/fld.1650130505
Zangeneh, M., Goto, A., and Harada, H. (1998). On the Design Criteria for Suppression of Secondary Flows in Centrifugal and Mixed Flow Impellers. J. Turbomach. 120 (4), 723–735. doi:10.1115/1.2841783
Zangeneh, M., Goto, A., and Harada, H. (2009). On the Role of Three-Dimensional Inverse Design Methods in Turbomachinery Shape Optimization. Proc. Institution Mech. Eng. Part C J. Mech. Eng. Sci. 213 (1), 27–42. doi:10.1243/0954406991522167
Zhang, J., Cai, S., Li, Y., and Zhou, X. (2017). Optimization Design of Multiphase Pump Impeller Based on Combined Genetic Algorithm and Boundary Vortex Flux Diagnosis. J. Hydrodynamics 29 (6), 1023–1034. doi:10.1016/S1001-6058(16)60816-8
Zhang, J., Li, Y., Cai, S., Zhu, H., and Zhang, Y. (2016a). Investigation of Gas–liquid Two-phase Flow in a Three-Stage Rotodynamic Multiphase Pump via Numerical Simulation and Visualization Experiment. Adv. Mech. Eng. 8 (4), 1–13. doi:10.1177/1687814016642669
Zhang, J., Cai, S., Li, Y., Zhu, H., and Zhang, Y. (2016b). Visualization Study of Gas–liquid Two-phase Flow Patterns inside a Three-Stage Rotodynamic Multiphase Pump. Exp. Therm. Fluid Sci. 70, 125–138. doi:10.1016/j.expthermflusci.2015.08.013
Zhang, J., Cai, S., Zhu, H., and Zhang, Y. (2015). Experimental Investigation of the Flow at the Entrance of a Rotodynamic Multiphase Pump by Visualization. J. Petroleum Sci. Eng. 126, 254–261. doi:10.1016/j.petrol.2014.12.017
Zhang, J., Zhu, H., Yang, C., Li, Y., and Wei, H. (2011). Multi-objective Shape Optimization of Helico-Axial Multiphase Pump Impeller Based on NSGA-II and ANN. Energy Convers. Manag. 52 (1), 538–546. doi:10.1016/j.enconman.2010.07.029
Zhang, W., Yu, Z., Li, Y., Yang, J., and Ye, Q. (2019). Numerical Analysis of Pressure Fluctuation in a Multiphase Rotodynamic Pump with Air–Water Two-phase Flow. Oil Gas Sci. Technol. - Rev. IFP Energies nouvelles 74 (18), 1–13. doi:10.2516/ogst/2018101
Zhao, X., Sun, C., and Wu, C. (1985). A Simple Method for Solving Three-Dimensional Inverse Problems of Turbomachine Flow and the Annular Constraint Condition. J. Eng. Gas turbines Power 107 (2), 293–300. doi:10.1115/1.3239714
Zhu, B., Wang, X., Tan, L., Zhou, D., Zhao, Y., and Cao, S. (2015). Optimization Design of a Reversible Pump–Turbine Runner with High Efficiency and Stability. Renew. Energy 81, 366–376. doi:10.1016/j.renene.2015.03.050
Zhu, J., and Zhang, H. (2017). Numerical Study on Electrical-Submersible-Pump Two-phase Performance and Bubble-Size Modeling. SPE Prod. Operations 32 (03), 267–278. doi:10.2118/170727-PA
b height at impeller inlet, mm
f blade wrap angle,°
Hd designed head, m
h maximum thickness location, dimensionless
Mk kinterphase force N/m3
nd designed rotating speed, r/min
Qd designed flow rate, m3/h
Q Q-criterion
S gas uniformity at impeller outlet, dimensionless
V velocity, m/s
αk void fraction of k phase, dimensionless
β blade incidence angle,°
σ gas uniformity index, dimensionless
η pump efficiency, dimensionless
θ high-pressure edge angle,°
k turbulent kinetic energy, m2/s2
ρ density, kg/m3
Keywords: multiphase pump, two-step multi-objective optimization, impeller blade loading, transportability improvement, internal flow analysis
Citation: Zhang W, Zhu B, Zi D, Ma Z and Wang F (2022) Transportability Improvement of a Gas–Liquid Rotodynamic Pump Using the Two-Step Multi-Objective Optimization Strategy. Front. Energy Res. 10:900182. doi: 10.3389/fenrg.2022.900182
Received: 20 March 2022; Accepted: 19 April 2022;
Published: 08 June 2022.
Edited by:
Enhua Wang, Beijing Institute of Technology, ChinaReviewed by:
Ling Zhou, Jiangsu University, ChinaCopyright © 2022 Zhang, Zhu, Zi, Ma and Wang. This is an open-access article distributed under the terms of the Creative Commons Attribution License (CC BY). The use, distribution or reproduction in other forums is permitted, provided the original author(s) and the copyright owner(s) are credited and that the original publication in this journal is cited, in accordance with accepted academic practice. No use, distribution or reproduction is permitted which does not comply with these terms.
*Correspondence: Dan Zi, ZHppQGNhdS5lZHUuY24=
Disclaimer: All claims expressed in this article are solely those of the authors and do not necessarily represent those of their affiliated organizations, or those of the publisher, the editors and the reviewers. Any product that may be evaluated in this article or claim that may be made by its manufacturer is not guaranteed or endorsed by the publisher.
Research integrity at Frontiers
Learn more about the work of our research integrity team to safeguard the quality of each article we publish.