 Darrian M. Newman1†
 Cara L. Sake1†
 Alexander J. Metcalf1Fiona K. Davies2Melissa Cano3Anagha Krishnan3
 Nanette R. Boyle1*
- 1Department of Chemical and Biological Engineering, Colorado School of Mines, Golden, CO, United States
- 2Living Ink Technologies, Berthoud, CO, United States
- 3Department of Chemistry and Geochemistry, Colorado School of Mines, Golden, CO, United States
Synechococcus sp. PCC 7002 is a unicellular cyanobacterium capable of fast growth and tolerance to high light intensity and high salinity. These attributes along with genetic tractability make Synechococcus sp. PCC 7002 an attractive candidate for industrial scale production of specialty and commodity chemicals. Synechococcus sp. PCC 7002 LS (Davies et al., Front Bioeng Biotechnol, 2014, 2, 21–11) produces limonene, an energy dense diesel jet fuel drop-in additive, at a titer of 4 mg/L over a 4-day incubation period. In this study, we use the state-of-the-art whole-cell characterization tool, isotopically non-stationary 13C metabolic flux analysis (INST-13CMFA) to determine intracellular fluxes through the pathways of central metabolism for the limonene producing strain and wild type strain of Synechococcus sp. PCC 7002. We find similar flux distribution in the Calvin-Benson-Bassham cycle, photorespiration, oxidative pentose phosphate pathway, and oxidative tricarboxylic acid cycle. The key difference between strains is observed in the production of pyruvate. The limonene producing strain displays significantly higher flux through the amphibolic pathways of phosphoenolpyruvate carboxylase and the malic enzyme to synthesize pyruvate, while the wild type strain uses pyruvate kinase in a single step. Our findings suggest that this flux distribution is a mechanism to recover a physiologically optimal ratio of ATP to NADPH. The upregulation of this amphibolic pathway may act to restore the physiological ATP:NADPH ratio that has been disturbed by limonene biosynthesis. This study demonstrates the value of INST-13CMFA as a tool for cyanobacterial strain engineering and provides new avenues of research for improving limonene production in Synechococcus.
Introduction
Amid growing concerns over climate change and increasing anthropogenic carbon emissions, cyanobacteria have emerged as a promising platform for the sustainable production of a wide range of specialty and commodity chemicals. Cyanobacteria utilize the Calvin-Benson-Bassham cycle (CBB) to fix atmospheric carbon dioxide into biomass, metabolites, and important industrially relevant chemicals and fuels using only light and trace minerals as additional inputs. Cyanobacterial cell factories are naturally capable of producing a wide variety of products: sugars, alcohols, acids, alkanes, alkenes, ketones, fatty acids, and terpenoids (Khan et al., 2019). The efficacy of sustainable chemical production by cyanobacteria is strengthened by their genetic tractability as well as higher photosynthetic efficiency and growth rates compared to land plants (Ducat et al., 2011; Berla et al., 2013). Synechococcus sp. PCC 7002 (hereafter Synechococcus 7002) is an attractive candidate for production of sustainable industrially relevant chemicals to displace petrochemicals due to a short doubling time of only 2.6 h when provided reduced nitrogen (Ludwig and Bryant, 2012). Synechococcus 7002 can also tolerate high salinity and light intensity (Batterton and Baalen, 1971; Nomura et al., 2006).
Two strains are studied here, the wild type (WT) Synechococcus 7002 strain and a limonene producing (LS) strain, engineered by Davies et al. (Davies et al., 2014). The Synechococcus 7002 LS strain produces 4 mg L−1 of the terpenoid limonene over a 96 h growth period (Davies et al., 2014). Briefly, l-limonene is synthesized in cyanobacterial cells via the methylerythritol 4-phosphate (MEP) pathway, a linear seven-step pathway beginning with the condensation of glyceraldehyde 3-phosphate (GAP) and pyruvate (PYR) and ending with the production of either isopentenyl diphosphate (IPP) or dimethylallyl diphosphate (DMAPP), which condense to form limonene with the expression of a heterologous enzyme (limonene synthase). Limonene is an energy dense molecule, which is why it is an attractive candidate as a drop-in biodiesel jet fuel additive. Few studies have been conducted to understand the energetic burden on cyanobacterial metabolism when producing such energy dense molecules as limonene. Many attempts, however, have been made to increase flux through the MEP pathway toward terpenoids such as limonene through the overexpression of bottlenecks (Gao et al., 2016; Englund et al., 2018) and by alleviating competition for carbon with sinks such as glycogen (Davies et al., 2014; Hendry et al., 2017). However, titers of terpenoid products including limonene by Synechococcus 7002 LS remain infeasible for economical industrial production of biofuel molecules.
The allocation of carbon through cyanobacterial metabolism and consequences of the additional energetic burden imposed by manufacture of terpenes must be understood if we are to significantly further increase production of terpenoids. Isotopically nonstationary 13C metabolic flux analysis (INST-13CMFA) is a state-of-the-art tool that we utilized to investigate these unknowns. INST-13CMFA uses isotopically labeled carbon to produce time-dependent mass isotopomer distributions (MIDs) of key metabolites in central metabolism, from which flux values can be estimated for a network of reactions by iteratively solving and adjusting parameters between simulated and experimental 13C labeling profiles. INST- 13CMFA has been utilized to elucidate metabolic phenotypes in Synechococcus 7002 (Hendry et al., 2017; Qian et al., 2018; Abernathy et al., 2019), Synechocystis sp. PCC 6803 (You et al., 2014; Adebiyi et al., 2015; Nakajima et al., 2017; Yu et al., 2019), and Synechococcus elongatus PCC 7942 (or the closely related species UTEX 2973) (Abernathy et al., 2017; Jazmin et al., 2017; Cheah et al., 2020). In this study, we use INST-13CMFA to characterize the central metabolism of the Synechococcus 7002 WT and LS strains to glean information about phenotypic differences induced by the production of limonene. We find significant carbon redistribution in central carbon metabolism between the two strains. This redistribution of carbon flux appears to be induced not by the need for carbon reallocation, but for recovering the physiologically optimal ratio of ATP to NADPH needed for biomass accumulation.
Methods
Strains and Cultivation Conditions
Synechococcus 7002 cultures were obtained from the American Type Culture Collection and the limonene producing strain (LS) was provided by Dr. Davies (Davies et al., 2014). Synechococcus 7002 cultures were grown in BG11 medium supplemented with 8.26 mM Trizma base (chemicals supplied by Sigma-Aldrich, unless otherwise noted) titrated to a pH of 8.2 and maintained on solid BG11 medium plates containing 1.5% (w/v) agar (Difco). A final concentration of 50 μg/ml spectinomycin was added to cultures of the limonene producing strain. Liquid cultures were propagated and grown in 250 and 500 ml beveled Erlenmeyer flasks with 100 and 200 ml of medium, respectively. Flasks were shaken at 180 rpm in an INFORS HT Minitron shake plate incubator at ambient CO2 conditions (<0.1%) and 37°C. The approximate light intensity was 80 μmol photons m−2 s−1 in continuous illumination by white fluorescent bulbs. Cell growth was monitored using spectrophotometric optical density (OD750).
Dynamic Labeling and Quenching Experiment
The labeling experiment was performed on a benchtop flask shaker under 20 μmol photons m−2 s−1 light from white fluorescent lights. The cultures were first grown to mid-exponential phase (OD750∼0.8) at the conditions previously described. Before the addition of the label, 15 ml of culture was pipetted out and immediately quenched in 30 ml of partially frozen saline quench solution in a 50 ml conical centrifuge tube, as described in Sake et al. (Sake et al., 2020). This sample corresponded to the zero timepoint sample (t = 0). Then a 5 ml bolus of 0.8 M13C sodium bicarbonate (98 atom % 13C, 99% purity, Sigma-Aldrich, United States) was injected into the flask at time t = 0. Fifteen ml samples were rapidly quenched at 20 s, 40 s, 1, 2, 4, 6, 10, 15, 20, 40, and 60 min.
The quenched samples were centrifuged in an Eppendorf 5810R swinging bucket centrifuge at 4,000 rpm for 15 min at −2°C, and the supernatant was decanted. The pellet was washed in 2 ml chilled quenching solution, transferred to a 2 ml microcentrifuge tube, and centrifuged again at 8,000×g on a tabletop centrifuge at −2°C. The pellet was stored at −20°C for later extraction. It is important to note that this experiment was performed without the addition of a dodecane overlay in the case of both the WT and LS strains, due to the need to sample throughout the 60-min experiment. Oxygen evolution is used to verify that photosystem II is not negatively affected by limonene in the absence of a dodecane overlay to extract the molecule from the growth media (Supplementary Figure S4). Other conditions were changed relative to the experiments performed in Davies et al. (Davies et al., 2014), such as light intensity, CO2 availability, and media composition, all controlled for by the WT condition.
Metabolite Extraction
Intracellular metabolites were extracted from the frozen cell pellets using a methanol extraction (Sake et al., 2020). Cell pellets were resuspended in 500 μl pure methanol and spiked with ribitol and PIPES internal standards for final concentrations of 150 and 50 ppb, respectively. Samples were frozen in liquid nitrogen, thawed on ice, and vortexed at 0°C for 5 min and 1,000 rpm. This freeze/thaw/vortex cycle was repeated twice more, and samples were centrifuged at 8,000 × g for 5 min at −9°C in a Sorvall Legend Micro 17R (Thermo Scientific). The supernatant (extract) was collected in a new tube and stored at −20°C. The extraction process was repeated twice more with 500 μl of 50% methanol, each time adding the collected extract to the first portion. All samples were then dried overnight under vacuum at 45°C in a Savant SPD131DDA SpeedVac (Thermo Scientific). Dried extracts were resuspended in 150 μl optima water and filtered with nylon filter tubes (Spin-X, Costar). Filters were rinsed with an additional 50 μl optima water for a total concentrated extract volume of 200 μl. Finally, the samples were filtered through a 3 kDa filter (Spin Filter 3K, VWR) and collected for LC-MS/MS analysis.
LC/MS-MS Quantitation of Metabolites
Metabolite extracts were analyzed using an LC-MS/MS method adapted from Young et al. (2011). Analysis was performed using a Phenomenex 150 mm × 2 mm Synergi Hydro-RP column connected to a Shimadzu HPLC system and coupled to a hybrid quadrupole-TOF MS/MS system (5,600 Triple TOF, AB Sciex Instruments). LC was performed with an injection volume of 10 μl, using gradient elution of 10 mM tributylamine and 15 mM acetic acid (aqueous phase) with methanol (organic phase) at a constant flow rate of 0.3 ml/min. The gradient profile of the organic phase is as follows: 0% B (0 min), 8% B (10 min), 16% B (15 min), 30% B (21 min), 95% B (23 min), 95% B (28 min), 0% B (30 min), and 0% B (35 min).
Data acquisition was performed on the Sciex Analyst 1.7 software. Metabolite pool sizes were quantified using Sciex MultiQuant 3.0.3 software. MSConvert was used to process data files into an open-source format, and isotope labeling profiles were processed using a combination of pyOpenMS and SciPy packages in Python.
Isotopically Non-Stationary 13C Metabolic Flux Analysis
We used a previously published model of the central metabolic network of Synechococcus 7002 (Adebiyi et al., 2015; Abernathy et al., 2017; Hendry et al., 2017; Abernathy et al., 2019). Models for the wild type and LS strains were constrained to match the composition reported by Abernathy et al. for Synechococcus 7002 in photoautotrophic conditions (Abernathy et al., 2019). We assumed the biomass formation equation to remain constant between strains, given the low limonene titers (4 mg/L) found by Davies et al. (Davies et al., 2014). We constrained each network to the biomass accumulation rate calculated during the growth phase of the experiment (Supplementary Figure S2).
The flux network and atom transitions for this study were taken from previous studies on Synechococcus 7002 and closely related strains (Adebiyi et al., 2015; Abernathy et al., 2017; Hendry et al., 2017; Abernathy et al., 2019), including the Calvin-Benson- Bassham cycle, photorespiration pathway, oxidative pentose phosphate pathway, tricarboxylic acid (TCA) cycle, and amphibolic reactions. The full metabolic network and atom transitions can be found in Supplementary Table S3. The MEP condensed pathway to limonene was constructed based on gene annotations from the KEGG database (Kanehisa and Goto, 2000; Kanehisa et al., 2014). We used a lumped biomass equation based on biomass composition analysis in Synechococcus 7002 (Abernathy et al., 2019). The MATLAB-based INCA toolbox (Young, 2014) was used to construct the network, and INST-13CMFA computations were run to calculate reaction fluxes and metabolite pool sizes by minimizing the difference between simulated and measured mass isotopomer distributions provided to the model. Data used to produce MID figures in Supplementary Figure S1 are tabulated in Supplementary Tables S1, S2. The parameter continuation method provided by INCA estimated 95% confidence intervals around each estimated parameter. Dilution parameters were applied to metabolites as needed to account for labeling dilutions from metabolically inactive pools (Young et al., 2011) (Supplementary Tables S3, S4).
Cryogenic Fluorometry for Quantification of Intracellular NAD(P)H Concentrations
Intracellular NAD(P)H concentrations were measured fluorometrically using an adapted protocol from Wang et al., 2016 (Wang et al., 2016) with the addition of a liquid nitrogen quenching step. Cells were grown at the conditions previously described, and 0.75 ml of cell culture were quenched in 0.25 ml frozen methanol in a liquid nitrogen bath under 80 μmol photons m−2 s−1 using a P1500 overhead full spectrum LED lighting system (Viparspectra). Quenched samples were maintained below 0 °C until measured in a Horiba Jobin Yvon NanoLog spectrofluorometer at an excitation wavelength of 340 nm, with emissions recorded at 460 nm, and normalized to cell density (OD750).
Oxygen Evolution
In vivo O2-photoproduction rates were determined using a custom-built Pt-Ag/AgCl polarographic electrode system (ALGI, United States) as described previously (Weissman et al., 2018). 1.5 ml of cell culture diluted at a concentration of 1 μg ml−1 of total chlorophyll was purged with 99% He/1% CO2 followed by the addition of 6 μL 1 M potassium bicarbonate to avoid any CO2 limitation during the assay. 1 ml of the sample was then rapidly injected into the glass sample cell and sealed. For determination of O2-evolution, an 80 μmol photons m−2 s−1 light intensity (Luxeon III Star, Lumileds, United States) was applied for 10 min after an initial 5 min dark period. Net O2-production rates were measured by the slope of the linear fit of the illumination periods. The temperature was maintained at 37°C throughout the experiment. Electrodes were calibrated before each measurement using atmospherically equilibrated growth medium and deoxygenated medium.
Results and Discussion
Differential 13C Enrichment
Isotopic labeling was measured in 11 key metabolites (Figure 1), and time dependent mass isotopomer distributions show the dynamics of metabolite labeling (Supplementary Figure S1). To account for low enrichment, dilution pools were provided to the model for 3PG, Ru5P, PEP, GAP, and DHAP (Supplementary Table S3). Dilution pools represent mechanisms in the cell that prevent certain metabolite pools from reaching expected enrichment, due to phenomena like metabolite channeling that cause intermediates to proceed through multiple reactions without mixing with entire metabolite pool (Ishikawa et al., 2004; Broddrick et al., 2016; Abernathy et al., 2019).
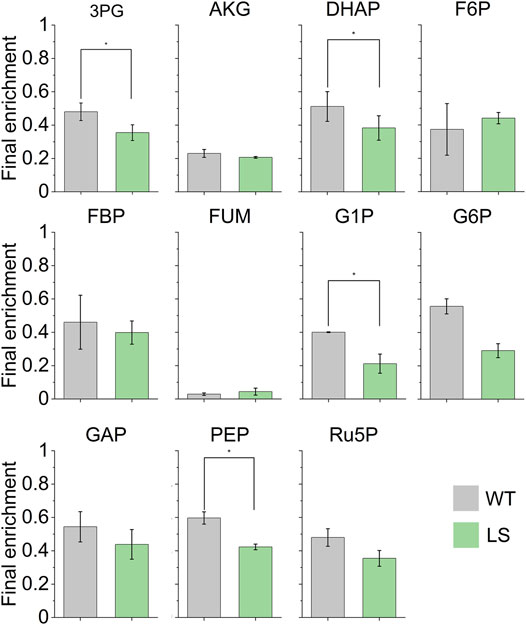
FIGURE 1. Final 13C enrichment of the 11 metabolites used to inform the flux distributions through the Synechococcus 7002 central metabolic network. Final enrichment values correspond to MID data at the 60 min timepoint (Supplementary Figure S1). Error bars represent standard error (n = 3). A paired two-tail Student’s t-test was performed and metabolites with a statistically significant difference (p < 0.05) are indicated with ∗ (Supplementary Table S5).
We noticed interesting behavior in the PEP node. The final enrichment (Figure 1) shows a lower overall enrichment of the PEP metabolite pool in the LS strain compared to the WT strain. In the WT strain we measured the steady state PEP enrichment of nearly 60%, which is significantly different from the LS enrichment of 42% (p = 0.023). This difference necessitated the use of a dilution pool for the LS PEP pool in the INCA model to account for the low labeling and was required for this model’s SSR to fall within the accepted error range.
Flux Measurements for the Wild Type and Limonene Producing Strain
The WT flux map was solved by the INCA package in MATLAB to an acceptable sum of squared residuals (SSR) of 482.1, within the range of 472.8–601.0. Likewise, the LS flux map was solved to an acceptable SSR of 538.4 within the range of 435.2–558.5. The resulting flux maps were assigned 95% confidence intervals for each network reaction (Supplementary Table S4). The general distribution of flux throughout central metabolism concurs with previous INST-13CMFA studies on Synechococcus 7002 and similar cyanobacterial strains (Adebiyi et al., 2015; Abernathy et al., 2017; Hendry et al., 2017; Abernathy et al., 2019), with a large proportion of flux directed through the CBB cycle for carbon fixation, relatively low flux through the TCA cycle, and carbon allocation toward glycogen for storage (Figure 2).
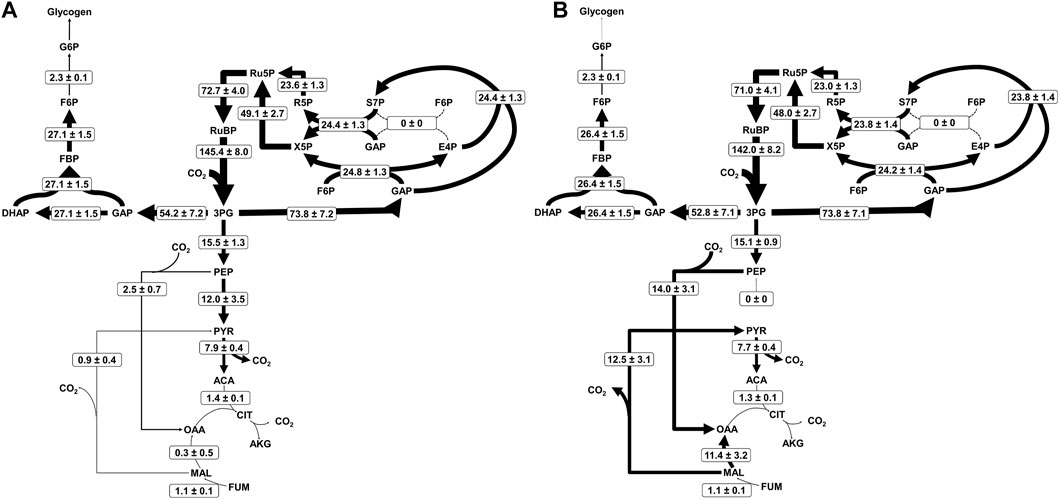
FIGURE 2. Metabolic flux maps for Synechococcus 7002 (A) WT and (B) LS. Net fluxes are shown in the form M ± SE where M is the calculated flux and SE is the standard error of the 95% confidence interval, calculated using upper and lower flux bounds from parameter continuation analysis. Arrow thickness is proportional to the logarithm of the flux through the given reaction, and dotted lines indicate no significant flux. Flux values for every reaction in the network, upper and lower bounds of their respective 95% confidence intervals, and dilution parameters are listed in Supplementary Table S4.
Our model allowed for an active photorespiration pathway, but the flux was determined to be negligible. This is likely due to the high bicarbonate concentration accumulated inside the cells after a bolus of 13C bicarbonate was added at the start of the labeling experiment. Cyanobacteria are able to rapidly transport available bicarbonate into the cell (Colman, 1989), validating both the suppression of photorespiration as well as the establishment of an intracellular dissolved inorganic carbon pool dominated by 13C. Both 13C and 12C CO2 pools were made available to the model for transport in simulations, but only the 13C pool was utilized by the network (Supplementary Table S2).
Metabolic Flux Analysis Reveals Increased Flux Through Phosphoenolpyruvate Carboxylase
The solved flux maps describe differing usage of the two separate pyruvate synthesis pathways. The one-step pathway from PEP to PYR proceeds through pyruvate kinase (PK), reacting ADP and PEP together to form ATP and PYR. Alternatively, phosphoenolpyruvate carboxylase (PEPc), malate dehydrogenase (MDH), and the malic enzyme (ME) synthesize PYR from PEP in an amphibolic loop by first reacting PEP and CO2 to OAA at the expense of an ATP, then reducing OAA to MAL at the expense of the oxidation of NADH to NAD+, before decarboxylating and oxidizing MAL to PYR while reducing NADP+ to NADPH (Figure 3). The three-step pathway forms part of the reductive TCA cycle. In the bifurcated structure of the cyanobacterial TCA cycle, the reductive portion supports higher flux than the oxidative portion, which is suppressed in light conditions (Zhang and Bryant, 2011; Xiong et al., 2017); this is typically paired with low flux through TCA intermediates like CIT and AKG and more flux for supplying OAA and MAL directly from PEP (Iijima et al., 2021), which is additionally supplemented by FUM through purine synthesis (Knoop et al., 2010). As expected, we see low fluxes in Figure 2 for the oxidative TCA cycle, driven by the production of biomass precursors (i.e., AKG).
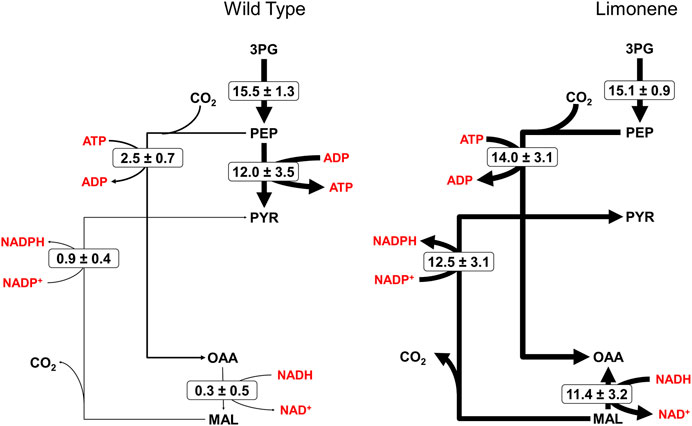
FIGURE 3. Fluxes of pyruvate synthesis from phosphoenolpyruvate. The flux distribution between the one-step, pyruvate kinase mediated reaction from PEP to PYR versus the three-step amphibolic pathway, involving phosphoenolpyruvate carboxylase, malate dehydrogenase, and the malic enzyme differ significantly between WT and LS strains. Energy molecule cofactors aiding in each reaction are depicted in red. Thickness of the black arrows is proportional to relative flux values, provided in the form M ± SE where M is the calculated flux and SE is the standard error of the 95% confidence interval.
The flux maps reveal significant differences in the reductive TCA cycle between the WT and LS strains. In the WT strain, PEPc fixes 2.5±0.7 μmol/gDW/hr CO2 into oxaloacetate, of which only 0.9 ± 0.4 μmol/gDW/hr is cycled through the malic enzyme, resulting in minimal production of PYR from PEP compared to the PK route. The limonene strain fixes 14.0±3.1 μmol/gDW/hr of CO2 by PEPc activity, ultimately sending higher flux through the malic enzyme as well, measuring 12.5 ± 3.1 μmol/gDW/hr. This significant difference in flux distribution is the direct result of differential labeling at the PEP node, which can likely be attributed to metabolite channeling. Labeling suggests that the PEP pool is more homogenous in the WT strain, where PYR production is dominated by the PK route. Alternatively, metabolite channeling through PEPc and neighboring enzymes in the amphibolic loop prevents PEP directed toward MAL from mixing homogenously within the cell. INST-13CMFA has previously been used to identify subcellular organization and provide evidence of metabolite channeling on metabolite labeling patterns in Synechococcus 7002 (Abernathy et al., 2019). The traditional view of prokaryotic cyanobacteria as spatially unorganized with no subcellular compartmentalization has been challenged by other studies as well (Ishikawa et al., 2004; Broddrick et al., 2016).
Global Regulation of the ATP:NADPH Balance May Be Responsible for Flux Redistribution
Limonene is an energy dense molecule, with a molecular formula of C10H16, that includes two double bonds. To biosynthesize 1 mol of limonene through the native cyanobacterial MEP pathway, 36 mol of ATP and 28 mol of NADPH are consumed, a 1.29:1 ATP:NADPH ratio. The CBB cycle demands nine ATP and six NADPH to fix three CO2 molecules (Sun et al., 2018), resulting in one 3PG. 3PG is converted into GAP and PYR, producing one ATP in the process, assuming the pyruvate kinase enzyme catalyzes the reaction. The MEP pathway consumes two NADPH and one ATP to produce the precursors to limonene, IPP and DMAPP, two of which are condensed together to synthesize one limonene molecule (Pattanaik and Lindberg, 2015). This ratio of consumption is almost exactly the ratio in which ATP and NADPH are produced from linear electron flow in photosynthetic systems, a 9:7 ratio of ATP:NADPH (Alric et al., 2010; Kramer and Evans, 2011). However, it is estimated that the optimal ATP:NADPH ratio for biomass accumulation in cyanobacteria is greater than 1.5:1 (Alric et al., 2010; Erdrich et al., 2014; Hendry et al., 2016). Alternative electron flows account for the additional production of energy molecules and are tightly regulated (Trost and Lemaire, 2013; Wilde and Hihara, 2016).
Limonene synthesis requires a higher input of NADPH compared to ATP, relative to the optimal ratio required for biomass accumulation. We hypothesize that even at small titers (4 mg L−1) this disruption of the relative abundance of ATP to NADPH triggers a global regulatory response aimed at recovering the optimal ratio. While PYR synthesis by PK produces an ATP, expending an ATP by rerouting carbon down PEPc results in the production of NADPH, at the additional cost of a molecule of NADH as well, from the reduction of OAA to MAL. This exchange of ATP and NADH for NADPH counteracts the relatively high NADPH consumption needed for limonene synthesis. Utilization of this amphibolic pathway adjusts the ATP:NADPH ratio needed for limonene synthesis from 1.29:1 (36 ATP and 28 NADPH) to 1.54:1 (40 ATP and 26 NADPH), a value which is closer to the optimal ratio. Although regulation of cyanobacterial NADPH homeostasis is generally poorly understood (Ishikawa and Kawai-Yamada, 2019), the malic enzyme route is known in bacteria and archaea as an NADPH generating reaction (Singh et al., 2008; Negi et al., 2015; Spaans et al., 2015).
To test for the generation of redox molecules, we measured intracellular NAD(P)H concentrations using a protocol adapted from Wang et al. (Wang et al., 2016), with the addition of a liquid nitrogen quenching step. Both WT and LS strains were tested at the same OD750 at which the labeling experiment was performed. We found no significant differences between the strains (Supplementary Figure S3), with a WT NAD(P)H concentration of 12.88 ± 1.80 μmol L−1 OD750−1, compared to LS values of 14.00 ± 1.31 μmol L−1 OD750−1 (p > 0.05). This, along with the flux redistribution, suggests that cells are utilizing NADH pools to supplement the redox state of NADPH but not gaining or losing significant amounts of redox potential overall. Limonene is being produced at a rate of 0.02 μmol/gDW/hr. Normalized to the values in the flux map, this translates to an ATP consumption of 0.80 μmol/gDW/hr and an NADPH consumption of 0.52 μmol/gDW/hr, assuming all limonene is produced through the malic enzyme route. This value agrees with the overall NAD(P)H consumption observed in the network, in which 245.5 ± 8.6 μmol/gDW/hr and 243.1 ± 13.9 μmol/gDW/hr are consumed by the WT and LS strains, respectively. The change in NADPH production through the malic enzyme route to pyruvate is much higher than the NADPH needs of limonene synthesis, so it is reasonable to assume that there are also differences in fluxes through transhydrogenases to control the redox state of the cell.
Interestingly, other studies conducted on terpenoid production strains observe that the introduction of a terpenoid based carbon sink does not increase photosynthetic efficiency (Wang et al., 2016). This contrasts findings in which sucrose production in cyanobacteria is accompanied by increases in photosynthetic efficiency and increased biomass accumulation rates (Abramson et al., 2016; Abramson et al., 2018; Lin et al., 2020). We hypothesize that the increase in photosynthetic efficiency in response to the addition of a sucrose carbon sink can be attributed to the fact that sucrose production does not affect intracellular ATP:NADPH equilibrium (Thiel et al., 2019). Production of molecules like ethanol, isobutanol, lactate, isoprene, and many others require a much lower ATP:NADPH ratio for biosynthesis than the optimal cellular ratio for biomass accumulation, similar to limonene. We find a slight increase in oxygen evolution, but decreases in biomass accumulation rates in the LS strain compared to the WT strain (Supplementary Figures S2, S4, respectively).
Our findings suggest that limonene is indeed causing a cellular imbalance of ATP:NADPH, and physiological changes are occurring in central metabolism in order to correct this imbalance. We observe the conversion of PEP to PYR as an important control mechanism to tune the ATP:NADPH ratio back to the physiologically optimal value, allowing the LS strain to recover biomass accumulation rates similar to the WT strain. We show that the effects of genetic modifications to the MEP pathway are not confined there, but drive flux redistribution in central metabolic pathways, such as PK, PEPc and the malic enzyme. We hypothesize that ATP:NADPH affects the PK enzyme directly through the abundance of ATP, a known PK inhibitor (Knowles et al., 2001), and indirectly by CP12, a regulatory protein that is sensitive to the redox state of the cell, downregulating portions of the CBB cycle in response to low NADPH levels (Tamoi et al., 2005). PK is allosterically activated by hexose monophosphates and ribose 5-phosphate, both of which would be downregulated in low NADPH conditions. More research is needed to elucidate the regulatory mechanisms controlling the two pathways for PYR conversion from PEP.
Along with PK regulation, this study also provides a direction for future study to investigate the effects of pyruvate synthesis on biofuel production strains. Optimizing the distribution of flux from the PEP node through overexpression or suppression of PEPc and PK could increase limonene titers and lead to increased photosynthetic efficiency through optimization of the ATP:NADPH ratio. Alternatively, co-expression of enzymes for products that require a relatively high ATP:NADPH ratio could offset the disturbance caused by limonene production. Future analyses focused on energy molecule balancing would benefit from fluorometric or assay-based tracking of molecules such as ATP, NADPH, and NADH in vivo, given that they could effectively control for the fast turnover rate of these metabolite pools.
INST-13CMFA has the unique ability to identify bottlenecks and inefficiencies in metabolic networks (Sake et al., 2019) and visualize changes to metabolism at a whole-cell level. This technique has already been used in cyanobacteria to distinguish phenotypes of related strains (Abernathy et al., 2017), quantify flux redistributions in knockout strains (Hendry et al., 2017), and quantify the effects of subcellular compartmentalization (Abernathy et al., 2019). Moving forward, INST-13CMFA will serve as a valuable tool to unravel cyanobacterial metabolism and understand the mechanisms behind carbon partitioning (Shabestary et al., 2018; Li et al., 2022), enhanced photosynthesis (Shinde et al., 2022), and regulator engineering (Cui et al., 2021), all of which are vital to the production of economically viable cyanobacterial production strains.
Conclusion
To characterize the phenotype of a limonene producing strain of Synechococcus 7002, INST-13CMFA was performed on the LS strain, and compared against the results of the WT strain. Results depicted similar flux distribution in the CBB cycle, oxidative pentose phosphate pathway, and the oxidative TCA cycle, however flux maps revealed differential flux through pyruvate biosynthesis pathways. The LS strain redirects carbon flux from PEP to the reductive TCA cycle rather than directly to pyruvate. This redistribution appears to be due to disturbance of the physiologically optimal ATP:NADPH ratio caused by limonene synthesis: the estimated ATP:NADPH ratio is closer to the physiological optimal value when synthesized via the amphibolic loop rather than directly through pyruvate kinase. Additionally, we find evidence of metabolite channeling in Synechococcus 7002 in the amphibolic loop involving PEP carboxylase, malate dehydrogenase, and the malic enzyme. This study provides a new avenue for increasing titers of terpenoid products in the amphibolic reactions by proposing ATP:NADPH ratios as an important consideration for limonene production and characterizes a cellular mechanism for recovery of the optimal ratio in response to the production of limonene. We also highlight the advantages of INST-13CMFA as an essential analytical tool for characterizing and understanding cyanobacterial phenotypes from a central metabolic perspective.
Data Availability Statement
The original contributions presented in the study are included in the article/Supplementary Material, further inquiries can be directed to the corresponding author.
Author Contributions
DN and CS performed experiments and collected data. DN, CS and AM analyzed data and created figures. DN and CS wrote the first draft of the manuscript. FD and NB contributed to the conception and design of the study. All authors contributed to manuscript revision, read, and approved the submitted version.
Funding
The research presented here was funded by the a grant from the National Science Foundation (#1604691). Open access fee was supported by a Open Access Mini Grant provided by the Colorado School of Mines. This work was supported by NSF grant # 1604691.
Conflict of Interest
The authors declare that the research was conducted in the absence of any commercial or financial relationships that could be construed as a potential conflict of interest.
Publisher’s Note
All claims expressed in this article are solely those of the authors and do not necessarily represent those of their affiliated organizations, or those of the publisher, the editors and the reviewers. Any product that may be evaluated in this article, or claim that may be made by its manufacturer, is not guaranteed or endorsed by the publisher.
Acknowledgments
We would like to thank Amy Zheng, Doug Allen, and Yinjie Tang for their helpful advice and discussions.
Supplementary Material
The Supplementary Material for this article can be found online at: https://www.frontiersin.org/articles/10.3389/fenrg.2022.896668/full#supplementary-material
References
Abernathy, M. H., Yu, J., Ma, F., Liberton, M., Ungerer, J., Hollinshead, W. D., et al. (2017). Deciphering Cyanobacterial Phenotypes for Fast Photoautotrophic Growth via Isotopically Nonstationary Metabolic Flux Analysis. Biotechnol. Biofuels 10, 273–286. doi:10.1186/s13068-017-0958-y
Abernathy, M. H., Czajka, J. J., Allen, D. K., Hill, N. C., Cameron, J. C., and Tang, Y. J. (2019). Cyanobacterial Carboxysome Mutant Analysis Reveals the Influence of Enzyme Compartmentalization on Cellular Metabolism and Metabolic Network Rigidity. Metab. Eng. 54, 222–231. doi:10.1016/j.ymben.2019.04.010
Abramson, B. W., Kachel, B., Kramer, D. M., and Ducat, D. C. (2016). Increased Photochemical Efficiency in Cyanobacteria via an Engineered Sucrose Sink. Plant Cell Physiol. 57, 2451–2460. doi:10.1093/pcp/pcw169
Abramson, B. W., Lensmire, J., Lin, Y.-T., Jennings, E., and Ducat, D. C. (2018). Redirecting Carbon to Bioproduction via a Growth Arrest Switch in a Sucrose-Secreting Cyanobacterium. Algal Res. 33, 248–255. doi:10.1016/j.algal.2018.05.013
Adebiyi, A. O., Jazmin, L. J., and Young, J. D. (2015). 13C Flux Analysis of Cyanobacterial Metabolism. Photosynth Res. 126, 19–32. doi:10.1007/s11120-014-0045-1
Alric, J., Lavergne, J., and Rappaport, F. (2010). Redox and ATP Control of Photosynthetic Cyclic Electron Flow in Chlamydomonas Reinhardtii (I) Aerobic Conditions. Biochimica Biophysica Acta (BBA) - Bioenergetics 1797, 44–51. doi:10.1016/j.bbabio.2009.07.009
Batterton, J. C., and Baalen, C. (1971). Growth Responses of Blue-Green Algae to Sodium Chloride Concentration. Arch. Mikrobiol. 76, 151–165. doi:10.1007/bf00411789
Berla, B. M., Saha, R., Immethun, C. M., Maranas, C. D., Moon, T. S., and Pakrasi, H. B. (2013). Synthetic Biology of Cyanobacteria: Unique Challenges and Opportunities. Front. Microbiol. 4, 246. doi:10.3389/fmicb.2013.00246
Broddrick, J. T., Rubin, B. E., Welkie, D. G., Du, N., Mih, N., Diamond, S., et al. (2016). Unique Attributes of Cyanobacterial Metabolism Revealed by Improved Genome-Scale Metabolic Modeling and Essential Gene Analysis. Proc. Natl. Acad. Sci. U. S. A. 113, E8344–E8353. doi:10.1073/pnas.1613446113
Cheah, Y. E., Xu, Y., Sacco, S. A., Babele, P. K., Zheng, A. O., Johnson, C. H., et al. (2020). Systematic Identification and Elimination of Flux Bottlenecks in the Aldehyde Production Pathway of Synechococcus Elongatus PCC 7942. Metab. Eng. 60, 56–65. doi:10.1016/j.ymben.2020.03.007
Colman, B. (1989). Photosynthetic Carbon Assimilation and the Suppression of Photorespiration in the Cyanobacteria. Aquat. Bot. 34, 211–231. doi:10.1016/0304-3770(89)90057-0
Cui, J., Xie, Y., Sun, T., Chen, L., and Zhang, W. (2021). Deciphering and Engineering Photosynthetic Cyanobacteria for Heavy Metal Bioremediation. Sci. Total Environ. 761, 144111. doi:10.1016/j.scitotenv.2020.144111
Davies, F. K., Work, V. H., Beliaev, A. S., and Posewitz, M. C. (2014). Engineering Limonene and Bisabolene Production in Wild Type and a Glycogen-Deficient Mutant of Synechococcus Sp. PCC 7002. Front. Bioeng. Biotechnol. 2, 21–11. doi:10.3389/fbioe.2014.00021
Ducat, D. C., Way, J. C., and Silver, P. A. (2011). Engineering Cyanobacteria to Generate High-Value Products. Trends Biotechnol. 29, 95–103. doi:10.1016/j.tibtech.2010.12.003
Englund, E., Shabestary, K., Hudson, E. P., and Lindberg, P. (2018). Systematic Overexpression Study to Find Target Enzymes Enhancing Production of Terpenes in Synechocystis PCC 6803, Using Isoprene as a Model Compound. Metab. Eng. 49, 164–177. doi:10.1016/j.ymben.2018.07.004
Erdrich, P., Knoop, H., Steuer, R., and Klamt, S. (2014). Cyanobacterial Biofuels: New Insights and Strain Design Strategies Revealed by Computational Modeling. Microb. Cell Fact. 13, 128–142. doi:10.1186/s12934-014-0128-x
Gao, X., Gao, F., Liu, D., Zhang, H., Nie, X., and Yang, C. (2016). Engineering the Methylerythritol Phosphate Pathway in Cyanobacteria for Photosynthetic Isoprene Production from CO2. Energy Environ. Sci. 9, 1400–1411. doi:10.1039/c5ee03102h
Hendry, J. I., Prasannan, C. B., Joshi, A., Dasgupta, S., and Wangikar, P. P. (2016). Metabolic Model of Synechococcus Sp. PCC 7002: Prediction of Flux Distribution and Network Modification for Enhanced Biofuel Production. Bioresour. Technol. 213, 190–197. doi:10.1016/j.biortech.2016.02.128
Hendry, J. I., Prasannan, C., Ma, F., Möllers, K. B., Jaiswal, D., Digmurti, M., et al. (2017). Rerouting of Carbon Flux in a Glycogen Mutant of Cyanobacteria Assessed via Isotopically Non-stationary 13 C Metabolic Flux Analysis. Biotechnol. Bioeng. 114, 2298–2308. doi:10.1002/bit.26350
Iijima, H., Watanabe, A., Sukigara, H., Iwazumi, K., Shirai, T., Kondo, A., et al. (2021). Four-carbon Dicarboxylic Acid Production through the Reductive Branch of the Open Cyanobacterial Tricarboxylic Acid Cycle in Synechocystis Sp. PCC 6803. Metab. Eng. 65, 88–98. doi:10.1016/j.ymben.2021.03.007
Ishikawa, M., Tsuchiya, D., Oyama, T., Tsunaka, Y., and Morikawa, K. (2004). Structural Basis for Channelling Mechanism of a Fatty Acid β-oxidation Multienzyme Complex. Embo J. 23, 2745–2754. doi:10.1038/sj.emboj.7600298
Ishikawa, Y., and Kawai-Yamada, M. (2019). Physiological Significance of NAD Kinases in Cyanobacteria. Front. Plant Sci. 10, 847. doi:10.3389/fpls.2019.00847
Jazmin, L. J., Xu, Y., Cheah, Y. E., Adebiyi, A. O., Johnson, C. H., and Young, J. D. (2017). Isotopically Nonstationary 13C Flux Analysis of Cyanobacterial Isobutyraldehyde Production. Metab. Eng. 42, 9–18. doi:10.1016/j.ymben.2017.05.001
Kanehisa, M., Goto, S., Sato, Y., Kawashima, M., Furumichi, M., and Tanabe, M. (2014). Data, Information, Knowledge and Principle: Back to Metabolism in KEGG. Nucl. Acids Res. 42, D199–D205. doi:10.1093/nar/gkt1076
Kanehisa, M., and Goto, S. (2000). KEGG: Kyoto Encyclopedia of Genes and Genomes. Nucl. Acids Res. 28, 27–30. doi:10.1093/nar/28.1.27
Khan, A. Z., Bilal, M., Mehmood, S., Sharma, A., and Iqbal, H. M. N. (2019). State-of-the-Art Genetic Modalities to Engineer Cyanobacteria for Sustainable Biosynthesis of Biofuel and Fine-Chemicals to Meet Bio-Economy Challenges. Life (Basel) 9, 1–22. doi:10.3390/life9030054
Knoop, H., Zilliges, Y., Lockau, W., and Steuer, R. (2010). The Metabolic Network of Synechocystis Sp. PCC 6803: Systemic Properties of Autotrophic Growth. Plant Physiol. 154, 410–422. doi:10.1104/pp.110.157198
Knowles, V. L., Smith, C. S., Smith, C. R., and Plaxton, W. C. (2001). Structural and Regulatory Properties of Pyruvate Kinase from the Cyanobacterium Synechococcus PCC 6301. J. Biol. Chem. 276, 20966–20972. doi:10.1074/jbc.m008878200
Kramer, D. M., and Evans, J. R. (2011). The Importance of Energy Balance in Improving Photosynthetic Productivity. Plant physiol. 155, 70–78. doi:10.1104/pp.110.166652
Li, M., Long, B., Dai, S. Y., Golden, J. W., Wang, X., and Yuan, J. S. (2022). Altered Carbon Partitioning Enhances CO2 to Terpene Conversion in Cyanobacteria. BioDesign Res. 2022, 9897425. doi:10.34133/2022/9897425
Lin, P. C., Zhang, F., and Pakrasi, H. B. (2020). Enhanced Production of Sucrose in the Fast-Growing Cyanobacterium Synechococcus Elongatus UTEX 2973. Sci. Rep. 10, 390–398. doi:10.1038/s41598-019-57319-5
Ludwig, M., and Bryant, D. A. (2012). Acclimation of the Global Transcriptome of the Cyanobacterium Synechococcus Sp. Strain PCC 7002 to Nutrient Limitations and Different Nitrogen Sources. Front. Microbiol. 3, 145. doi:10.3389/fmicb.2012.00145
Nakajima, T., Yoshikawa, K., Toya, Y., Matsuda, F., and Shimizu, H. (2017). Metabolic Flux Analysis of Synechocystis Sp. PCC 6803 Δ nrtABCD Mutant Reveals a Mechanism for Metabolic Adaptation to Nitrogen-Limited Conditions. Plant Cell Physiol. 58 (3), 537–545. doi:10.1093/pcp/pcw233
Negi, S., Barry, A. N., Friedland, N., Sudasinghe, N., Subramanian, S., Pieris, S., et al. (2015). Impact of Nitrogen Limitation on Biomass, Photosynthesis, and Lipid Accumulation in Chlorella Sorokiniana. J. Appl. Phycol. 28, 803–812. doi:10.1007/s10811-015-0652-z
Nomura, C. T., Sakamoto, T., and Bryant, D. A. (2006). Roles for Heme-Copper Oxidases in Extreme High-Light and Oxidative Stress Response in the Cyanobacterium Synechococcus Sp. PCC 7002. Arch. Microbiol. 185, 471–479. doi:10.1007/s00203-006-0107-7
Pattanaik, B., and Lindberg, P. (2015). Terpenoids and Their Biosynthesis in Cyanobacteria. Life 5, 269–293. doi:10.3390/life5010269
Qian, X., Zhang, Y., Lun, D. S., and Dismukes, G. C. (2018). Rerouting of Metabolism into Desired Cellular Products by Nutrient Stress: Fluxes Reveal the Selected Pathways in Cyanobacterial Photosynthesis. ACS Synth. Biol. 7, 1465–1476. doi:10.1021/acssynbio.8b00116
Sake, C. L., Newman, D. M., and Boyle, N. R. (2020). Evaluation of Quenching Methods for Metabolite Recovery in Photoautotrophic Synechococcus Sp. PCC 7002. Biotechnol. Prog. 36, e3015. doi:10.1002/btpr.3015
Sake, C. L., Metcalf, A. J., and Boyle, N. R. (2019). The Challenge and Potential of Photosynthesis: Unique Considerations for Metabolic Flux Measurements in Photosynthetic Microorganisms. Biotechnol. Lett. 41, 35–45. doi:10.1007/s10529-018-2622-4
Shabestary, K., Anfelt, J., Ljungqvist, E., Jahn, M., Yao, L., and Hudson, E. P. (2018). Targeted Repression of Essential Genes to Arrest Growth and Increase Carbon Partitioning and Biofuel Titers in Cyanobacteria. ACS Synth. Biol. 7, 1669–1675. doi:10.1021/acssynbio.8b00056
Shinde, S., Singapuri, S., Jiang, Z., Long, B., Wilcox, D., Klatt, C., et al. (2022). Thermodynamics Contributes to High Limonene Productivity in Cyanobacteria. Metab. Eng. Commun. 14, e00193. doi:10.1016/j.mec.2022.e00193
Singh, R., Lemire, J., Mailloux, R. J., and Appanna, V. D. (2008). A Novel Strategy Involved Anti-oxidative Defense: The Conversion of NADH into NADPH by a Metabolic Network. PLoS ONE 3, e2682. doi:10.1371/journal.pone.0002682
Spaans, S. K., Weusthuis, R. A., Van Der Oost, J., and Kengen, S. W. (2015). NADPH-generating Systems in Bacteria and Archaea. Front. Microbiol. 6, 742. doi:10.3389/fmicb.2015.00742
Sun, H., Zhao, W., Mao, X., Li, Y., Wu, T., and Chen, F. (2018). Correction to: High-Value Biomass from Microalgae Production Platforms: Strategies and Progress Based on Carbon Metabolism and Energy Conversion. Biotechnol. Biofuels 11, 254. doi:10.1186/s13068-018-1253-2
Tamoi, M., Miyazaki, T., Fukamizo, T., and Shigeoka, S. (2005). The Calvin Cycle in Cyanobacteria Is Regulated by CP12 via the NAD(H)/NADP(H) Ratio under Light/dark Conditions. Plant J. 42, 504–513. doi:10.1111/j.1365-313x.2005.02391.x
Thiel, K., Patrikainen, P., Nagy, C., Fitzpatrick, D., Pope, N., Aro, E. M., et al. (2019). Redirecting Photosynthetic Electron Flux in the Cyanobacterium Synechocystis Sp. PCC 6803 by the Deletion of Flavodiiron Protein Flv3. Microb. Cell Fact. 18, 189. doi:10.1186/s12934-019-1238-2
Trost, P., and Lemaire, S. D. (2013). Redox Regulation of the Calvin – Benson Cycle : Something Old , Something New.
Wang, X., Liu, W., Xin, C., Zheng, Y., Cheng, Y., Sun, S., et al. (2016). Enhanced Limonene Production in Cyanobacteria Reveals Photosynthesis Limitations. Proc. Natl. Acad. Sci. U.S.A. 113, 14225–14230. doi:10.1073/pnas.1613340113
Weissman, J. C., Likhogrud, M., Thomas, D. C., Fang, W., Karns, D. A. J., Chung, J. W., et al. (2018). High-light Selection Produces a Fast-Growing Picochlorum Celeri. Algal Res. 36, 17–28. doi:10.1016/j.algal.2018.09.024
Wilde, A., and Hihara, Y. (2016). Transcriptional and Posttranscriptional Regulation of Cyanobacterial Photosynthesis. Biochimica Biophysica Acta (BBA) - Bioenergetics 1857, 296–308. doi:10.1016/j.bbabio.2015.11.002
Xiong, W., Cano, M., Wang, B., Douchi, D., and Yu, J. (2017). The Plasticity of Cyanobacterial Carbon Metabolism. Curr. Opin. Chem. Biol. 41, 12–19. doi:10.1016/j.cbpa.2017.09.004
You, L., Berla, B., He, L., Pakrasi, H. B., and Tang, Y. J. (2014). 13C-MFA Delineates the Photomixotrophic Metabolism ofSynechocystissp. PCC 6803 under Light- and Carbon-Sufficient Conditions. Biotechnol. J. 9, 684–692. doi:10.1002/biot.201300477
Young, J. D. (2014). INCA: A Computational Platform for Isotopically Non-stationary Metabolic Flux Analysis. Bioinformatics 30, 1333–1335. doi:10.1093/bioinformatics/btu015
Young, J. D., Shastri, A. A., Stephanopoulos, G., and Morgan, J. A. (2011). Mapping Photoautotrophic Metabolism with Isotopically Nonstationary 13C Flux Analysis. Metab. Eng. 13, 656–665. doi:10.1016/j.ymben.2011.08.002
Yu King Hing, N., Liang, F., Lindblad, P., Morgan, J. A., and Morgan, J. A. (2019). Combining Isotopically Non-stationary Metabolic Flux Analysis with Proteomics to Unravel the Regulation of the Calvin-Benson-Bassham Cycle in Synechocystis Sp. PCC 6803. Metab. Eng. 56, 77–84. doi:10.1016/j.ymben.2019.08.014
Zhang, S., and Bryant, D. A. (2011). The Tricarboxylic Acid Cycle in Cyanobacteria. Science 334, 1551–1553. doi:10.1126/science.1210858
Nomenclature
Metabolites
2PG 2-phosphoglycolyate
2PGA 2-phosphoglycerate
3PG 3-phosphoglycerate
ACA acetyl-CoA
ADP adenosine diphosphate
AKG alpha-ketoglutarate
ATP adenosine triphosphate
CIT citrate
DHAP dihydroxyacetone phosphate
DMAPP dimethylallyl pyrophosphate
DOXP deoxyxylulose 5-phosphate
E4P erythrose 4-phosphate
F6P fructose 6-phosphate
FBP fructose 1,6-bisphosphate
FUM Fumarate
G1P glucose 1-phosphate
G6P glucose 6-phosphate
GAP glyceraldehyde 3-phosphate
GLYC glycolate
GOX glyoxylate
ICI isocitrate
IPP isopentenyl pyrophosphate
LIM limonene
MAL malate
NAD+ nicotinamide adenine dinucleotide
NADH nicotinamide adenine dinucleotide hydride
NADP+ nicotinamide adenine dinucleotide phosphate
NADPH nicotinamide adenine dinucleotide phosphate hydride
OAA oxaloacetate
PEP phosphoenolpyruvate
PYR pyruvate
R5P ribose 5-phosphate
RU5P ribulose 5-phosphate
RUBP ribulose 1,5-bisphosphate
S7P sedoheptulose 7-phosphate
SBP sedoheptulose 1,7-bisphosphate
SSA succinic semialdehyde
SUC succinate
X5P xylulose 5-phosphate
Enzymes
LS limonene synthase
MDH malate dehydrogenase
ME malic enzyme
PEPc phosphoenolpyruvate carboxylase
PK pyruvate kinase
Keywords: cyanobacteria, terpenoid, ATP:NADPH ratio, PEP carboxylase, malic enzyme
Citation: Newman DM, Sake CL, Metcalf AJ, Davies FK, Cano M, Krishnan A and Boyle NR (2022) Characterizing Photosynthetic Biofuel Production: Isotopically Non-Stationary 13C Metabolic Flux Analysis on Limonene Producing Synechococcus sp. PCC 7002. Front. Energy Res. 10:896668. doi: 10.3389/fenrg.2022.896668
Received: 15 March 2022; Accepted: 31 May 2022;
Published: 07 July 2022.
Edited by:
Simona Liguori, Clarkson University, United StatesReviewed by:
John A. Morgan, Purdue University, United StatesYu Wang, Xiamen University, China
Corinne Cassier-Chauvat, Institut de Biologie Intégrative de la Cellule (I2BC), France
Copyright © 2022 Newman, Sake, Metcalf, Davies, Cano, Krishnan and Boyle. This is an open-access article distributed under the terms of the Creative Commons Attribution License (CC BY). The use, distribution or reproduction in other forums is permitted, provided the original author(s) and the copyright owner(s) are credited and that the original publication in this journal is cited, in accordance with accepted academic practice. No use, distribution or reproduction is permitted which does not comply with these terms.
*Correspondence: Nanette R. Boyle, bmJveWxlQG1pbmVzLmVkdQ==
†These authors have contributed equally to this work and share first authorship