- Department of Intelligent Manufacturing, Wuyi University, Jiangmen, China
In commercial buildings, the total consumption of central air conditioning accounts for about 40%–50%. However, at present, the initial design value of building Heating Ventilation and Air Conditioning (HVAC) is usually far greater than the actual refrigeration value of refrigeration demand, which will lead to great energy consumption waste. Moreover, the operation of HVAC affects the thermal comfort of users, so it is necessary to establish a thermal model for the scene to control. The thermal model describes the temperature of the scene in different environments. So it is very important to design a thermal model to calculate the scene in real time. Because the flow of people, the opening of windows, the ventilation of the scene and other parameters influence the change of thermal state in the scene environment, these parameters are complicated to model. Human disturbance will lead to the instability of the state of the scene environment. The inconsistency of its thermal model will lead to energy allocation tracking strategies in different regions. To solve this problem, We propose a thermal model for building thermal comfort using a multimodal analysis framework. This paper analyzes multiple temperature and humidity sensors and area image by multimodal combination and processes the image and sensor data by combining CNN and LSTM. Our results show that when the thermal model analyzed by this method is deployed in a building in the south of China, the MSE accuracy of the local effect of temperature field prediction reaches 99%, and its AMAX reaches 94%, so the running stability of the model in the scene is high. In addition, the research shows that the thermal model analysis framework can make the Internet of Things (IoT) in buildings more intelligent, and it can be combined with this thermal model to improve human comfort, make it easier to deploy in each hot zone, and have a better overall energy-saving effect.
Introduction
Buildings account for about 30% of the total global energy consumption and carbon emissions, causing serious energy and environmental problems (e.g., Yu et al., 2021). In addition, the energy demand of buildings is expected to increase by 50% in the next 30 years (e.g., Sharma et al., 2019). With the increased global focus on energy conservation and carbon emission reduction, improving energy utilization rates has become the focus of many research works. Under the above background, the rise of intelligent buildings makes it possible to improve the energy utilization rate. He can use many advanced technologies, such as the Internet of Things, cloud computing and deep learning analysis. Because the HVAC system accounts for 30%–50% of total building energy usage (e.g., Chiara Delmastro and Abergel, 2019), it is possible to provide energy-saving control such as HVAC regulation for building users.
However, at present, the adjustment of HVAC in intelligent buildings is based on the perception of the hot zone of the building scene, such as thermal-comfort analysis, and identification of the scene variables (number of people and CO2). However, suppose there is no good perception and frequency conversion control. In that case, these adjustments will worsen human comfort in the building to a certain extent and then affect the residents’ long-term health and work efficiency. In thermal comfort analysis, we need to consider to many factors, but in this paper, we take temperature as the main consideration.
For example, the widely used proportional integral differential algorithm (e.g., Clifford and Stephenson, 1986) realizes the rule-based heuristic control mechanism. Comfort is defined as the set point temperature, such as 23°C. As long as the indoor temperature is not much different from the set point, this strategy will optimize energy efficiency. Similar works are also included in (e.g., Moon et al., 2013; UZhang et al., 2018; Nagarathinam et al., 2020; Yu et al., 2020). However, because this empirical assumption regarding comfort has been repeatedly demonstrated to be incorrect, energy savings are frequently realized at the expense of occupant satisfaction. However, several studies (e.g., Ter Mors et al., 2011; Maiti, 2014; Khan and Pao, 2015) believe that these normative models are insufficient for evaluating human thermal feelings. Their experimental results indicate that these models frequently underestimate or exceed the thermal comfort level of humans by a significant margin under various climatic circumstances. Therefore, it is difficult to use the thermal comfort analysis of the scene as the basis for control. Indeed, our literature survey indicates that more parameters/signals related to human thermal comfort have been investigated over the last 2 decades, including environmental parameters such as CO2 concentration (e.g., Seppänen et al., 1999; Kolokotsa et al., 2001), vision (such as color), and acoustics (such as noise) (e.g., Frontczak and Wargocki, 2011), and vital personal signs such as sex (e.g., Parsons, 2002; Karjalainen, 2007), age (e.g., Indraganti and Rao, 2010), heart rate (e.g., Epstein and Moran, 2006; Liu et al., 2008), and skin temperature (e.g., Höppe, 2002). As a result, it is required to reconsider the foundations and methods of energy-saving control and design a thermal model that precisely and effectively expresses the thermal dynamics of buildings for building control.
At present, the indeterminacy of the control basis for HVAC in intelligent buildings doesn’t explain why it should be controlled like this, and many current control basis often didn’t consider the disturbance in a large area, so it is very valuable to explain the indoor air thermal model. There are two widely used thermal building models in the literature: the first is the first principle physics model, which employs thermal dynamics equations to describe thermal equilibrium (e.g., Xu and Wang, 2008; Li et al., 2009). This model is frequently used in building simulations (e.g., Crawley et al., 2001) and has shown a reliable result. The lumped-parameter reduced order model (e.g., Laret, 2000; Gouda et al., 2002; Fraisse et al., 2002; Rodríguez Jara et al., 2016. Resistance-Capacitance models), which reduces the system’s representation while still capturing the relevant physics of a first principle model, is the second type of thermal model. For various reasons, both approaches are challenging to apply in practice. For model selection and parameter identification, domain knowledge is first required. Second, the model is zone-specific and time-specific, which means that the model of each thermal zone in a building needs to be manually configured by calibration alone and is challenging to use in various environments. Third, these models cannot be altered to match the environment’s real-time unctioning (e.g., Zhang et al., 2019). Data-driven techniques have become increasingly popular as a result of these factors. The author of Zhang et al. (2019) proposed that machine learning be used to model and predict a single temperature sensor in the scene, which could then be used to control the system. On the other hand, existing data-driven models either require analog data for testing or require reasonably accurate time-series temperature data. Thus, in practice, we require a thermal model capable of enhancing the expression of real-time scenes.
In this research, to build the thermal model of the scene in real time and utilize the sensors in the intelligent building appropriately and economically. We propose a framework for the real-time prediction of building thermal models using multimodal scene data. It aims to automatically predict the thermal model of the scene through the temperature of certain areas in the scene. Therefore, we use multimodal scene data fusion to align the monitored image data of the scene in the building with the locally deployed temperature and humidity sensors according to the position. It can take a scene area as one of the agents of the smart building, and the control of frequency conversion can control the thermal model analysis results of each agent. The paper proposes a learning model for a building’s thermal model in a hot zone. The monitored image data is analyzed using CNN. The temperature and humidity sensor data in each area are encoded using encoder. Finally, the encoded data of each time step and the features extracted by CNN are fused and then analyzed by LSTM. The analysis results from the above two methods are aligned with the hot zone’s actual location to predict the hot zone’s overall thermal model. The framework is easy to integrate with various smart buildings’ Internet of Things systems (IoT). The proposed framework only relies on the data collected by surveillance cameras and a few temperature and humidity sensor in hot areas for learning, which is affordable for most building owners. Additionally, we developed and deployed the framework in the actual building and quantified the temperature prediction error of each indoor overall thermal model area based on the learned model. Therefore, this paper is expected to provide insights for the quantification of indoor air thermal models and the basic development of HVAC control in intelligent buildings and help to enable and popularize advanced HVAC control in intelligent building applications based on the Internet of Things (IoT).
The rest of the paper is arranged as follows: Section 2 introduces the architecture and Internet of Things platform deployed in this work. The Section 3 introduces the principles of building an indoor air thermal model. The Section 4 describes multimodal scene data’s thermal model learning framework, including data preparation, preprocessing, and training. In the Section 5, a case study based on an actual building is conducted to verify the framework and evaluate the final thermal model. Section 6 summarizes the current research focus and future work.
Construction and Installation of an Internet of Things Platform at an Experimental Site
The experimental space for this paper’s thermal model is a teaching classroom 205 on the campus of Wuyi University in Jiangmen City, Guangdong Province, China. The space’s length, width, and height are 1262, 1671.5, and 451.7 cm, with a podium and a table, and the camera is placed at the door. The three-dimensional composition of the space is shown in Figure 1, with a total area of 160 square meters.
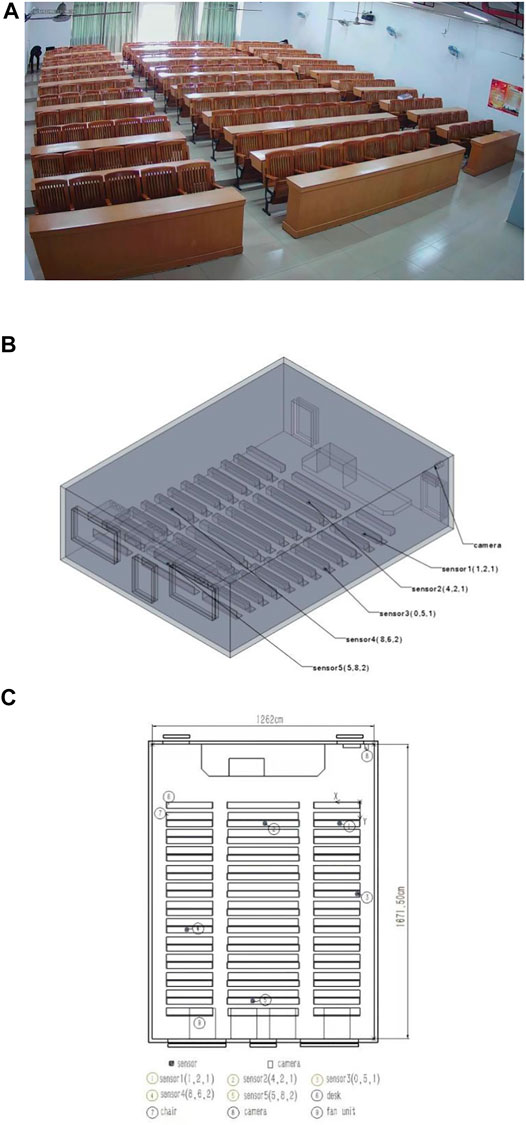
FIGURE 1. This picture shows the distribution of the scene. (A) shows the 3D model of the scene, (B) shows the actual map of the scene, and Figure (C) shows the detailed bird’s eye view of the scene.
In this paper, in order to more accurately measure the indoor temperature and observe the temperature change, we use gambit software to establish the room model and use fluent for numerical calculation, take the average temperature of the room working area as the temperature of the whole working area, obtain the temperatures of multiple measuring points in the room working area, and study the best location of the indoor temperature sensor. Five sensors are deployed in an area of 160 square meters, Using the sensors as a prediction device for model building, it shows the three-dimensional situation of its layout from Figure 1B.
The Internet of Things system (IoT) is a software platform that enables the monitoring, control, and intelligent application of equipment in buildings, with the goal of optimizing the management of building energy use and indoor comfort. The proposed framework for learning can be used as a proxy service throughout the entire building system. Similar to the communication function of the mobile phone application on the mobile operating system, the management system provides lower-level services [for example, interfaces with Internet of Things (IoT) devices and historical data storage in each hot zone in the building] and focuses on solving some specific problems (for example, learning the thermal model of the air scene in each hot zone). In this study, the multiarea proxy energy management system based on the Internet of Things (IoT) is deployed in the test hot zone of the building and runs on the edge equipment.
In order to collect heat-related data and monitoring data in the scene, the temperature and humidity data are communicated by Bluetooth to a wireless network gateway, and the current data of each minute is collected from the sensor and stored in the MySQL database of the server. The image data of common visual camera is transmitted to the nodes of the processing server through TCP, and the temperature and humidity data along with the image data are used to align the areas. Then, the thermal model of the hot zone is analyzed through the platform, and the control of frequency conversion is given to the decision service. The ready-made intelligent temperature controller in each hot zone is used to control the hot zone’s decision service HVAC fan control unit through Lora communication. The server terminal processes the whole building, the equipment in each hot zone comes from the original equipment, so the equipment price is relatively more economical. Because the platform supports a variety of control schemes, their large-scale deployment in intelligent buildings has a high return on investment. In order to improve the perception of the thermal model in the hot zone and learn the thermal model in the hot zone from local sensors and monitoring data. As discussed in the third chapter, a thermal model in the hot zone based on multimodal scene data is established.
Grid Segmentation and Data Set of Thermal Model Construction in Hot Zone
In this section, we describe the analysis and construction of data-driven thermal model in hot zone. Please note that data drives the experiment in this paper, and the results of sensors directly guide all the data. Therefore, although the experiment in this paper was conducted in autumn, the proposed framework can also be used directly in winter, and only the trained model needs to be updated.
Grid Segmentation in Hot Zone
In this paper, the experimental scene of the building is segmented according to the ratio of 10*10*10, and the total number of segmented blocks is 1000. This segmented grid is used as the thermal model analysis of the scene, and the temperature field is constructed and analyzed. Five sensors are deployed in an area of 160 square meters, and the deployment positions are randomly determined. Using one of the sensors as a prediction device for model building, it shows the three-dimensional situation of its layout from Figure 1.
Situation With the Data Set
The temperature and humidity sensor samples once every minute, and the time of sampling is aligned with the image, so that the multimodal scene data at that time can be obtained.
The temperature and humidity sensor is a Bluetooth sensor with SHT20 chip produced by the Jaalee manufacturer. Its small size will not affect its daily use. Its temperature measurement range is from −40°C to +60°C, its accuracy is + −0.3°C, the humidity range is 0%–100%, and its accuracy is + −3%, which can meet the annual data collection in this area.
The monitor image data is collected every second, which is a zoom webcam with a 4K camera, which can collect full-coverage images of hot spots. It is transmitted to the memory through FRP. If the model is needed to analyze and predict the temperature field in real time, it can be obtained by obtaining the network address of the webcam. Figure 2 is the visualization of surveillance images and sensor acquisition data.
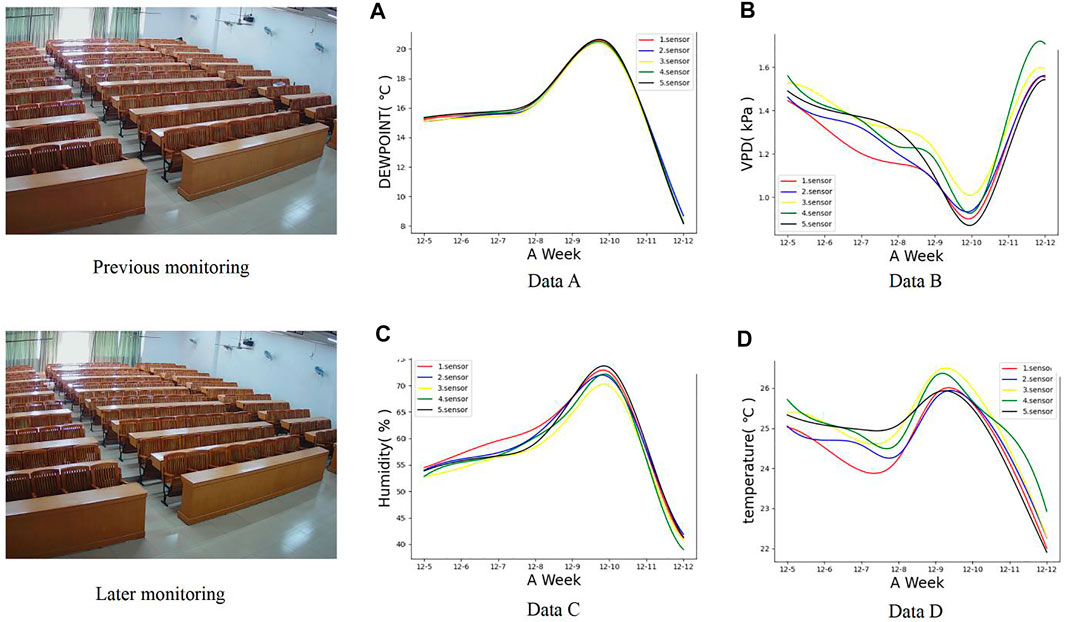
FIGURE 2. The figure is a visualization of the data, the left area is the monitoring image, and the right area is the data collected by the sensor, namely dewpoint (°C),VPD(kPa), humidity (%) and temperature (°C).
Learning Framework of the Hot Zone Thermal Model for Multimodal Scene Data
This chapter describes the architecture of school framework for building thermal model by using scene data and the hardware used to realize it.
The Thermal Model Learning Channel
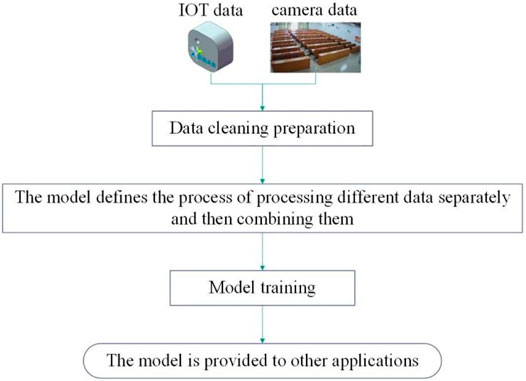
Figure 3 shows the flow of thermal model learning, it includes three main steps: collecting data from multiple temperature and humidity sensors; using an edge device or cloud platform for thermal model learning; and delivering the learned model to other intelligent control applications. The whole process is entirely automatic, and there is no intervention. The learning process begins with data preprocessing. That is, historical temperature sensor and image data from the previous few days is used and cleaned as a training data set. This research is data-driven.
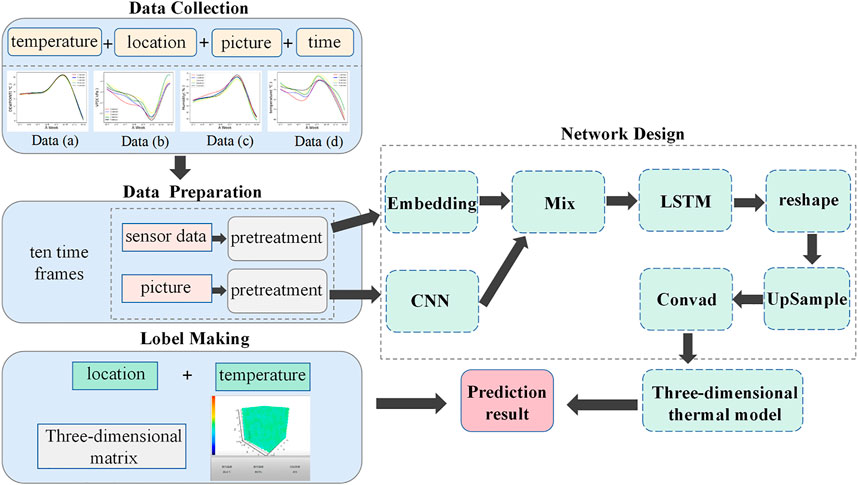
Figure 4 shows the overall training process. The model inputs the temperature values and images with the specific continuous time steps average. The model’s label is the sum average of the temperature values with the range of 2 in the fixed position in the 10*10*10 matrix as the label, which is sent to the second step as described in section B of chapter 3.
Model Frame
The model uses the CNN framework to process visual data and the LSTM framework to process temperature and humidity data. As shown in the in the Figure 5, CNN is used to extract features from input images, and embedding is used to encode data continuously collected by multiple sensors. Then, at each time step, the features extracted by CNN are spliced into the time dimension to be input to LSTM. In this way, the model can use successive frames of information and then decode the output temperature field by the decoder.
Data Preprocessing
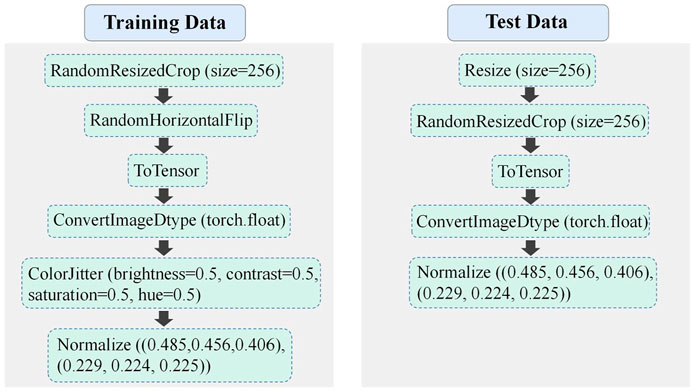
Before training, the data is preprocessed. The preprocessing steps of the training data and the preprocessing steps of the test data are shown in Figure 6. After the preprocessing, the data is provided to the model. When the model obtains the data, The preprocessed input data is learned every 10 time steps by a sliding window algorithm.
Fitness Metrics
The MSE (e.g., Chen et al., 2020) and AMAX (e.g., Chen et al., 2021) error metrics, which are the mean value (MSE) of the sum of squares of the errors between the predicted and original data points, and the Absolute Error of the Maximum Temperature, respectively, were used to evaluate and compare the performance of the created algorithms (AMAX)
CNN-LSTM Structure
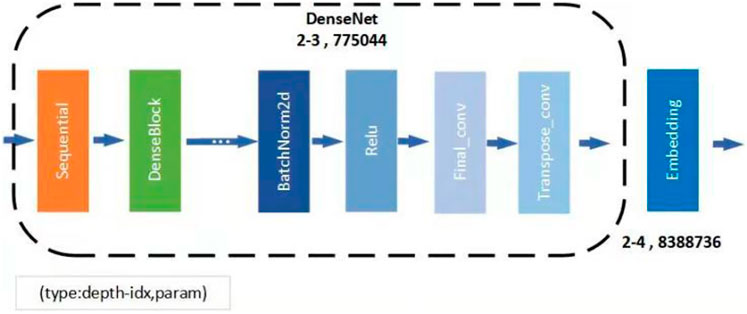
In terms of CNN, the deeper the network is, the more practical information can be obtained. However, with the deepening of the network, the optimization effect worsens because the deepening of the network will cause gradient explosion and disappearance. In order to avoid the loss of important information, this paper designs an improved CNN, which is suitable for extracting the thermal model of the image. When designing the improved CNN model, the following parameters shown in in the Figure 7 were considered.
The CNN of this paper adopts the structure of DenseNet (e.g., Huang et al., 2017). DenseNet network is used as the upper-layer network, and DenseNet classifies images at pixel level, thus solving the problem of image segmentation at semantic level. Different from the classic CNN classification method in which the feature vectors of all connected layers get a fixed degree after the convolution layer, DenseNet can accept the output image of any size, and uses the deconvolution layer to upsample the feature map of the last convolution layer to restore it to the same scale as the output image, so that each pixel can be predicted. At the same time, the spatial information in the original output image is retained. After the exported image passes through the backbone network, the image features are getting smaller and smaller, and the resolution gets lower and lower. After that, DenseNet and others unpooling the features by transpose convolution, and reduced the image features to the size of the original image. At the same time, to capture the shallow features, the skip structure was used appropriately to predict the temperature field. In addition, although some algorithms use multiscale feature fusion, they usually use fused features to make predictions. However, the difference in this paper is that the predictions are made independently in different feature layers, and the network structure of skip connection is also used to fuse features of different depths to obtain more detailed image features. Simply put, the features generated in the last step are used to predict the temperature field after multiple upsampling and feature fusion.
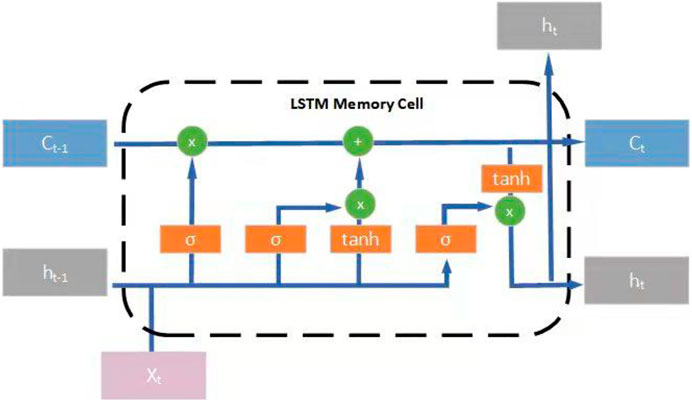
LSTM is the lower layer of CNN-LSTM, which stores the time information of the scene and is multi-modal data running in the whole. The structure of LSTM is shown in Figure 8 below. LSTM provides a solution to preserve long-term memory by consolidating storage units to update the apparent hidden state. This function makes it easy to understand the time relationship of long-term series. The output value from the previous cable news network layer is passed to the gate unit. The LSTM network is very suitable for predicting the thermal model of real-time scenes by solving the explosive and disappearing gradient problems that may occur when learning traditional neural networks. The fused part is processed by the LSTM network, using basic LSTM, Bi-LSTM, and LSTM multi layers bi. The CSALSTM used in this article uses a self-attention mechanism at the input layer, which is a two-way, two-layer, and the output layer also adopts a self-attention LSTM to learn attention weights in different time steps.
Architecture
CNN-LSTM is basically composed of a convolution layer, a convergence layer, an LSTM layer, and a dense layer. The convolution layer uses densenet as the backbone network, because the monitoring image represents a lot of information in the scene, such as the mobility of people and the location of people in the scene. By extracting the features of the scene in the convolution layer, and coding the sensor, the convolution features and codes are converged and input into LSTM for prediction. Because LSTM structure has the ability to memorize long-term and short-term information, Because the prediction of the thermal model is influenced by time, the time that the human body stays in the scene will affect the prediction effect of the thermal model. The longer the human body stays, the thermal model will tend to be stable at this time. Therefore, LSTM structure is used to learn its changes due to time. The running data is a multivariate time series, preprocessed to a window of 10-time steps by a sliding window algorithm. Data passes through the convolution and aggregation layers and then through LSTM. We designed the parameters of CNN-LSTM, as shown in Table 1. This table shows the number of filters in each convolution layer, the size and steps of the convolution layer, the core of the pooling layer, and the number of parameters of the whole layer, including the LSTM layer.
Case Study
Data Introduction
This section discusses the data collection and testing process of learning model framework in the construction of test platform.
The temperature and humidity sensor readings used in this study were collected in October, November, and December 2021. The temperature data and monitoring image data collected by five temperature sensors are recorded on the platform, and the aligned data reaches 46,285 pieces, as shown in Table 2.
Among them, data time is the timestamp, Zp is the address of the monitoring image, 1 device number 1_tp is the temperature value of the device in degrees Celsius. Example of images are shown in Table 2.
The equipment is modeled in a matrix of 10*10*10 in the scene. The location is shown in Figure 1C.
Model Training
In the training process, the input batch is 16, the input size is scaled for data efficiency, and 32 consecutive frames are used. The optimization algorithm selects SGD. The network is trained by cosine learning rate decay. The initial learning rate is 0.025, Due to the large amount of data, the mse dropped to a stable state in the first epoch, so we trained the epoch to be 10. The loss function is MSE. The implementation was based on the public PyTorch platform. The training and testing bed was Windows 10 system with two NVIDIA GeForce RTX 2070 SPUER graphics card.
Thermal Evaluation Results
We have done tests to confirm that the suggested strategy is superior than previous deep learning-based models. Table 3 covers the performance of deep learning models for forecasting energy usage. LSTM-Densenet, Bi-LSTM-Densenet, and Attention LSTM-Densenet are used for time series prediction. The findings are assessed in two error measures like MSE and AMAX. Experimental findings reveal that the proposed CNN-LSTM model provides higher performance than the standard deep learning approaches for power.
Discussion
In order to establish an accurate and effective building thermal model in hot zone. In this paper, the method of data-driven and Internet of things is used to study and model the hot zone thermal model, and a learning framework based on multimodal scene data is established. The framework aims to learn the thermal model of the building scene from the data collected by multiple sensors in the scene, predict the temperature and humidity of the scene in real time and accurately, facilitate the subsequent energy-saving control and provide the corresponding basis.
A case study based on the data of real-life buildings shows that The MSE error of local temperature field prediction is 99%, and the average relative error is 90% by using this thermal model learning framework. This means that the learned model can be used to provide reliable thermal comfort evaluation when implementing intelligent control. The framework is easy to integrate with the Internet of Things (IoT) systems of various intelligent buildings, providing a convenient way to integrate.
Generally speaking, this real-time prediction framework of thermal model can explain the reasons for fine scene control in intelligent buildings, and can analyze the real-time thermal model when someone walks in the area. It enriches the physical data of the scene and provides a solution for the perceptual digital twinning of the scene. This real-time prediction framework can avoid the difficulty of real-time energy distribution tracking in CFD modeling, so as to greatly speed up the listing process of technology and make more buildings adopt advanced control. The future work of this topic includes: 1) exploring the application effect in other complex types of buildings; 2) The model is used to track energy distribution and realize on-demand supply.
Data Availability Statement
The original contributions presented in the study are included in the article/supplementary material, further inquiries can be directed to the corresponding authors.
Author Contributions
Conceptualization: YL, QP, and JL. Methodology: YL, QP, JL, and YP. Validation: YM and SL. Data curation: YL, QP, JL, YP, YM, and SL. Writing—original draft preparation: YL, QP, JL, and YM. Supervision: YM and SL. Project administration: YM and SL. All authors have read and agreed to the submitted version of the manuscript.
Funding
This work was supported by the National University Students Innovation and Entrepreneurship Training Program project No.202011349003S and Guangdong climbing plan project No. pdjh2021b0507.
Conflict of Interest
The authors declare that the research was conducted in the absence of any commercial or financial relationships that could be construed as a potential conflict of interest.
Publisher’s Note
All claims expressed in this article are solely those of the authors and do not necessarily represent those of their affiliated organizations, or those of the publisher, the editors and the reviewers. Any product that may be evaluated in this article, or claim that may be made by its manufacturer, is not guaranteed or endorsed by the publisher.
References
Chen, X., Zhao, X., Gong, Z., Zhang, J., Zhou, W., Chen, X., et al. (2021). A Deep Neural Network Surrogate Modeling Benchmark for Temperature Field Prediction of Heat Source Layout. Sci. China Phys. Mech. Astron. 64 (11), 1–30. doi:10.1007/s11433-021-1755-6
Chen, Y., Zheng, Y., and Samuelson, H. (2020). “Fast Adaptation of Thermal Dynamics Model for Predictive Control of HVAC and Natural Ventilation Using Transfer Learning with Deep Neural Networks[C],” in 2020 American Control Conference (ACC).(IEEE), 2345–2350.
Chiara Delmastro, J. D., and Abergel, T. (2019). Cooling: Tracking Clean Energy Progress. Available at: http://www.iea.org/tcep/buildings/cooling/(Accessed on April 14, 2020).
Clifford, J., and Stephenson, W. (1986). “An Introduction To[J]. Wisdom Literature in Mesopotamia and Israel, 1986. Author 1, A.B.; Author 2, C.D.; Author 3, E.F. Title of Presentation,” in Proceedings of the Name of the Conference, Location of Conference, Country, Date of Conference. (Day Month Year).
Crawley, D. B., Lawrie, L. K., Winkelmann, F. C., Buhl, W. F., Huang, Y. J., Pedersen, C. O., et al. (2001). EnergyPlus: Creating a New-Generation Building Energy Simulation Program. Energy Build. 33 (4), 319–331. doi:10.1016/s0378-7788(00)00114-6
Epstein, Y., and Moran, D. S. (2006). Thermal Comfort and the Heat Stress Indices. Ind. Health 44 (3), 388–398. doi:10.2486/indhealth.44.388
Fraisse, G., Viardot, C., Lafabrie, O., and Achard, G. (2002). Development of a Simplified and Accurate Building Model Based on Electrical Analogy. Energy Build. 34 (10), 1017–1031. doi:10.1016/s0378-7788(02)00019-1
Frontczak, M., and Wargocki, P. (2011). Literature Survey on How Different Factors Influence Human Comfort in Indoor Environments. Build. Environ. 46 (4), 922–937. doi:10.1016/j.buildenv.2010.10.021
Gouda, M. M., Danaher, S., and Underwood, C. P. (2002). Building Thermal Model Reduction Using Nonlinear Constrained Optimization. Build. Environ. 37 (12), 1255–1265. doi:10.1016/s0360-1323(01)00121-4
Höppe, P. (2002). Different Aspects of Assessing Indoor and Outdoor Thermal Comfort[J]. Energy Build. 34 (6), 661–665. F[20].
Huang, G., Liu, Z., Van Der Maaten, L., and Weinberger, K. Q. (2017). “Densely Connected Convolutional Networks[C],” in Proceedings of the IEEE conference on computer vision and pattern recognition, 4700–4708.
Indraganti, M., and Rao, K. D. (2010). Effect of Age, Gender, Economic Group and Tenure on Thermal Comfort: A Field Study in Residential Buildings in Hot and Dry Climate with Seasonal Variations. Energy Build. 42 (3), 273–281. doi:10.1016/j.enbuild.2009.09.003
Karjalainen, S. (2007). Gender Differences in Thermal Comfort and Use of Thermostats in Everyday Thermal Environments. Build. Environ. 42 (4), 1594–1603. doi:10.1016/j.buildenv.2006.01.009
Khan, M. H., and Pao, W. (2015). Thermal Comfort Analysis of PMV Model Prediction in Air Conditioned and Naturally Ventilated Buildings[J]. Energy Procedia 75, 1373–1379. doi:10.1016/j.egypro.2015.07.218
Kolokotsa, D., Tsiavos, D., Stavrakakis, G. S., Kalaitzakis, K., and Antonidakis, E. (2001). Advanced Fuzzy Logic Controllers Design and Evaluation for Buildings' Occupants Thermal-Visual Comfort and Indoor Air Quality Satisfaction. Energy Build. 33 (6), 531–543. doi:10.1016/s0378-7788(00)00098-0
Laret, L. (2000). “Use of General Models with a Small Number of Parameters, Part 1: Theoretical Analysis[C],” in Proceedings of Conference Clima, 263–276.
Li, X. Q., Chen, Y., Spitler, J. D., and Fisher, D. (2009). Applicability of Calculation Methods for Conduction Transfer Function of Building Constructions. Int. J. Therm. Sci. 48 (7), 1441–1451. doi:10.1016/j.ijthermalsci.2008.11.006
Liu, W., Lian, Z., and Liu, Y. (2008). Heart Rate Variability at Different Thermal Comfort Levels. Eur. J. Appl. Physiol. 103 (3), 361–366. doi:10.1007/s00421-008-0718-6
Maiti, R. (2014). PMV Model Is Insufficient to Capture Subjective Thermal Response from Indians. Int. J. Industrial Ergonomics 44 (3), 349–361. doi:10.1016/j.ergon.2014.01.005
Moon, J. W., Yoon, S.-H., and Kim, S. (2013). Development of an Artificial Neural Network Model Based Thermal Control Logic for Double Skin Envelopes in Winter. Build. Environ. 61, 149–159. doi:10.1016/j.buildenv.2012.12.010
Mors, S. t., Hensen, J. L. M., Loomans, M. G. L. C., and Boerstra, A. C. (2011). Adaptive Thermal Comfort in Primary School Classrooms: Creating and Validating PMV-Based Comfort Charts. Build. Environ. 46 (12), 2454–2461. doi:10.1016/j.buildenv.2011.05.025
Nagarathinam, S., Menon, V., Vasan, A., and Anand, S. (2020). “Marco-multi-agent Reinforcement Learning Based Control of Building Hvac Systems[C],” in Proceedings of the Eleventh ACM International Conference on Future Energy Systems, 57–67. H[8]. doi:10.1145/3396851.3397694
Parsons, K. C. (2002). The Effects of Gender, Acclimation State, the Opportunity to Adjust Clothing and Physical Disability on Requirements for Thermal Comfort. Energy Build. 34 (6), 593–599. doi:10.1016/s0378-7788(02)00009-9
Rodríguez Jara, E. Á., Sánchez de la Flor, F. J., Álvarez Domínguez, S., Molina Félix, J. L., and Salmerón Lissén, J. M. (2016). A New Analytical Approach for Simplified Thermal Modelling of Buildings: Self-Adjusting RC-Network Model. Energy Build. 130, 85–97. doi:10.1016/j.enbuild.2016.08.039
Seppänen, O. A., Fisk, W. J., and Mendell, M. J. (1999). Association of Ventilation Rates and CO2 Concentrations with Health Andother Responses in Commercial and Institutional Buildings[J]. Indoor air 9 (4), 226–252. doi:10.1111/j.1600-0668.1999.00003.x
Sharma, S., Xu, Y., Verma, A., and Panigrahi, B. K. (2019). Time-Coordinated Multienergy Management of Smart Buildings under Uncertainties. IEEE Trans. Ind. Inf. 15 (8), 4788–4798. Author 1, A.; Author 2, B. Book Title, 3rd ed.; Publisher: Publisher Location, Country, 2008; pp. 154–196. doi:10.1109/tii.2019.2901120
UZhang, Z., Chong, A., and Pan, Y. (2018). “A Deep Reinforcement Learning Approach to Using Whole Building Energy Model for Hvac Optimal Control[C],” in 2018 Building Performance Analysis Conference and SimBuild, 22–23.3
Xu, X., and Wang, S. (2008). A Simplified Dynamic Model for Existing Buildings Using CTF and Thermal Network Models. Int. J. Therm. Sci. 47 (9), 1249–1262. doi:10.1016/j.ijthermalsci.2007.10.011
Yu, L., Qin, S., Zhang, M., Chao, S., Tao, J., and Guan, X. (2021). A Review of Deep Reinforcement Learning for Smart Building Energy Management[J]. IEEE Internet Things J. 8, 12046–12063.doi:10.1109/JIOT.2021.3078462
Yu, L., Sun, Y., Xu, Z., Shen, C., Yue, D., Tao, J., et al. (2020). Multi-agent Deep Reinforcement Learning for HVAC Control in Commercial Buildings[J]. IEEE Trans. Smart Grid 12 (1), 407–419. doi:10.1109/TSG.2020.3011739
Keywords: HVAC, multimodal analysis, real-time construction, thermal model, CNN-LSTM
Citation: Li Y, Peng Q, Lin J, Peng Y, Mai Y and Liang S (2022) Real-Time Construction of Thermal Model Based on Multimodal Scene Data. Front. Energy Res. 10:895534. doi: 10.3389/fenrg.2022.895534
Received: 14 March 2022; Accepted: 27 May 2022;
Published: 16 June 2022.
Edited by:
Zahra Hajabdollahi, University of Glasgow, United KingdomReviewed by:
Yingdong He, University of California, Berkeley, United StatesFarzaneh Ouderji, Ansys, United States
Copyright © 2022 Li, Peng, Lin, Peng, Mai and Liang. This is an open-access article distributed under the terms of the Creative Commons Attribution License (CC BY). The use, distribution or reproduction in other forums is permitted, provided the original author(s) and the copyright owner(s) are credited and that the original publication in this journal is cited, in accordance with accepted academic practice. No use, distribution or reproduction is permitted which does not comply with these terms.
*Correspondence: Yingan Mai, MzIwNTQ0NzUzQHFxLmNvbQ==; Shufen Liang, bHNmX3d5dUB3eXUuZWR1LmNu
 Yunlong Li
 Yimin Peng