- Electric Power Research Institute of State Grid Zhejiang Electric Power Co., Ltd., Hangzhou, China
In recent years, distributed photovoltaic facilities and distributed energy storage are widely connected to a low-voltage distribution network, which makes the topology of the low-voltage distribution network change faster, and the online identification and monitoring of the impedance of each branch are becoming more difficult. With the widespread installation of new distribution automation terminals and smart electricity meters, the technical gap of power data collection has been filled, the state perception ability of the distribution network has been improved, and the data support for further exploration of the topology and impedance of the distribution network has been provided. Therefore, the low-voltage distribution network topology and impedance identification method based on smart meter measurements, the physical topology model of distribution transformer-branch-meter box-user and the impedance exclusion model are proposed. Line loss and branch node power flow are calculated on the basis of the two models. Finally, the low-voltage distribution network topology recognition algorithm and power flow partition backtracking impedance estimation technology are developed based on the data mining method of distribution transformer terminal and smart meter. The example results show that the physical topology model of distribution transformer-branch-meter box-user and the impedance exclusion model proposed in this study can effectively identify the branch topology and impedance distribution in the low-voltage distribution network with a large amount of measurement information, realize the online perception of the distribution network, and provide the basis for the fine management of the power grid and line loss.
Introduction
A distribution network is one of the main components of a power system. According to the voltage grade, it can be divided into a high-voltage distribution network, medium-voltage distribution network, and low-voltage distribution network. With the increasing complexity of the power grid structure and the gradual expansion of scale year by year, problems such as serious voltage fluctuations, unqualified power quality, and unclear topology of low-voltage distribution networks are becoming more severe. Meanwhile, distributed photovoltaic facilities and distributed energy storage are widely connected to a low-voltage distribution network, which makes the topology of the low-voltage distribution network change faster, and the online identification and monitoring of the impedance of each branch are becoming more difficult. Power researchers are committed to solving relevant problems. For example, a record-based topological identification method simplifies the communication process between the transformer terminal units and the topological equipment (Xu et al., 2020), and an automatic identification strategy combined with a neural algorithm enables topological identification and real-time dynamic update of distribution network topology (Zhang et al., 2020).
At the same time, using the node branch incidence matrix to represent network topology can improve the disadvantages of large amount of matrix calculation and a slow calculation speed (Zhang et al., 2017). In addition, Wu (2021) investigated finite time topological identification and verifies the effectiveness by designing state feedback controllers. Zhang et al. (2018) proposed a topological identification method based on a smart meter to determine the upstream and downstream relationship between customers. With the change of measured value uploaded by terminal intelligent device, how to give real-time decision to realize online estimation and monitoring of branch node power flow has become one of the problems that a large number of power workers and electrical engineers pay close attention to (Coutino et al., 2021).
This study presents the low-voltage distribution network topology and impedance identification method based on smart meter measurements. First, a simplified typical low-voltage distribution network model with smart meters is constructed, the voltage correlation coefficient matrix is formed based on the node voltage measurement data sequence, and the Kruskal minimum spanning tree algorithm was introduced to generate low-voltage distribution network topology. Second, the voltage drop model of the distribution network line is proposed and the impedance identification of the low-voltage distribution network is completed. Thus, the physical topology model of distribution transformer-branch-meter box-user and the impedance exclusion model are established. The line loss and branch node power flow are calculated on the basis of the two models. Finally, the low-voltage distribution network topology recognition algorithm and power flow partition backtracking impedance estimation technology are developed based on the data mining method of distribution transformer terminal and smart meter, the online power flow estimation and monitoring of branch nodes and the segmented calculation of hierarchical line loss are realized too.
Topology Identification Method of Low-Voltage Distribution Network Based on Correlation Coefficient Analysis
In the distribution network, the voltage often fluctuates due to the uncertainty of loads everywhere. The voltage fluctuation curves of the loads with relatively close electrical distance are more similar (high correlation), while the voltage fluctuation curves of the loads with relatively far electrical distance are less similar (low correlation) (Li et al., 2019). By comparing the correlation coefficient between voltage curves of smart electricity meters of power users at different nodes, the topological connection between two users is verified. Therefore, this study selects Kendall rank correlation coefficient and uses the classification technology based on similarity measurement in the field of data mining to solve the verification problem of topological connection relationship between distribution network users.
Kendall’s Tau as a coefficient is often used to describe the correlation coefficient of two sequences in mathematical statistics (Taiwo et al., 2017). Kendall rank correlation coefficient applies the difference between the probability of cooperative consistency and non-cooperative consistency of the two random variables X and Y to represent the correlation (Huang et al., 2016). Suppose that the random variables X and Y have two groups of samples (x1,y1) and (x2,y2). If the size relationship between the two samples of variable X is maintained on variable Y at the same time, that is, if (x1–x2) (y1–y2) >0, the two samples are said to be consistent. The Kendall rank correlation coefficient is defined as follows:
where distribution (Xm,Ym) and distribution (X,Y) obey the same distribution, and distribution (Xm,Ym) is the median of distribution (X,Y). In general, Kendall’s Tau coefficient ranges from −1 to 1 in a square contingency table with the same number of rows and columns.
The voltage sampling values of each node at different times of the day are defined as the node time series data vector set. Furthermore, after obtaining the Kendall rank correlation coefficient of each node in the vector set, the strength of voltage correlation between each node is described in the form of matrix. If n is the total number of nodes in the topology, the node voltage correlation matrix Mn×n can be written as follows:
where i, j∈{1, 2, ..., n}, and τij is the Kendall rank correlation coefficient of each node. Kendall correlation considers the rank correlation of variables, not the value of variables. Therefore, it is not sensitive to outliers, which makes the judgment result of correlation more reliable.
Aiming at the sparsity of node voltage correlation matrix, Kruskal algorithm is used to solve the minimum spanning tree with maximum node correlation (Yan et al., 2020). The minimum spanning tree is the spanning tree with the smallest sum of the weights of all edges. After simple modification, it can be changed to be the spanning tree with the largest sum of the weights of all edges to generate the topology with the largest sum of correlation in the network. The Kruskal algorithm is a machine learning algorithm for solving weighted sub networks (Kusuma et al., 2017). It first sorts all connection weights in descending order, selects the maximum connection weight, adds the two nodes corresponding to the maximum connection weight to the initial minimum spanning tree network, and then continues to add maximum spanning tree connection weight value to the constructed spanning tree until all n nodes are added to the sub network. As shown in Figure 1, (a) graph represents the topology generated according to the maximum connection weight; (b) graph is the adjacency matrix of the entire topology network, and the two subgraphs are correlated and corresponding to each other.
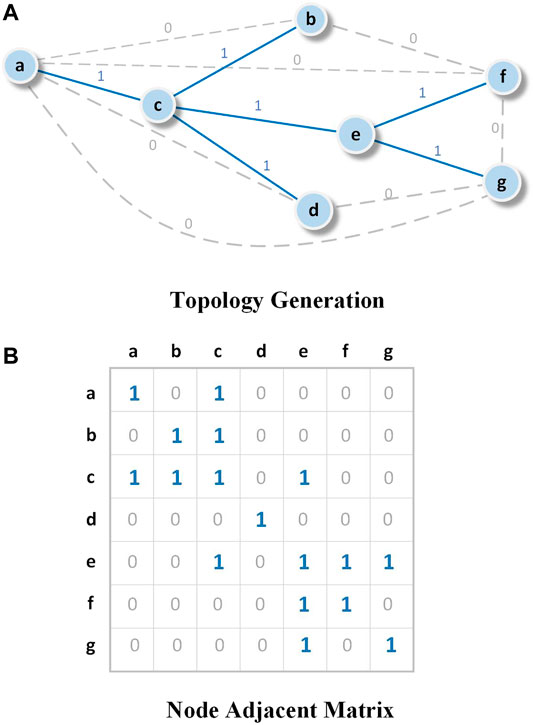
FIGURE 1. Topology identification based on node correlation. (A) Topology Generation. (B) Node Correlation Matrix.
Line Impedance Backtracking Identification Method of Low-Voltage Distribution Network Based on Voltage Linear Regression
Line parameters are important information in the topology of power supply network and the basis of analysis and application of power supply network (Fernandez et al., 2018). Based on the variation of line impedance parameters, work such as line loss analysis, tide ebb calculation, and electric theft detection can be carried out, and the lean management level of operation and maintenance can be improved. With the installation and application of a large number of smart electricity meters, electric power companies have been provided with a large number of measured data with high frequency, wide coverage, and time stamps, which make it become possible to calculate the line impedance of low-voltage power supply network.
This chapter is on the basis of collecting time series data of voltage, active power and reactive power, and identifying network topology through voltage correlation to establish a mathematical model of line impedance estimation and estimate line impedance parameters in segments according to the line voltage drop equation. On the basis of ignoring the difference of voltage phase angle, the impedance backtracking identification method of the low-voltage distribution network based on voltage linear regression is established, and the voltage linear regression equation is established according to the physical topology model of the distribution transformer-branch-meter box-user of the low-voltage distribution network, so as to gradually improve the reliability of line impedance calculation.
Model of Single Power Supply Line Between Nodes
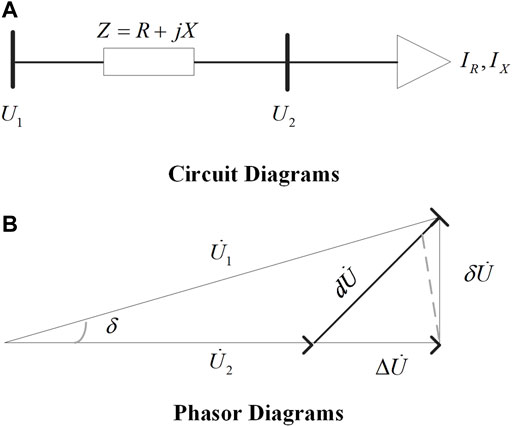
The low-voltage power supply networks in China are mostly radial and the actual topology is relatively complex. For the distribution system with urban tree structure and rural trunk structure, the line impedance is estimated by uniformly modeling the phase separation of single-phase line (Hasan et al., 2020). The equivalent circuit between any two connected nodes can be modeled as shown in Figure 2.
The line voltage drop equation is as follows:
In the formula, angle marker b∈{1,2}, where angle markers 1 and 2 represent the electrical quantity at the head and end of the circuit, respectively. Considering the characteristics that X/R and reactive power of nodes are relatively small in low-voltage power supply lines, the difference of the voltage phase angle is ignored. So, the voltage drop in the circuit of adjacent nodes is approximately as follows:
where
Model of Parent Node Parallel Circuit
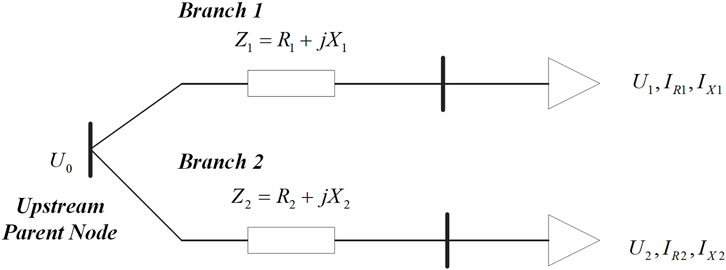
This section considers the calculation of line parameters when some nodes in the power supply network are not equipped with measuring equipment. For example, in the circuit model shown in Figure 3, if the voltage U0 of the upstream node is unknown and the voltage, active power, and reactive power of the terminal parallel node can be measured, the measured data of the terminal node can be relied on.
Impedance Exclusion Model of Low-Voltage Distribution Network
A multiple linear regression equation is established by calculating the voltage drop at the head and end of the circuit, in which ε represents the error at both ends of Eq. 7.
In Eq. 6, U1, U2, IR1, IX1, IR2, and IX2 can be calculated from the measured value. At this time, R1, X1, R2, and X2 to be estimated in the parallel circuit can be regarded as the regression coefficients of the regression equation. By substituting the sampling values at different times in the time series into Eq. 6, the overdetermined equations are formed and solved by least square estimation. If the electrical quantity at the head end of the line is unknown, the regression equation could be constructed according to the measured data of the end parallel node to calculate the line impedance.
After calculating the impedance of the parallel line, the voltage value of the unknown upstream node can be further calculated, as shown in Eq. 8.
Finally, the mean square error between the estimated voltage and the real voltage is calculated to quantify the estimation effect of the voltage, and the calculation formula is shown in Eq. 9.
Case Analysis
In this study, the problems of topology identification and impedance identification under a low-voltage distribution network with limited measurement information are considered, and the physical topology model and impedance model of distribution transformer-branch-meter box-user are established according to the voltage, current, and phase information of all nodes. The establishment and calculation of the model used 64 bit Intel Core i7-8750 Q1BVQDIuMjA= GHz, 16 GB memory computer, Windows 10 Pro, and Python 3.6 (64 bit).
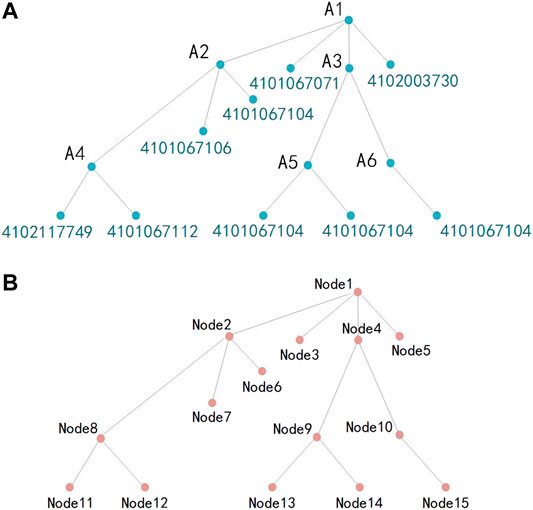
This study uses a branch box wiring structure of an urban station area. The correlation between the voltage measurement data of any two user nodes is calculated by Eq. 1, and the node correlation matrix is formed. Then the topology of the low-voltage distribution network in the urban area can be reconstructed by the maximum spanning tree algorithm. In Figure 4, 1) is the original topology of the urban station area, and 2) is the topology formed after correlation calculation based on the measured data.
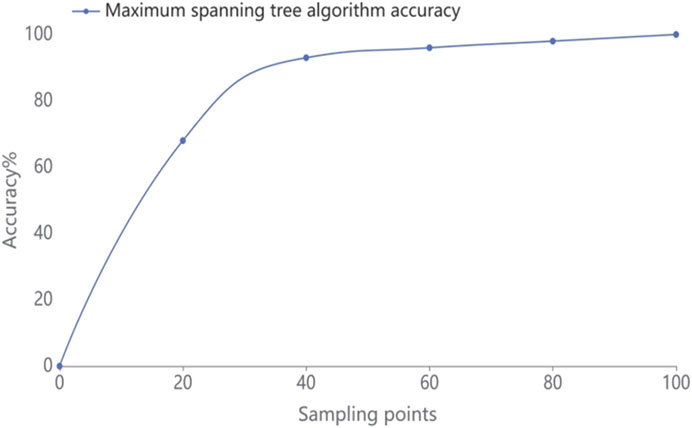
In order to test the sensitivity of the algorithm, we analyzed the data sets with different data lengths in different time periods to get the reconstructed topology, and then we compared it with the actual topology to get the distribution of sampling points by accuracy. From Figure 5, it can be seen that the method proposed in this study can better reconstruct the original topology when there have few measurement data points.
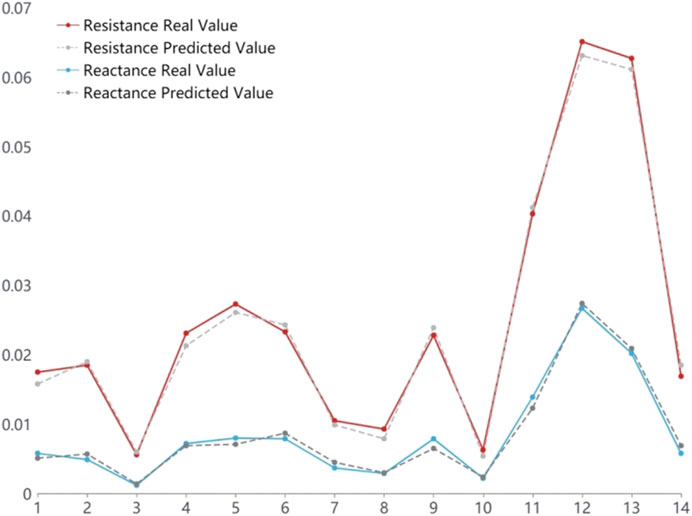
On the basis of identifying the topology of the distribution network, the impedance backtracking identification is carried out according to the impedance exclusion model. After using the model algorithm to calculate the impedance value, we can get Figure 6. It can be seen that the estimated impedance value is similar to the real impedance value. The calculated RMSE value of the estimated impedance value and the real impedance value is 2.27, and the deviation between them is small. So, the proposed method has good estimation effect. Using the line impedance calculation method proposed in this study, the impedance estimation of the low-voltage distribution network can be updated continuously on the basis of calculating the unknown impedance of the line. Therefore, this method can help to realize the online estimation and monitoring of branch node power flow and the subsection calculation of hierarchical line loss.
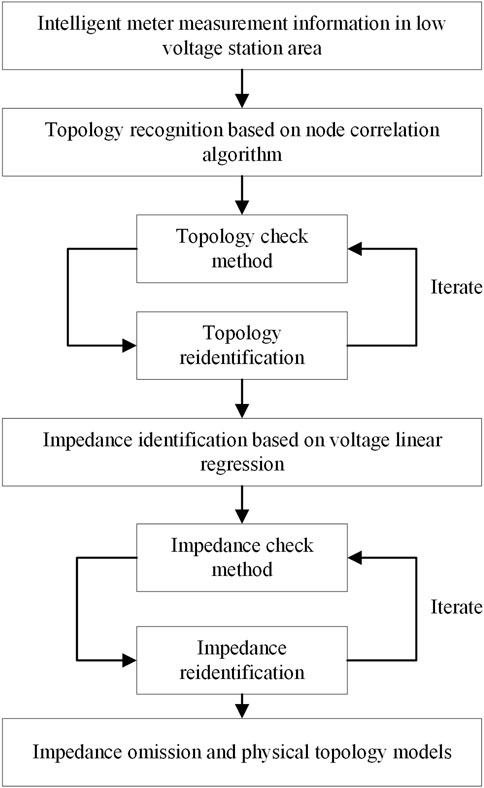
To sum up, the prediction results of the physical topology model of distribution transformer-branch-meter box-user proposed in this study are closest to the actual results, and the topology identification results are relatively accurate and robust. The results show that the model can accurately identify the topology and impedance in the low-voltage distribution network with a large amount of measurement information. It realizes the online perception of the distribution network and provides the basis for the fine management of the power grid and the treatment of line loss. The flow chart of the overall algorithm is shown in Figure 7.
Conclusion
This study proposes a topology and impedance identification method of a low-voltage distribution network by establishing impedance exclusion and physical topology model based on smart meter measurements. First, a simplified typical low-voltage distribution network model with smart meters is constructed, then the voltage correlation coefficient matrix is formed based on the node voltage measurement data sequence, and the Kruskal minimum spanning tree algorithm was introduced to generate the low-voltage distribution network topology. Based on the generated topology structure, the voltage drop model of the distribution network line is proposed, and the impedance identification of the low-voltage distribution network is completed based on the voltage linear regression characteristics. The physical topology model of distribution transformer-branch-meter box-user and the impedance exclusion model are established, and the line loss and branch node power flow are calculated on the basis of the two models. Finally, the low-voltage distribution network topology recognition algorithm and power flow partition backtracking impedance estimation technology are developed based on the data mining method of the distribution transformer terminal and smart meter, online power flow estimation, and monitoring of branch nodes, and the segmented calculation of hierarchical line loss are realized too.
Data Availability Statement
The original contributions presented in the study are included in the article/Supplementary Material, further inquiries can be directed to the corresponding author.
Author Contributions
Manuscript writing: LT and WC; data collection: DW and LT; content and format correction: LT, WC, and DW. All authors have read and agreed to the published version of the manuscript.
Funding
This study received funding from The Science and Technology Project of State Grid Zhejiang Electric Power Co., Ltd. (5211DS200084). The funder was not involved in the study design, collection, analysis, interpretation of data, writing of this article, or the decision to submit it for publication.
Conflict of Interest
Authors LT, WC, and DW were employed by the Electric Power Research Institute of State Grid Zhejiang Electric Power Co., Ltd.
All authors declare that the research was conducted in the absence of any commercial or financial relationships that could be construed as a potential conflict of interest
Publisher’s Note
All claims expressed in this article are solely those of the authors and do not necessarily represent those of their affiliated organizations or those of the publisher, the editors, and the reviewers. Any product that may be evaluated in this article, or claim that may be made by its manufacturer, is not guaranteed or endorsed by the publisher.
References
Coutino, M., Isufi, E., Maehara, T., and Leus, G. (2021). “State-Space Based Network Topology Identification,” in European Signal Processing Conference (EUSIPCO)) (IEEE). doi:10.23919/Eusipco47968.2020.9287692
Fernandez, C., Granda, M., Zumel, P., Sanz, M., Lazaro, A., and Barrado, A. (2018). “Identification System Applied to the Characterization of the Input Impedance of Cascaded Dc-Dc Converters,” in IEEE Workshop on Control and Modeling for Power Electronics (COMPEL) (IEEE). doi:10.1109/COMPEL.2018.8460041
Hasan, H., Mozumdar, M., and Al-Jufout, S. (2020). “Using 0.6 kV/1 kV Low Voltage in Distribution Systems for the Reduction of the Technical and Non-technical Energy Losses,” in International Renewable Energy Congress (IREC) (IEEE). doi:10.1109/IREC48820.2020.9310417
Huang, S., Wu, Q., Liao, W., Wu, G., Li, X., and Wei, J. (2021). Adaptive Droop-Based Hierarchical Optimal Voltage Control Scheme for VSC-HVDC Connected Offshore Wind Farm. IEEE Trans. Ind. Inf. 17, 8165–8176. doi:10.1109/TII.2021.3065375
Kusuma, A. A., Pramana, P. A. A., and Munir, B. S. (2017). “Investigation of Fuse Rail in Low Voltage Switchboard Burn Down in Indonesia Distribution System,” in International Conference on High Voltage Engineering and Power Systems (ICHVEPS) (IEEE). doi:10.1109/ICHVEPS.2017.8225950
Li, C., Molinas, M., Fosso, O. B., Qin, N., and Zhu, L. (2019). “A Data-Driven Approach to Grid Impedance Identification for Impedance-Based Stability Analysis under Different Frequency Ranges,” in IEEE Milan PowerTech (IEEE). doi:10.1109/PTC.2019.8810402
Taiwo, O. P., Tiako, R., and Davidson, I. E. (2017). “Voltage Profile Enhancement in Low Voltage 11/0.4 kV Electric Power Distribution Network Using Dynamic Voltage Restorer under Three Phase Balance Load,” in IEEE AFRICON (IEEE). doi:10.1109/AFRCON.2017.8095617
Wu, H.-Y. (2021). “Finite-Time Topology Identification of Multi-Weighted Coupled Neural Networks with and without Parameter Uncertainties,” in International Conference on Intelligent Human-Machine Systems and Cybernetics (IHMSC). doi:10.1109/IHMSC52134.2021.00023
Xu, C., Lei, Y., and Zou, Y. (2020). “A Method of Low Voltage Topology Identification,” in IEEE Conference on Telecommunications, Optics and Computer Science (TOCS) (IEEE). doi:10.1109/TOCS50858.2020.9339731
Yan, X., Shu, C., and Yanjing, X. (2020). “Fault Location Method for DC Distribution Network Based on Impedance Parameters Identification,” in IEEE 3rd International Conference on Electronics Technology (ICET) (IEEE). doi:10.1109/ICET49382.2020.9119551
Zhang, H., Ma, H., Liu, B., Si, Y., Qian, K., and Fan, Z. (2020). “Identification Strategy Based on Nodes Electrical Distances for Distribution Network Topology,” in IEEE PES Asia-Pacific Power and Energy Engineering Conference (APPEEC) (IEEE). doi:10.1109/APPEEC48164.2020.9220625
Zhang, M., Luan, W., Guo, S., and Wang, P. (2018). “Topology Identification Method of Distribution Network Based on Smart Meter Measurements,” in China International Conference on Electricity Distribution (CICED) (IEEE). doi:10.1109/CICED.2018.8592228
Keywords: low-voltage distribution network, line impedance identification, topology identification, distributed generation, smart meter measurements
Citation: Tong L, Chai W and Wu D (2022) Topology and Impedance Identification Method of Low-Voltage Distribution Network Based on Smart Meter Measurements. Front. Energy Res. 10:895397. doi: 10.3389/fenrg.2022.895397
Received: 13 March 2022; Accepted: 30 March 2022;
Published: 29 April 2022.
Edited by:
Bin Zhou, Hunan University, ChinaCopyright © 2022 Tong, Chai and Wu. This is an open-access article distributed under the terms of the Creative Commons Attribution License (CC BY). The use, distribution or reproduction in other forums is permitted, provided the original author(s) and the copyright owner(s) are credited and that the original publication in this journal is cited, in accordance with accepted academic practice. No use, distribution or reproduction is permitted which does not comply with these terms.
*Correspondence: Li Tong, MTg3NDUxNjk4MUBxcS5jb20=
 Li Tong
 Weijian Chai