 Yujie Wu
 Xianghua Li2,3*
 Luao Zhang
 Wenxin Zhao
 Tao Zhang
95% of researchers rate our articles as excellent or good
Learn more about the work of our research integrity team to safeguard the quality of each article we publish.
Find out more
OPINION article
Front. Energy Res. , 05 May 2022
Sec. Smart Grids
Volume 10 - 2022 | https://doi.org/10.3389/fenrg.2022.893492
This article is part of the Research Topic Advanced AI Applications for Modelling, Optimization, Control, and Planning of Smart Grid View all 39 articles
Due to the continuous advancement of the reform of transmission and distribution prices, higher requirements have been placed on the accuracy of the annual investment plans of power grid enterprises (Bin et al., 2017; He et al., 2018; Lv and Yang, 2020); moreover, the wide application of information tools has also brought new challenges to improve investment management efficiency (Jiang et al., 2019; Sha et al., 2021). However, a literature search revealed few studies on investment management methods for infrastructure projects that satisfy the requirement of high-quality development of power grids. The preparation of annual investment plans within power grid enterprises only relies on manual experience, which is arduous to consider timing characteristics and annual investment laws comprehensively. Consequently, there is an urgent need to possess a research methodology suitable for the deduction of the investment scheduling of power grid projects and explore the inherent laws and characteristics of the investment schedule. This article brings some views on the deduction prediction methodology of power grid projects’ investment schedule considering project properties.
The construction period of the power grid infrastructure project provides a reference for the administrator to determine the deduction prediction for power grid infrastructure investment and planning. The project duration is required to be no less than a reasonable duration. Thus for power grid projects more petite than a reasonable construction period, the minimum value of the reasonable construction period of each voltage level project is taken as the project construction period. The appropriate construction period for the power grid project is 10–19 months for 110 (66) kV projects, 13–22 months for 330 (220) kV projects, 15–24 months for 500 kV, and 16–25 months for 750 kV.
The structure of the BP neural network is usually composed of three or more layers, namely, the input layer, hidden layer, and output layer. The prediction of project duration based on the BP neural network model is divided into the following steps: first, the BP neural network structure is reasonably designed; second, the neural network is trained according to the historical data; and third, the trained neural network is used for prediction. To predict the construction period of a power grid project, we must use historical construction period data. The input layer variables mainly include factors that significantly impact the construction period. Therefore, in the research, the voltage level, construction scale, construction attributes, and region factors of the infrastructure project are taken as the input to the network. The construction scale includes the substation capacity and the line length, the construction attributes consist of the project attributes and the engineering attributes, and the regional characteristic comprises the area where the project is located and whether it is in the urban core area. The data samples need to be normalized before establishing the prediction model, and the normalized data is between 0 and 1.
The historical investment schedule curves data are overwhelmingly large for power grid projects, which are still being enlarged over time (Ma et al., 2018). The key of this research is to fully extract the characteristic factors of the massive historical investment schedule curves, investigate the deduction prediction methodology suitable for the investment schedule of power grid infrastructure projects, and then adjust the investment project library to make up for the shortcomings in the development of power grid. Nevertheless, several studies have documented that most time sequences analysis methods, including clustering algorithms, rely on distance measures. While comparing two investment schedule time sequences, the critical issue is how to deal with distortion, which is characteristic of time sequences. Time sequences data are associated with each other through time characteristics, which are different from ordinary static data. That is, in investment schedule time sequences data, the following data are affected by the previous data. It is paramount to retain the time characteristics of the investment schedule in data analysis and mining.
The traditional method of extracting quintessential investment schedule curves of power grid projects is to manually select a relatively centered and non-distorted corner among all investment schedule curves. However, the method is not universal and has a multitude of errors. In this article, a quintessential investment schedule model of the power grid projects is formulated by introducing the relevant theories and technical means of data mining and considering factors such as voltage level, construction scale, and construction attributes.
Time sequences distance or similarity measure is indispensable in deduction prediction for power grid infrastructure investment and planning, which is one of the standards to measure the similarity between different investment schedule curves and plays a critical role in the time sequences data mining. Similarity measures refer to the common shape in time series, which usually contain the common trend shape or pattern subsequence with common similarity at different time points. Different from Euclidean distance (ED), where distance is measured strictly according to the time sequences values corresponding to the exact moment, Dynamic Time Warping (DTW) exploits the thought of dynamic programming by adjusting the time sequence of the relationships among different moments of the corresponding element to obtain the optimal curve path, along this path of the distance between time sequences is the smallest (Li et al., 2019; Choi et al., 2020; Cai et al., 2021). This algorithm reasonably measures the overall shape similarity among time sequences. In comparison, DTW can better depict the general dynamic characteristics of the curves and applies to the situation where two curves have good overall similarities but are not completely aligned on the time axis. Consequently, it can effectively make up for the deficiency that ED only pours attention into the numerical distribution characteristics of the corresponding moments of the curves when describing the similarity of the investment schedule curves. DTW not only realizes the distance measurement of unequal time sequences but is robust to multiple shortcomings of time sequences. The smaller the DTW distance, the more similar the investment schedule curves. In this article, the abnormal curves of the investment schedule are eliminated with the DTW algorithm.
The distance measured in the classical clustering algorithm K-Means is Euclidean Distance. For the investment schedule curves, it is to calculate the sum of the squares of the investment schedule difference at each moment. This method of only calculating the investment schedule difference in the corresponding dimension cannot capture high-dimensional features, such as changes over time.
Given the defect that the ED of the investment schedule curves of power grid projects is arduous to reflect the high-dimensional characteristics of the curves, the kernel method can be utilized for optimization (Tang et al., 2019), in which the investment schedule curves are nonlinearly mapped into a high-dimensional feature space and then are clustered in the new high-dimensional feature space, increasing the probability of linear separability. Therefore, this clustering algorithm can calculate the distance according to the high-dimensional characteristics of the investment schedule curves, and the effectiveness of clustering is also optimized. However, this process is exceedingly cumbersome if the low-dimensional data is directly mapped to the high-dimensional space through a mapping function, and the calculation is performed in the high-dimensional area. A significant limitation of this approach is determining the kernel function, the data sparsity, and computational complexity.
Some missions in the investment schedule time sequences analysis of power grid projects obtain a set of time sequences depending on the average sequence, which is the basis of the deduction prediction methodology for power grid infrastructure investment. The uncomplicated method of extracting average sequences is to calculate the arithmetic mean of the corresponding coordinates of all sequences, and the K-Means algorithm is adopted. The K-shape algorithm is different from K-Means in calculating the center of clusters and measuring the distance, having the characteristics of high precision and efficiency (Paparrizos and Gravano, 2017). The deduction prediction framework of power grid infrastructure investment and planning based on machine learning is proposed and presented in Figure 1.
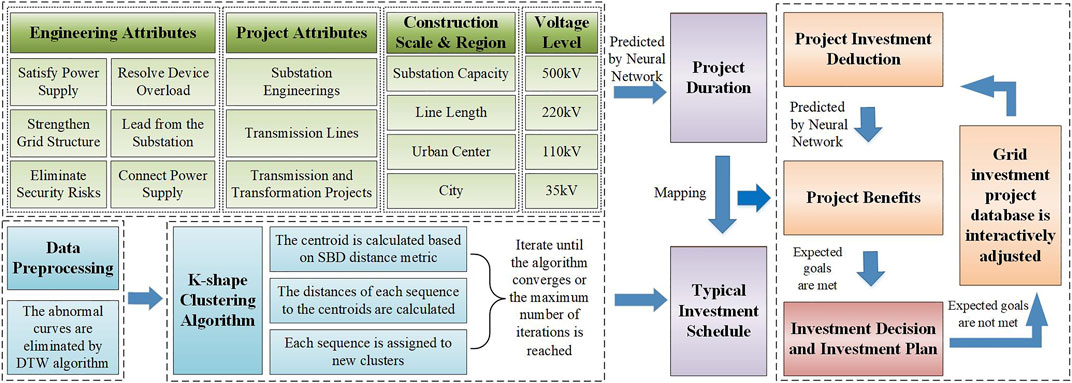
FIGURE 1. Proposed deduction prediction framework of power grid infrastructure investment and planning.
The cluster centroids are calculated by cross-correlation statistics. Cross-correlation is a statistical measure that we can use to determine the similarity of two investment schedule curves. We assume that there are series
where
Here, R is used to calculate the similarity of x and y at each step, and the greater the value of R, the more similar the two sequences are.
Normalized Cross-Correlation (NCC) is used to describe the correlation between two samples, and the value range is (-1, 1). The smaller the NCC value, the less similar the two samples are; the larger the NCC value, the more similar the two samples are. The coefficient normalization is defined as follows:
The smaller the shape-based distance (SBD) value is, the higher the sequence similarity is, and vice versa. The value range of SBD is between 0 and 2, and 0 means that the time sequences are entirely similar. The shape-based distance is defined as follows:
The centroid of the investment schedule curves is also a time sequences line. Here the centroid calculation is regarded as an optimization problem whose goal is to confirm the minimum sum of the squares of distances from other time sequences. Since cross-correlation intuitively captures the similarity, not the incompatibility, the centroid calculation sequence is represented as the maximum square similarity to all other time sequences.
The distance metric and centroid calculation of the K-shape make it significantly better than K-Means. Initially, we randomly assign the input sequences of the investment schedule to clusters and then compute the centroid of each group. Then, the clustering method is achieved by iteration, and each iteration is divided into two steps. In the first step, each investment schedule sequence is compared with all the calculated centroids and is assigned to the cluster with the nearest centroid. The second step is to update the cluster centroids. These two steps are repeated until the algorithm converges or the maximum number of iterations is reached. Through this iterative process, K-shape minimizes the sum of squared distances and manages to generate uniform and well-separated clusters.
According to the estimated put into operation time in the project library, combined with the schedule rules, the milestone plans for construction are scheduled. At the same time, based on the deduction predicted outcomes of the power supply capacity, capacity-load ratio, “N-1”, new energy consumption (Ming et al., 20202020; Husin et al., 2021; Zhang et al., 2022), and other project investment benefits (Spyrou et al., 2017; Chen et al., 2020), the grid investment projects database is interactively adjusted until the expected goals are met, and the project investment plans are obtained. Here, BP neural network is also used for prediction, with project properties as the input and investment benefits as the output.
The deduction of the investment schedule of power grid projects is a complex task with extensive data, heavy workload, and high technical requirements. Primary project information data such as voltage level, construction scale, construction attributions, and location are imported for the neural network to predict the project duration. Then the quintessential investment schedule curves are obtained by clustering the historical investment schedule curves with the K-shape algorithm. Finally, the investment schedule curve of the selected projects in the next year is mapped to the quintessential investment schedule curve of the corresponding category through the construction period.
Power grid projects are characterized by significant investments, long construction periods, and large reserve quantities. Scientific and practical deduction prediction methodology for power grid infrastructure investment and planning can help the company to reasonably arrange the power grid project library and investment allocation plan, improve the company’s construction investment efficiency, and play a crucial role in ensuring the steady development of power grid and promoting the company’s investment planning and construction process.
Writing the original draft and editing: YW. Conceptualization: XL. Formal analysis: LZ and CL. Visualization and contribution to the discussion of the topic: WZ and TZ.
This work was supported by the State Grid Science and Technology Project (No.5100-202123009A).
XL and CL were employed by the State Grid Hunan Electric Power Company Limited Economic & Technical Research Institute.
The remaining authors declare that the research was conducted in the absence of any commercial or financial relationships that could be construed as a potential conflict of interest.
All claims expressed in this article are solely those of the authors and do not necessarily represent those of their affiliated organizations, or those of the publisher, the editors, and the reviewers. Any product that may be evaluated in this article, or claim that may be made by its manufacturer, is not guaranteed or endorsed by the publisher.
Bin, Y., Bao, W., Dun-nan, L., and Ming-guang, L. (2017). “Research on the Reasonable Investment Scale Measurement of Power Grid Based on the Reform of Transmission and Distribution price,” in 2017 IEEE 3rd Information Technology and Mechatronics Engineering Conference (Chongqing, China: ITOEC), 754–757. doi:10.1109/ITOEC.2017.8122452
Cai, B., Huang, G., Samadiani, N., Li, G., and Chi, C.-H. (2021). Efficient Time Series Clustering by Minimizing Dynamic Time Warping Utilization. IEEE Access 9, 46589–46599. doi:10.1109/ACCESS.2021.3067833
Chen, Y., Li, J., Sheng, K., Yang, T., Xu, X., Han, Z., et al. (2020). Many-criteria Evaluation of Infrastructure Investment Priorities for Distribution Network Planning. IEEE Access 8, 221111–221118. doi:10.1109/ACCESS.2020.3043248
Choi, W., Cho, J., Lee, S., and Jung, Y. (2020). Fast Constrained Dynamic Time Warping for Similarity Measure of Time Series Data. IEEE Access 8, 222841–222858. doi:10.1109/ACCESS.2020.3043839
He, Y. X., Jiao, J., Chen, R. J., and Shu, H. (2018). The Optimization of Chinese Power Grid Investment Based on Transmission and Distribution Tariff Policy: A System Dynamics Approach. Energy Policy 113, 112–122. doi:10.1016/j.enpol.2017.10.062
Husin, H., Erdiwansyah, E., Mahidin, M., Nasaruddin, N., Zaki, M., and Muhibbuddin, M. (2021). A Critical Review of the Integration of Renewable Energy Sources with Various Technologies. Prot. Control. Mod. Power Syst. 6 (1), 37–54. doi:10.1186/s41601-021-00181-3
Jiang, Q., Huang, R., Huang, Y., Chen, S., He, Y., Lan, L., et al. (2019). Application of BP Neural Network Based on Genetic Algorithm Optimization in Evaluation of Power Grid Investment Risk. IEEE Access 7, 154827–154835. doi:10.1109/ACCESS.2019.2944609
Li, D., Zhao, Y., and Li, Y. (2019). Time-series Representation and Clustering Approaches for Sharing Bike Usage Mining. IEEE Access 7, 177856–177863. doi:10.1109/ACCESS.2019.2958378
Lv, Y., and Yang, X. (2020). “Research on Grid Precision Investment Strategy of Grid Companies Considering Multidimensional Economic and Social Factors,” in 2020 IEEE 9th Joint International Information Technology and Artificial Intelligence Conference (Chongqing, China: ITAIC), 128–132. doi:10.1109/ITAIC49862.2020.9339176
Ma, R., Liu, Y., Xian, Q., Cheng, Q., Luo, Y., and Cheng, C. (2018). “Progress Evaluation of Power Grid Projects Based on Investment, Construction, and Costs Accounting Progress,” in 2018 2nd IEEE Conference on Energy Internet and Energy System Integration (EI2), 1–4. doi:10.1109/EI2.2018.8582369
Ming, H., Xia, B., Lee, K. Y., Adepoju, A., Shakkottai, S., and Xie, L. (20202020). Prediction and Assessment of Demand Response Potential with Coupon Incentives in Highly Renewable Power Systems. Prot. Control. Mod. Power Syst. 5 (1), 1–14. doi:10.1186/s41601-020-00155-x
Paparrizos, J., and Gravano, L. (2017). Fast and Accurate Time-Series Clustering. ACM Trans. Database Syst. 42 (2), 1–49. doi:10.1145/3044711
Sha, Y., Li, W., Yan, J., Li, W., and Huang, X. (2021). Research on Investment Scale Calculation and Accurate Management of Power Grid Projects Based on Three-Level Strategy. IEEE Access 9, 67176–67185. doi:10.1109/ACCESS.2021.3077481
Spyrou, E., Ho, J. L., Hobbs, B. F., Johnson, R. M., and McCalley, J. D. (2017). What Are the Benefits of Co-optimizing Transmission and Generation Investment? Eastern Interconnection Case Study. IEEE Trans. Power Syst. 32 (6), 4265–4277. doi:10.1109/TPWRS.2017.2660249
Tang, Y., Xie, Y., Yang, X., Niu, J., and Zhang, W. (2019). Tensor Multi-Elastic Kernel Self-Paced Learning for Time Series Clustering. IEEE Trans. Knowl. Data Eng. 33 (3), 1. doi:10.1109/TKDE.2019.2937027
Keywords: deduction prediction, project duration, investment schedule, cluster analysis, investment management
Citation: Wu Y, Li X, Zhang L, Liu C, Zhao W and Zhang T (2022) Machine Learning–Driven Deduction Prediction Methodology for Power Grid Infrastructure Investment and Planning. Front. Energy Res. 10:893492. doi: 10.3389/fenrg.2022.893492
Received: 10 March 2022; Accepted: 08 April 2022;
Published: 05 May 2022.
Edited by:
Bo Yang, Kunming University of Science and Technology, ChinaCopyright © 2022 Wu, Li, Zhang, Liu, Zhao and Zhang. This is an open-access article distributed under the terms of the Creative Commons Attribution License (CC BY). The use, distribution or reproduction in other forums is permitted, provided the original author(s) and the copyright owner(s) are credited and that the original publication in this journal is cited, in accordance with accepted academic practice. No use, distribution or reproduction is permitted which does not comply with these terms.
*Correspondence: Xianghua Li, eGhMaTk4NzMyMUAxNjMuY29t; Yujie Wu, MzQ1NTgwMjMwNEBxcS5jb20=
Disclaimer: All claims expressed in this article are solely those of the authors and do not necessarily represent those of their affiliated organizations, or those of the publisher, the editors and the reviewers. Any product that may be evaluated in this article or claim that may be made by its manufacturer is not guaranteed or endorsed by the publisher.
Research integrity at Frontiers
Learn more about the work of our research integrity team to safeguard the quality of each article we publish.