
95% of researchers rate our articles as excellent or good
Learn more about the work of our research integrity team to safeguard the quality of each article we publish.
Find out more
ORIGINAL RESEARCH article
Front. Energy Res. , 04 May 2022
Sec. Advanced Clean Fuel Technologies
Volume 10 - 2022 | https://doi.org/10.3389/fenrg.2022.892622
This article is part of the Research Topic Recent Advances in High-efficiency Development of Conventional/Unconventional Gas Reservoirs and CCUS Technologies View all 51 articles
Rapid and effective identification of interwell fracture-cavity composite structures is a necessary prerequisite for a detailed and in-depth understanding of interwell connectivity in fracture-cavity reservoirs. Current identification methods and technologies have the problems of being large-scale and low-resolution; in view of these problems, a method is proposed for rapidly identifying interwell fracture-cavity combination structures using tracer-curve morphological characteristics (peak number and characteristics of two wings). Based on concentration models of tracer curves for an interwell single fracture/pipe/cavity, the morphological characteristics of tracer curves were researched in five different series-parallel combination modes consisting of fractures, pipes, and cavities. The tracer curves of fracture-cavity reservoirs are categorized into three types: single sharp peak, single slow peak, and multipeak. Furthermore, a matching relationship between different fracture-cavity combination structures and the morphological characteristics of tracer curves is clarified. The single-sharp-peak curve with basically symmetrical wings reflects that of an interwell single fracture/pipe; the single-slow-peak curve with a steep ascending branch and a slow descending branch (obvious trailing phenomenon) reflects that of an interwell single cavity or fracture/pipe series cavity; the multipeak curve reflects that of an interwell multifracture/pipe/cavity in parallel; according to the flow difference of each branch flow channel, they can be divided into independent multipeak and continuous multipeak forms. Taking tracer monitoring results from a well group in the Tahe oilfield as an example, field application analysis and verification were carried out. The results show that this method is simple and reliable and can provide a fast and effective means for identifying interwell fracture-cavity combination structures. Meanwhile, the research results can lay a foundation for quantitative interpretation modeling of interwell tracers in fracture-cavity reservoirs considering fracture-cavity configuration.
Fracture-cavity carbonate reservoirs are an important petroleum resource globally. The Ordovician reservoir in China’s Tahe oilfield is a prime example; it has abundant reserves, accounting for about two-thirds of the proven reserves of carbonate reservoirs in China (Huang et al., 2017; Dai et al., 2018; Li et al., 2018). Compared with sandstone reservoirs, the reservoir space of fracture-cavity reservoirs is a complex system of voids, caverns, pipes, and fractures, with variable scale, intertwined space, and various forms of connectivity. Fractures and pipes are the main channels of oil and water flow, and these reservoirs are highly heterogeneous and difficult to develop (Liu et al., 2006; Huang et al., 2017; Jiao, 2019; Sheng et al., 2019; Liu et al., 2021). The main methods to improve oil recovery from fracture-cavity reservoirs have become water injection of a single well to replace oil, water injection of a fracture-vuggy unit to drive oil, nitrogen injection, foam flooding, and other development methods fracture-cavity (Farhadinia et al., 2011; Lyu et al., 2017; Su et al., 2017; Yue et al., 2018a; Hou et al., 2018; Sheng et al., 2019; Zheng et al., 2019). With the expanded development of fracture-cavity reservoirs, the identification of fractures and caverns has shifted from macroscopical division of fracture-cavity units to detailed identification and characterization of interwell fracture-cavity composite structures to meet the needs of water/gas injection formulation, flow-channel adjustment, and other programs for tapping potential (Trice and C Reservoirs Ltd, 2005; Dittaro et al., 2007; Shbair et al., 2017; Alaa et al., 2018).
The characteristics of fracture-cavity reservoirs can be revealed by various monitoring data acquired from different angles, but the degree of reflection is variable, and these monitoring techniques often have certain limitations. Common monitoring data used to identify fractures or cavities, such as seismic, coring, conventional logging, image logging, drilling, and well testing, show large-scale and low-resolution results, or they only show results near a single well (Dittaro et al., 2007; Corbett et al., 2010; Wang et al., 2013; Shbair et al., 2017; Alaa et al., 2018; Wan et al., 2018; Lai et al., 2019; Tian et al., 2019; Wei et al., 2019). Dynamic production data can only be used to analyze interwell connectivity, and it is difficult to identify interwell fracture-cavity composite structures (Gazi et al., 2012; Zhao, 2017; Al- Obathani et al., 2018; Yue et al., 2018b). In recent years, integration of various monitoring data has made an effective way for comprehensive identification and reliable analysis of fracture-cavity characteristics in these reservoirs (Parra and Parra, 2012; Liu et al., 2015; Shekhar et al., 2019).
Interwell tracer technology is important for intuitively describing interwell characteristics. The tracer is transported along the channel with the injected fluid, and the tracer flow is consistent with the flow path of the injected fluid. The concentration of tracers in the produced fluid is monitored continuously to display the characteristics of interwell flow channels. Interwell tracer–monitoring technology has significant advantages over other monitoring methods (Leong et al., 2015; Sanni et al., 2017; Tayyib et al., 2019). Interwell tracer technology is widely applied in fracture-cavity reservoirs, and it is commonly used to determine injection-production well connectivity (Li et al., 2008; Xie et al., 2008; Zhou et al., 2015).
For the identification of interwell fracture-cavity composite structures using tracers, most research has been based on laboratory experiments. By performing small physical simulation experiments of different fracture-cavity combination structures, researchers have been able to analyze morphological characteristics of the tracer output concentration curve (Rong et al., 2016; Yang et al., 2018). Obviously, for a large-scale, interwell fracture-cavity combination structure, experimental laboratory results have some limitations and differences compared to the field application of a fracture-cavity reservoir. For example, the tracer-curve morphology for a combined structure of underground river-pipe obtained using large-scale groundwater karst tracing is different from that of an indoor, fracture-cavity combined structure under the same conditions (Rong et al., 2016; Ji et al., 2017; Zhao et al., 2017; Yang et al., 2018).
In terms of theoretical modeling, because of the extreme complexity and changeability of interwell fracture-cavity combination structures, tracer production concentration curves have various shapes (single peak, multipeak, sharp peak, and slow peak) (Li et al., 2008; Xie et al., 2008; Zhou et al., 2015), and the interwell fracture-cavity combination bodies are often simplified and equivalent to pipe or flow pipe, without considering the combination relationship and flow differences among pipes, fractures, and cavities. The established interpretation model has also been used to fit the tracer curve to realize so-called quantitative interpretation and evaluation. The parameters obtained are usually general, such as equivalent fracture-cavity volume (Morales et al., 2006; Li et al., 2008; Xie et al., 2008; Luhmann et al., 2012; Borghi et al., 2016; Dewaide et al., 2016; Zhang et al., 2016), which cannot reflect the interwell fracture-cavity parameters realistically—meaning that interwell fracture-cavity combination structures cannot be identified.
Therefore, by mathematically modeling tracer concentration output and curve characteristics of an interwell single fracture, interwell single pipe, and interwell single cavity, tracer concentration mathematical models of five fracture-cavity combination structures were established in this work, namely a fracture/pipe series cavity and multifracture/multipipe parallel. Based on a sensitivity analysis of relevant parameters, a matching relationship was theoretically clarified between different fracture-cavity combination structures and the shape characteristics of tracer curves, and analysis and verification were carried out by an oilfield case study. The research results can provide a simple and effective method for the identification of interwell fracture-cavity structures, as well as lay a foundation for quantitative interpretation modeling of interwell tracing in fracture-cavity reservoirs based on a fracture-cavity configuration.
The flow and transport characteristics of tracers in fracture, pipe, and cave media are different. Fractures and pipes are essentially flow channels with different shapes of cross-section, and the migration of tracers in fractures and pipes basically conforms to the one-dimensional (1D) convection-diffusion equation (Jing et al., 2016a; Pu et al., 2016). Compared with fracture and pipe media, the scale of the cavity is larger and the flow is low-resistance. In this case, the tracer migration is mainly slow diffusion, which is different from the tracer migration characteristics in fractures and pipes where convection is dominant. This section presents a mathematical model and curve characteristics of tracer slug migration in a single parallel-plate fracture, a single pipe with a constant diameter, and a single cavity with an equipotential body.
Figure 1 shows a physical model of a single parallel-plate fracture within one injection-production well. Fracture length was assumed to be l, fracture width was assumed to be b, and fracture height was assumed to be h.
The output concentration of a certain tracer slug can be obtained from the analytical solution of the 1D convection-diffusion equation with a definite tracer concentration boundary (Jing et al., 2016a):
where C(t) is the output concentration of the tracer at time t, mg/L; C0 is the concentration of the injected tracer slug, mg/L; ∆l is the tracer slug size (ratio of the injected volume of tracer slug Vd to flow-channel cross-sectional area A), m; l is the length of the flow channel where the tracer is transported, m;
Because the tracer follows the movement of the injected fluid, its average migration velocity can be obtained from the flow formula for a parallel-plate fracture:
where b is the fracture width, μm; μ is the hydrodynamic viscosity, mPas; and ∆P is the pressure difference at both ends of the fracture, MPa.
By substituting Eq. 2 into the relevant parameters of Eq. 1, the equation for tracer output concentration for an interwell single fracture can be obtained through dimensional analysis and unit conversion:
where Vd is the injected volume of the tracer slug, m3; h is the fracture height, m; and α is the tracer diffusion constant, m.
In order to illustrate the characteristics of the tracer output concentration curve for an interwell single fracture, C0 was considered to be 0.5 mg/L, Vd was considered to be 5 m3, and α was considered to be 5 m. Eq. 3 was used to analyze the influence of four parameters—l, b, h, and ∆P—on the tracer-curve characteristics of an interwell single fracture (Figure 2).
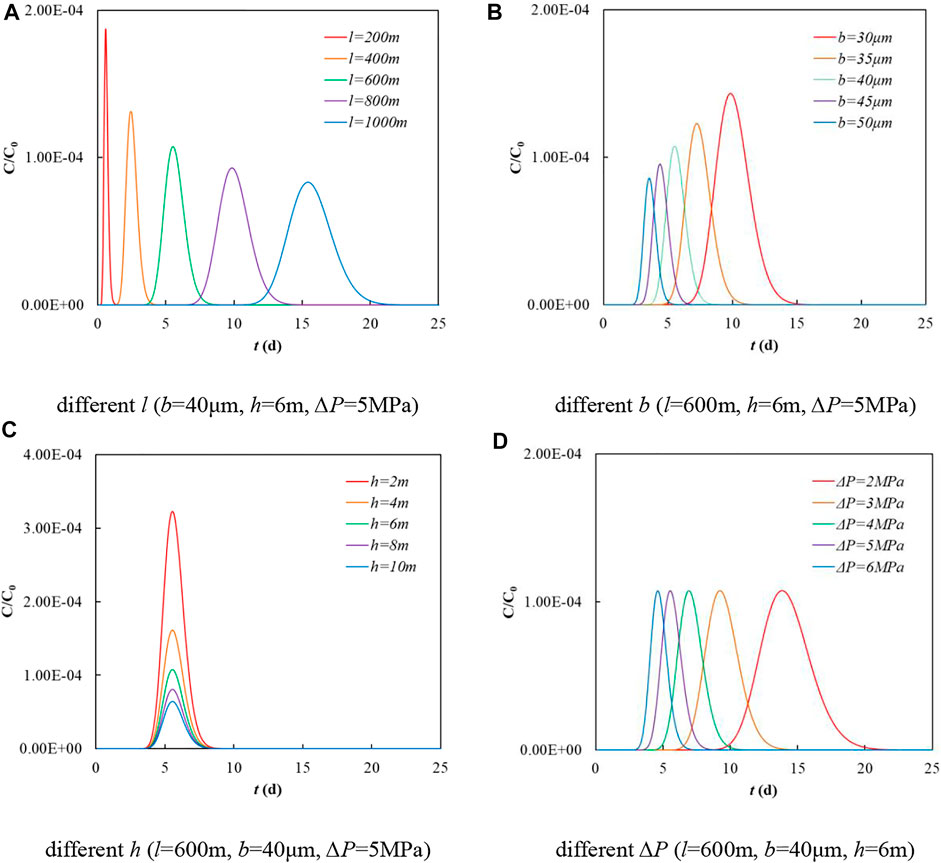
FIGURE 2. Tracer output curve of interwell single fracture under different parameters. (A) different l (b=40 μm, h=6 m, ∆P=5 MPa) (B) different b (l=600 m, h=6 m, ∆P=5 MPa) (C) different h (l=600 m, b=40 μm, ∆P=5 MPa) (D) different ∆P (l=600 m, b=40 μm, h=6 m).
As can be seen from Figure 2, the tracer output concentration curve for the interwell single fracture is a single-sharp-peak curve with basic symmetry between ascending and descending branches. Parameters l and b have effects on the peak value, peak time, and bandwidth of the tracer curve; h only affects the peak value; and ∆P affects the peak time and bandwidth, but has no effect on the peak value.
Figure 3 shows a physical model of a single pipe within one injection-production well. Pipe length was assumed to be l, and the equivalent diameter of the pipe was assumed to be D.
Similar to the single fracture, the tracer migration in a single pipe also follows Eq. 1, but the expression of its average velocity is different. The average velocity of the Hagen-Poiseuille equation under the condition of steady flow can be expressed as:
By substituting Eq. 4 into the relevant parameters of Eq. 1, the equation of tracer output concentration for an interwell single pipe can be obtained through dimensional analysis and unit conversion:
Similar to the single fracture, C0 was considered 0.5 mg/L, Vd was considered 5 m3, and α was considered 5 m. The influences of l, D, and ∆P on the output concentration curve of an interwell single pipe were analyzed (Figure 4).
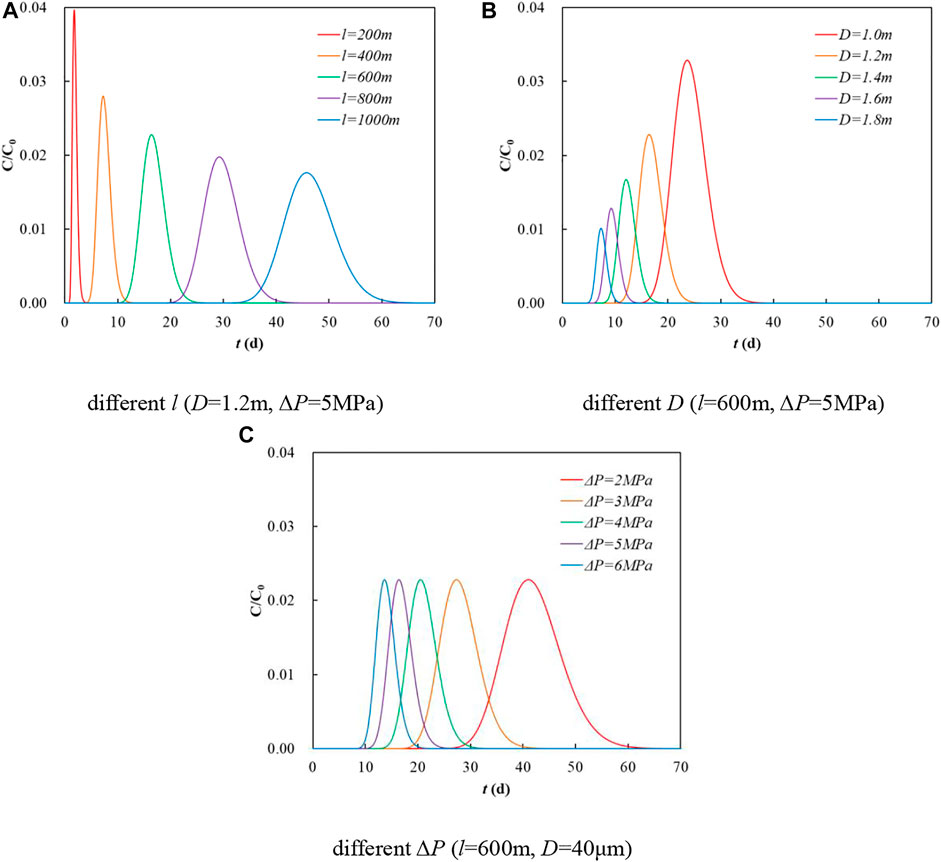
FIGURE 4. Tracer output curve of interwell single pipe under different parameters. (A) different l (D=1.2 m, ∆P=5 MPa) (B) different D (l=600 m, ∆P=5 MPa) (C) different ∆P (l=600 m, D=40 μm).
As can be seen from Figure 4, the tracer output concentration curve of the interwell single pipe is a single-sharp-peak curve with basic symmetry between ascending and descending branches. Parameters l and D have effects on the peak value, peak time, and bandwidth of the tracer curve, while ∆P affects the peak time, but has no effect on the peak value and bandwidth.
Figure 5 shows a physical model of a single cavity within one injection-production well. Given the large scale of the cavity, the fluid reaches equilibrium quickly, so the concrete form of the fluid flow was not considered, but was regarded as an equipotential body. The tracer migration in the cavity is dominated by slow diffusion.
Assuming that the output concentration of the tracer is equal to the average concentration in the cavity, it can be deduced according to the tracer equilibrium relationship:
Eq. 6 can be solved to obtain the analytical solution of tracer output concentration of the cavity:
where Cin(t) is the tracer concentration at the entrance of the cavity at time t, mg/L; and
Compared with the whole time of tracer monitoring, tracer slug injection can be regarded as instantaneous. The tracer concentration of the cavity entrance is C0, which is the constant concentration of the injected tracer slug. Residence time
In order to illustrate the characteristics of the tracer output concentration curve of an interwell single cavity, C0 was 500 mg/L and Vd was 0.05 m3. The influences of Vc and Q on the output concentration curve of the interwell single cavity were analyzed (Figure 6).
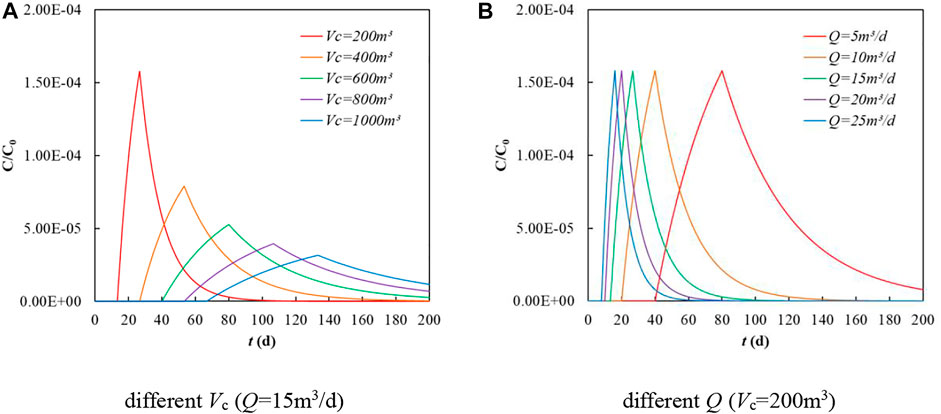
FIGURE 6. Tracer output curve of interwell single cavity under different parameters. (A) different Vc (Q=15 m3/d) (B) different Q (Vc=200 m3).
As can be seen from Figure 6, the tracer output concentration curve of the interwell single cavity is a single-peak curve with clearly asymmetrical wings. The ascending branch is steep, and the descending branch is slow, with an obvious trailing phenomenon. Vc has an effect on the peak, peak time, and bandwidth of the tracer curve. The greater Vc is, the much blunter the tracer curve is. Q affects the peak time and bandwidth, but has no effect on the peak value.
Noteworthily, the related parameters of the interwell fracture, pipe, and cavity have a great influence on the peak value, peak time, and bandwidth of the single-peak curve of the tracer, so it is not suitable to identify the interwell fracture-cavity combination structure by the peak value, peak time, or bandwidth.
It is worth noting that the tracer curve type of multiple series cavity is consistent with that of a single cavity, and multiple series cavity is equivalent to a large volume cavity. Therefore, the section only considers the tracer curve characteristics of single cavity in fracture/pipe series, and the morphological characteristics of tracer curve of single cavity in multi-cavity series can be referred to.
The difficulty with the tracer production model of an interwell fracture/pipe series cavity is that the concentration at the input of the cavity and fracture/pipe downstream of the cavity is a time-varying concentration boundary rather than a constant concentration. The output concentration of the fracture/pipe at the upstream of the cavity is the input concentration of the cavity, and the output concentration of the cavity is the input concentration of the fracture/pipe at the downstream of the cavity. Therefore, the superposition principle was adopted to decompose the linear differential equation and the linear definite solution condition into several definite solution problems to solve the problem of tracer output concentration at the variable concentration boundary.
Figure 7 shows a physical model of a fracture series cavity within one injection-production well. The entrance and exit of the cavity are connected with a plate fracture with length l, width b, and height h.
In order to simulate the tracer response curve, the water-flow formula for a parallel-plate fracture was used to express ∆P in the tracer output concentration [Eq. 3] of an interwell single fracture as flow rate Q; then:
where CF(t) is the tracer output concentration of the fracture upstream of the cavity at time t, mg/L.
CF(t) is Cin(t) in Eq. 7. By substituting Eq. 9 into Eq. 7 and solving the equation, the tracer output equation of the cavity can be obtained:
where:
The tracer output concentration equation of the fracture under a constant concentration boundary is as follows:
In Eq. 11, C0 is the tracer output concentration (variable concentration) of the cavity. According to the superposition principle, the tracer output equation of the fracture series cavity can be obtained:
where j = 1, 2, …, n; and Cc(t) is the tracer concentration at the cavity outlet at time t.
Considering the residence time of the tracer in different space migrations, the tracer output concentration curve for the interwell fracture series cavity should be shifted to the right by l/v +
In order to illustrate the characteristics of the tracer output concentration curve of the interwell fracture series cavity, C0 was 500 mg/L, Vd was 0.05 m3, and α was 5 m. The influences of b, l, Vc, and Q on the tracer curve were analyzed (Figure 8).
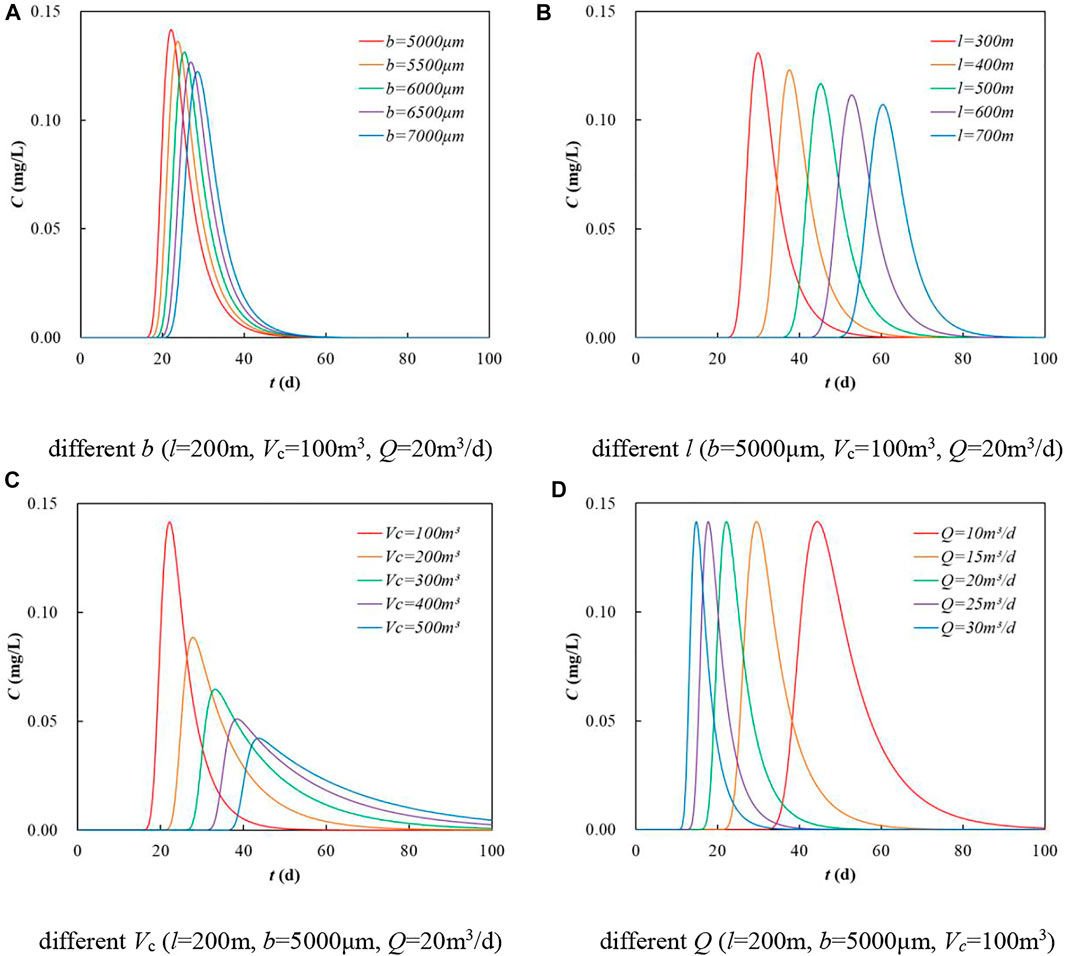
FIGURE 8. Tracer output curve of interwell fracture series cavity under different parameters. (A) different b (l=200 m, Vc=100 m3, Q=20 m3/d) (B) different l (b=5000 μm, Vc=100 m3, Q=20 m3/d) (C) different Vc (l=200 m, b=5000 μm, Q=20 m3/d) (D) different Q (l=200 m, b=5000 μm, Vc=100 m3).
As can be seen from Figure 8, the tracer output concentration curve of the interwell fracture series cavity is a single-peak curve with clearly asymmetrical wings. The ascending branch is steep, and the descending branch is slow, with an obvious trailing phenomenon. Parameters b, l, and Vc all have an effect on the peak value, peak time, and bandwidth of the tracer curve, while Q affects the peak time and bandwidth, but not the peak value; these characteristics are similar to the tracer curve of the interwell single cavity.
Figure 9 shows a physical model of a pipe series cavity within one injection-production well. The entrance and exit of the cavity are connected with a pipe with length l and equivalent diameter D.
The derivation process for the tracer output equation of the pipe series cavity is the same as that for the fracture series cavity. Firstly, the Hagen-Poiseuille equation was used to represent ∆P in the tracer output concentration [Eq. 5] of the interwell single pipe as flow Q to get the tracer output equation of the pipe at the upstream of the cavity. Then, the tracer output equation of the cavity was deduced by applying Eq. 7. Finally, according to the superposition principle, the tracer output equation for the pipe series cavity was deduced the same as Eq. 10 and Eq. 12, except for the expressions of β, γ, η, and ω in the equation being different:
Similarly, the tracer output concentration curve of the interwell pipe series cavity should be shifted to the right by l/v +
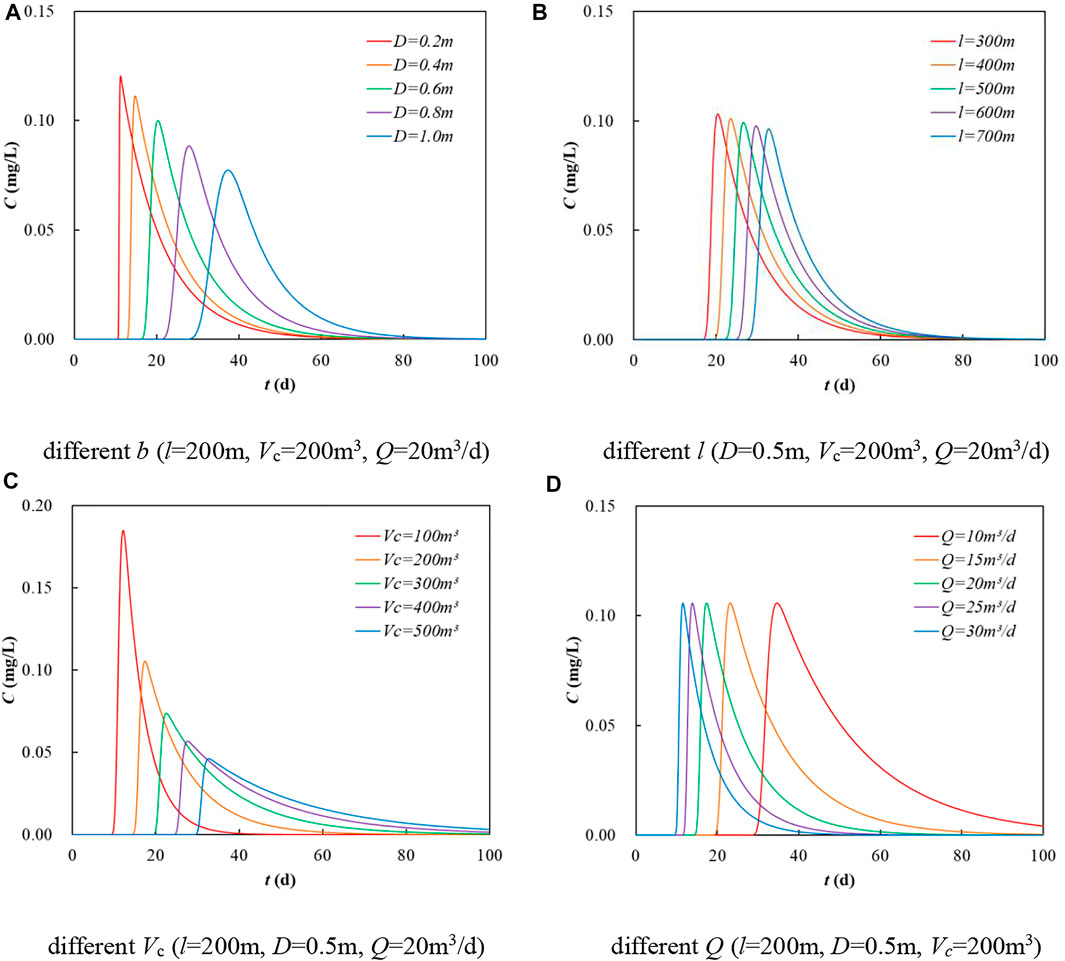
FIGURE 10. Tracer output curve of interwell pipe series cavity under different parameters. (A) different b (l=200 m, Vc=200 m3, Q=20 m3/d) (B) different l (D=0.5 m, Vc=200 m3, Q=20 m3/d) (C) different Vc (l=200 m, D=0.5 m, Q=20 m3/d) (D) different Q (l=200 m, D=0.5 m, Vc=200 m3).
As can be seen from Figure 10, the tracer output concentration curve of the interwell pipe series cavity is a single-peak curve with clearly asymmetrical wings. The ascending branch is steep, and the descending branch is slow, with an obvious trailing phenomenon. Parameters D, l, and Vc all have an effect on the peak value, peak time, and bandwidth of the tracer curve, while Q affects the peak time and bandwidth, but not the peak value; these characteristics are similar to those of the tracer curve of the interwell fracture series cavity.
The tracer output concentration of an interwell multifracture/multipipe/multicavity in parallel should be the superposition of the concentration of each branch flow channel at the production well (Jing et al., 2016b), which can be deduced according to the tracer output model of a single fracture, single pipe, and single cavity, and the morphological characteristics of the tracer curve can be analyzed.
Figure 11 shows a physical model of a multifracture in parallel within one injection-production well (taking three fractures as an example). Assuming N branch fractures, branch fracture i has length li, width bi, and height hi.
After tracer slug injection, the slug is distributed to each branch fracture in a certain proportion. The flow and the volume of tracer slug distributed to each fracture are different, and the reciprocal of the flow resistance of each fracture can be used for splitting. Flow resistance Ri of fracture i can be expressed as (Jing et al., 2016b):
where qi is the flow of fracture i, m3/d.
Then, the equation of tracer output concentration of fracture i is:
where QF is the total flow of the multifracture in parallel, m3/d. Splitting coefficient Ti of fracture i is defined as:
The tracer output concentration of an interwell multifracture in parallel should be the superposition of the output concentration of each fracture at the producing well:
Therefore, the output tracer concentration equation for the multifracture in parallel was obtained as follows:
In order to illustrate the characteristics of the tracer output concentration curve of the interwell multifracture in parallel, C0 was 500 mg/L, Vd was 0.05 m3, QF was 20 m3, hi was 5 m, and α was 1 m. The characteristics of the tracer output concentration curve under different combinations of N (values of 2, 3, 4, and 5), li (values of 200, 300, 400, 500, and 600 m), and bi (values of 5,000, 5,300, 5,600, 5,900, and 6,200 μm) were analyzed (Figure 12).
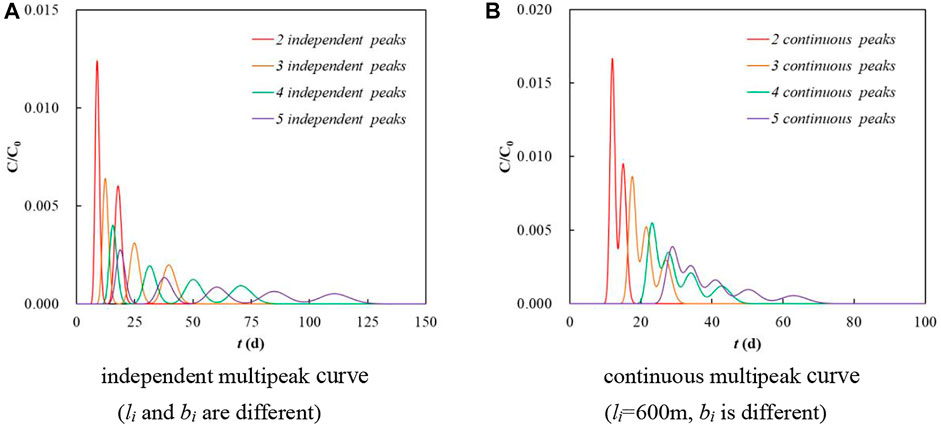
FIGURE 12. Tracer output curve of interwell multifracture in parallel under different parameters. (A) independent multipeak curve (li and bi are different) (B) continuous multipeak curve (li=600 m, bi is different).
As can be seen from Figure 12, the tracer output concentration curve of the interwell multifracture in parallel can be divided into an independent multipeak curve and a continuous multipeak curve, showing a curve with multiple peaks and the two wings of each peak (ascending branch and descending branch) being basically symmetrical. The longer the fracture length, the larger the corresponding fracture width and the greater the difference in flow among the fractures, resulting in the obvious independent peak of each fracture; importantly, the curve shows a relatively independent multipeak shape (Figure 12A). The length of each fracture is the same, but the corresponding fracture width is slightly different. There is little difference in the flow and migration rate of the tracer in each fracture, resulting in the tracer peak of each fracture arriving successively, with the difference in arrival time being small. Therefore, the tracer curve shows a relatively continuous multipeak shape (Figure 12B).
Figure 13 shows a physical model of a multipipe in parallel within one injection-production well (taking three pipes as an example). Assuming N branch pipes, branch pipe i is described by length li and equivalent diameter Di.
The derivation of the tracer output concentration equation for the multipipe in parallel is the same as that for the multifracture in parallel, and its concentration should be the superposition of the output concentration of each fracture at the producing well:
where Qp is the total flow of the multipipe in parallel, m3/d. Splitting coefficient Ti of pipe i is defined as:
In order to illustrate the characteristics of the tracer output concentration curve of the interwell multipipe in parallel, C0 was 500 mg/L, Vd was 0.05 m3, Qp was 20 m3, and α was 1 m. The characteristics of the tracer output concentration curve under different combinations of N (values of 2, 3, 4, and 5), li (values of 200, 300, 400, 500, and 600 m), and Di (values of 0.80, 0.85, 0.90, 0.95, and 1.00 m) were analyzed (Figure 14).
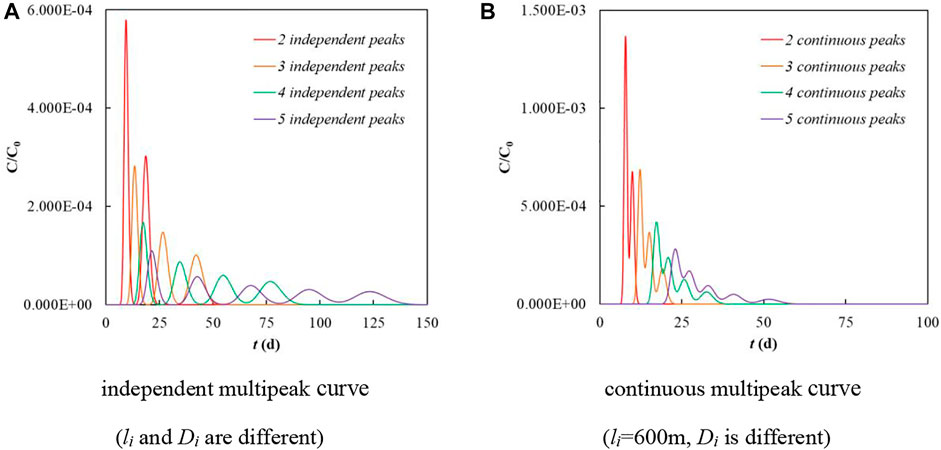
FIGURE 14. Tracer output curve of interwell multifracture in parallel under different parameters. (A) independent multipeak curve (li and Di are different) (B) continuous multipeak curve (li=600 m, Di is different).
As can be seen from Figure 14, the tracer output concentration curve of the interwell multipipe in parallel can be divided into a multipeak curve and a continuous multipeak curve, showing a curve with multiple peaks with the two wings of each peak (ascending branch and descending branch) being basically symmetrical. Similar to the multifracture in parallel, there is a large flow difference between the pipes, and the tracer concentration curve shows a relatively independent multipeak shape (Figure 14A). The flow difference between the pipes is small, and the tracer concentration curve shows a relatively continuous multipeak shape (Figure 14B).
Figure 15 shows a physical model of a multicavity in parallel within one injection-production well (taking three parallel pipes containing cavities as an example). Assuming N flow channels in parallel, the volume of the cavity on the i parallel branch is Vci, the pipe length is li (the pipe length on both sides of the cavity is the same), and the equivalent diameter of the pipe is Di (the pipe equivalent diameter on both sides of the cavity is the same).
According to Eq. 12, the tracer output concentration equation of the i parallel branch can be obtained as follows:
Cci can be expressed by Eq. 10, but the expressions of β, γ, η, and ω in the equation are different:
where Qc is the total flow of the multicavity in parallel, m3/d. Ti is expressed by Eq. 23.
The tracer output concentration of the interwell multicavity in parallel should be the superposition of the output concentration of each parallel branch, which is the same as Eq. 20. Through further derivation and simplification, the tracer output concentration equation of the multicavity in parallel can be obtained as follows:
As with the tracer output curve of the fracture/pipe series cavity, considering the residence times of tracer migration in different parallel branches, the tracer output concentration of the i parallel branch should be delayed li/vi +
In order to illustrate the characteristics of the tracer output concentration curve of the interwell multicavity in parallel, C0 was 500 mg/L, Vd was 0.05 m3, Qc was 20 m3, α was 1 m, N was 3, and Vci was 100 m3. Equivalent diameter Di of the pipes at both ends of the cavity was 1 m, and the length of the pipes at both ends of the cavity was the same. Parameters of li = 80, 190, and 300 m and li = 100, 150, and 200 m were applied to analyze the curve characteristics of tracer output concentration under these two conditions (Figure 16).
As can be seen from Figure 16, similar to the tracer output concentration curve of the multifracture/multipipe in parallel, the tracer output concentration curve of the multicavity in parallel is a multipeak curve. There are two types of multipeak tracer curve: independent multipeak and continuous multipeak.
The peaks of the independent multipeak curve obviously show the curve shapes containing cavities. The two wings of the peaks are asymmetric with an obvious trailing phenomenon (the ascending branch is steep and the descending branch is slow). Each peak reflects a cavity, the flow difference between parallel branches is large, and there is no peak relative fusion.
The other type is the continuous multipeak curve. As can be seen from the continuous three-peak curve in Figure 16, there are only three parallel branches. The overall peak value lasted for about 100 days, reflecting the long fusion time of the peak values of the parallel branches, reflected in the long trailing time caused by cavities; and the flow difference between the parallel branches was small, resulting in a continuous multipeak curve shape.
The fracture-cavity combination pattern of a fracture-cavity reservoir is very complex, including not only the combination of fractures, pipes, and cavities, but also the series and parallel combination of various basic combination patterns, and the tracer output concentration curve of a well group is also variable. Taking a fracture-cavity reservoir as an example, the classification characteristics of its tracer curve can be fracture-cavity summarized by studying the morphological characteristics of the tracer curve in the field and of the tracer curve simulated theoretically by the above different fracture-cavity combination structures. By qualitatively judging the overall shape of the curve, the interwell fracture-cavity combination pattern can be quickly determined.
The characteristics of tracer output concentration curves of different fracture-cavity combination structures were described according to overall shape, number of peaks, and changes in the two wings of the tracer curve, as shown in Table 1.
Taking the tracer monitoring results of well group TK411 in the S48 unit of Block 4 in the Tahe oilfield as an example, identification and analysis of an interwell fracture-cavity combination structure were carried out by using the morphological characteristics of the tracer curve in the fracture-cavity reservoir.
Around injection well TK411, there are six production wells (TK408, TK428CH, TK476, TK467, T401, and S48), all of which are Ordovician producing zones. On 14 April 2007, 14 kg of BY-1 tracer was injected by pump truck according to the tracer injection design concentration for TK411 (100%). In tracer monitoring, 1,594 samples were sampled and 1,577 samples were tested for 200 days from the day following tracer injection to 31 October 2007. Meanwhile, tracer samples were also collected and tested from the second-line wells (TK457H and TK424CH).
Because of factors such as engineering, geology, and testing, tracer curves detected in the field often appear with errors, making the tracer curves rise and fall, and many real data points are masked. It is difficult to effectively judge the fracture-cavity combination structure according to the tracer-curve morphological characteristics of the different fracture-cavity combination structures. Therefore, a smoothing and filtering algorithm was used to denoise the tracer curve of eight wells corresponding to TK411, to identify the effective wave peak, to eliminate burrs, and to make the whole curve smooth and orderly. The tracer output concentration curve of each well and its denoising curve are shown in Figure 17.
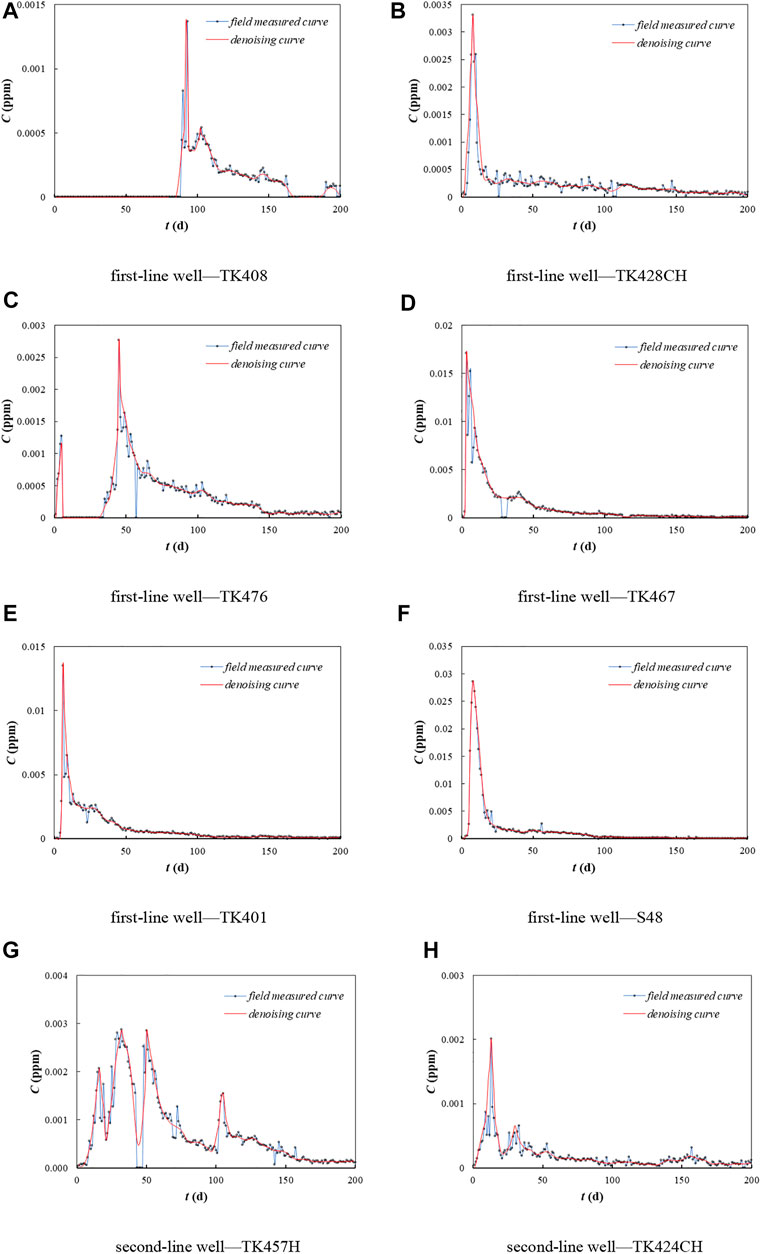
FIGURE 17. Tracer output concentration curves and denoising curves for TK411 well group. (A) first-line well—TK408 (B) first-line well—TK428CH (C) first-line well—TK476 (D) first-line well—TK467 (E) first-line well—TK401 (F) first-line well—S48 (G) second-line well—TK457H (H) second-line well—TK424CH.
According to the classification characteristics of the interwell tracer curve in the fracture-cavity reservoir from Table 1, the interwell fracture-cavity combination structure was qualitatively identified in terms of peak number, characteristics of two wings, and peak type of each curve in the TK411 well group. The results are shown in Table 2.
According to the tracer output concentration data and production performance data from a production well (cumulative water injection and cumulative water production during the tracer monitoring period), tracer recovery quality, tracer average residence time, average migration rate, distribution coefficient of injected water, and swept volume of injected water can be reliably calculated without using a theoretical model for inversion and fitting. These parameters provide an idea and means for verifying the reliability of interwell fracture-cavity structure identification with the morphological characteristics of tracer curve (Jing et al., 2016a; Dewaide et al., 2016).
Figure 18 displays the distribution coefficient and swept volume of injected water for the TK411 well group. It can be seen from the figure that the distribution coefficient of injected water from injection well TK411 to production well TK467 is the largest, indicating that there is a large connected channel. The swept volume of injected water is 1241.64 m3, and there is obviously a large cavity. According to its peak characteristics, it can be inferred that there is one cavity. This is basically consistent with the results obtained using the distribution coefficient and swept volume of injected water.
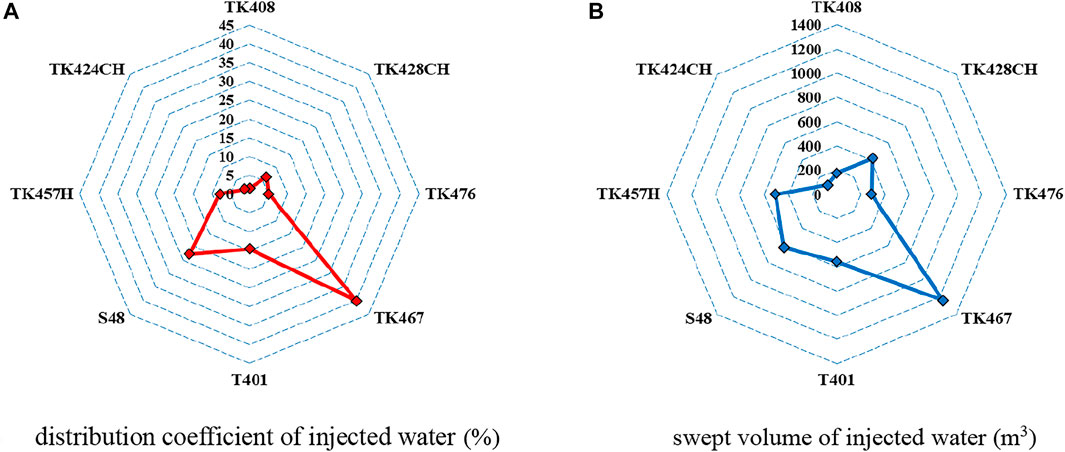
FIGURE 18. The distribution coefficient and swept volume of injected water of TK411 well group. (A) distribution coefficient of injected water (%) (B) swept volume of injected water (m3).
Figure 19 is the seismic multi-attribute plane superposition of 0–80 ms below plane T74 of TK411 block. In the figure, the darker the color is, the cavity reservoir development area (all the cavity development zones are in the area with strong amplitude change rate). It can be seen from the figure that TK411 has a strong amplitude change rate area in each path direction of the surrounding production wells, indicating that there is a high probability of cavity between each well. It also verifies the reliability of using tracer curve morphology to identify interwell fracture-cavity structure.
Meanwhile, by analyzing the results from karst tracer field testing and laboratory model testing in hydrologic exploration, it has been seen that the two wings of a karst pipe/fracture have the characteristics of a basically symmetrical tracer curve under relatively high velocity flow (Morales et al., 2006; Luhmann et al., 2012; Borghi et al., 2016; Dewaide et al., 2016; Zhang et al., 2016; Ji et al., 2017; Zhao et al., 2017), as well as that underground pools, water tanks, or underground rivers (caves) can cause obvious trailing of the tracer curve (Morales et al., 2006; Luhmann et al., 2012; Borghi et al., 2016; Dewaide et al., 2016; Zhang et al., 2016; Ji et al., 2017; Zhao et al., 2017). These conclusions are consistent with the conclusions obtained in this paper, and the curve characteristics obtained from the series and parallel combinations of pipe, fracture, and cavity are also consistent with them.
(1) Aiming to reduce the difficulty of effectively and reliably identifying interwell fracture-cavity combination structures in fracture-cavity reservoirs, a method is proposed for rapid identification of different fracture-cavity combination structures based on the number of peaks and morphological characteristics of two wings of tracer-curve peaks. The method provides a reliable and effective basis for designing water injection, gas injection, and flow-channel adjustment strategies.
(2) Based on mathematical models of tracer and curve characteristics for an interwell single fracture, single pipe, and single cavity, the morphological characteristics of tracer curves in five different series/parallel combination modes consisting of fractures, pipes, and cavities were analyzed. The tracer curves of fracture-cavity reservoirs are summarized into three types: single sharp peak, single slow peak, and multipeak, and a matching relationship between different fracture-cavity combination structures and the morphological characteristics of tracer curves is clarified.
(3) The tracer curve with a single sharp peak reflects that of an interwell single fracture/pipe, which is a single-sharp-peak curve with basically symmetrical wings; the tracer curve with a single slow peak reflects that of an interwell single cavity or fracture/pipe series cavity, which is a single-peak curve with a steep ascending branch and a slow descending branch (obvious trailing phenomenon); the tracer curve with a multipeak reflects that of an interwell multifracture/pipe/cavity in parallel; according to the flow difference of each branch flow channel, they can be divided into independent multipeak and continuous multipeak forms. If there is no cavity in the branch flow channel, the wings of each peak are basically symmetrical; if there is cavity in the branch flow channel, the descending branch has an obvious trailing phenomenon.
(4) Taking the tracer monitoring results of well group TK411 in the S48 unit of Block 4 in the Tahe oilfield as an example, the morphological characteristics of a tracer curve in a fracture-cavity reservoir were used to identify and verify the interwell fracture-cavity combination structure. The results show that the method of identifying an interwell fracture-cavity structure by tracer-curve morphological characteristics is simple and reliable. The research results can lay a theoretical foundation for establishing a quantitative interpretation modeling of interwell tracers in fracture-cavity reservoirs considering fracture-cavity configuration.
(5) In order to improve the operability of identifying interwell fracture-cavity composite structure by using interwell tracer curve morphological characteristics, image recognition technology will be adopted in the subsequent research to realize automatic computer recognition of interwell fracture-cavity composite structure. It can reduce the error of manual identification and provide the foundation for the establishment of practical automatic identification software system.
The original contributions presented in the study are included in the article/Supplementary Material, further inquiries can be directed to the corresponding author.
CJ: Conceptualization; Writing—Review andamp; Editing; SZ: Acquisition of data; Methodology; LL: Acquisition of data; Methodology; JW: Formal analysis; Investigation; BC: Data Curation; BT: Visualization; ZD: Validation; LG: Visualization.
This research was supported by the National Natural Science Foundation of China (No.51804256; No.52004216; No.52004215; No.51704235) and Natural Science Basic Research Plan in Shaanxi Province of China (No.2019JQ-287; No.2019JQ-820).
Author SZ was employed by Petrochina Tarim Oilfield Company. Author LL was employed by Northwest Oilfield Company. Author JW was employed by Shengli Oilfield Co. Author BC was employed by Petrochina ChangQing Oilfield Company Qil Production Plant NO.6. Author BT was employed by Xibu Drilling Engineering Company Limited. Author ZD was employed by Petrochina ChangQing Oilfield Company Gas Production Plant NO.2. Author LG was employed by Petrochina DaGang Oilfield Company Qil Production Plant NO.5.
The remaining author declares that the research was conducted in the absence of any commercial or financial relationships that could be construed as a potential conflict of interest.
All claims expressed in this article are solely those of the authors and do not necessarily represent those of their affiliated organizations, or those of the publisher, the editors and the reviewers. Any product that may be evaluated in this article, or claim that may be made by its manufacturer, is not guaranteed or endorsed by the publisher.
Al-Obathani, O. H., Al-Wehaibi, B. A., Al-Thawad, F. M., and Rahman, N. M. (2018). “New, Integrated Approach to Diagnose, Characterize and Locate Inter-well Fracture Connectivity in Carbonate Reservoirs from Transient-Test Data,” in Proceeding of The SPE Kingdom of Saudi Arabia Annual Technical Symposium and Exhibition, Dammam, Saudi Arabia, April 2018. doi:10.2118/192221-ms
Alaa, F. S., Hamdan, A. H., John, O., Olanike, A., Medhat, A., Luigi, S., et al. (2018). Reservoir-surveillance Data Creates Value in Fractured-Carbonate Applications. J. Petroleum Technol. 70 (9), 84–86. doi:10.2118/0918-0084-jpt
Borghi, A., Renard, P., and Cornaton, F. (2016). Can One Identify Karst Conduit Networks Geometry and Properties from Hydraulic and Tracer Test Data? Adv. Water Resour. 90, 99–115. doi:10.1016/j.advwatres.2016.02.009
Corbett, P. W., Geiger, S., Borges, L., Garayev, M., Gonzalez, J. G., and Valdez, C. (2010). “Limitations in Numerical Well Rest Modelling of Fractured Carbonate Rocks,” in Proceeding of The SPE EUROPEC/EAGE Annual Conference and Exhibition, Barcelona, Spain, June 2010. doi:10.2118/130252-ms
Dai, C. L., Fang, J. C., Jiao, B. L., He, L., and He, X. (2018). Development of the Research on EOR for Carbonate Fractured-Vuggy Reservoirsin China. J. China Univ. Petroleum Ed. Nat. Sci. 42 (6), 67–78. doi:10.3969/j.issn.1673–5005.2018.06.008
Dewaide, L., Bonniver, I., Rochez, G., and Hallet, V. (2016). Solute Transport in Heterogeneous Karst Systems: Dimensioning and Estimation of the Transport Parameters via Multi-Sampling Tracer-Tests Modelling Using the OTIS (One-Dimensional Transport with Inflow and Storage) Program. J. Hydrology 534, 567–578. doi:10.1016/j.jhydrol.2016.01.049
Dittaro, L. M., Schwindt, C., and Holding, T. L. (2007). “Surveillance & Optimization of a Waterflooded Fractured Carbonate Reservoir,” in Proceeding of the SPE International Petroleum Technology Conference, Dubai, U.A.E., December 2007.
Farhadinia, M. A., Chen, P., Delshad, M., Mohanty, K. K., and Rodriguez, F. G. (2011). “A Systematic Study of Oil Recovery Mechanisms from a Fractured and Vuggy Carbonate Reservoir,” in Proceeding of the SPE Annual Technical Conference and Exhibition, Denver, Colorado, USA, October 2011.
Gazi, N., Ali, F., Al-Naqi, M., Dashti, L., Al-Qattan, A., and Al-Farhan, F. (2012). “Reservoir Connectivity Analysis Using Long Term Interference Testing in a Waterflood Pilot in the Carbonate Marrat Formation of the Greater Burgan Field, Kuwait,” in Proceeding of The SPE Annual Technical Conference and Exhibition, San Antonio, Texas, USA, October 2012.
Hou, J., Luo, M., and Zhu, D. (2018). Foam-EOR Method in Fractured-Vuggy Carbonate Reservoirs: Mechanism Analysis and Injection Parameter Study. J. Petroleum Sci. Eng. 164, 546–558. doi:10.1016/j.petrol.2018.01.057
Huang, S. W., Zhang, Y., Zheng, X. P., Zhu, Q., Shao, G., Cao, Y., et al. (2017). Types and Characteristics of Carbonate Reservoirs and Their Implication on Hydrocarbon Exploration: A Case Study from the Eastern Tarim Basin, NW China. J. Nat. Gas Geoscience 2, 73–79. doi:10.1016/j.jnggs.2017.02.001
Ji, S. S., Liu, J. G., Wu, Y., Peng, D. W., Zhang, B. L., and Wang, M. X. (2017). Comparative Study on Characteristics of Tracer Curve Laboratory Experiment of Karst Pipeline and Karst Fracture. Site Investigation Sci. Technol. 4, 11–14+25.
Jiao, F. (2019). Practice and Knowledge of Volumetric Development of Deep Fractured-Vuggy Carbonate Reservoirs in Tarim Basin, NW China. Petroleum Explor. Dev. 46 (3), 576–582. doi:10.1016/s1876-3804(19)60037-6
Jing, C., Pu, C. S., He, Y. L., Gu, X. Y., Liu, H. Z., and Cui, S. X. (2016). Tracer Production Model of Single Fracture Belt and Analysis Parameters Sensitivity. Well Logging Technol. 40 (4), 408–412. doi:10.16489/j.issn.1004-1338.2016.04.005
Jing, C., Pu, C. S., Gu, X. Y., He, Y. L., Wang, B., and Cui, S. X. (2016). Classification and Interpretation Models of Inter-well Chemical Tracer Monitoring for Fractured Ultra-low Permeability Oil Reservoirs. Oil Drill. Prod. Technol. 38 (2), 226–231. doi:10.13639/j.odpt.2016.02.019
Lai, J., Peng, X. J., Xiao, Q. Y., Shi, Y., Zhang, H., Zhao, T., et al. (2019). Prediction of Reservoir Quality in Carbonates via Porosity Spectrum from Image Logs. J. Petroleum Sci. Eng. 173, 179–208. doi:10.1016/j.petrol.2018.10.022
Leong, Y., de Iongh, J. E., Bähring, S., Tuxen, A. K., and Nielsen, T. B. (2015). “Estimation of Fracture Volume between Well Pairs Using Deuterium Tracer,” in Proceeding of The SPE Annual Technical Conference and Exhibition, Houston, Texas, USA, September 2015.
Li, X. B., Peng, X. L., and Shi, Y. (2008). Application of Interwell Tracer Testing in Fracture-Cavity Reservoirs. J. Oil Gas Technol. 30 (6), 271–274.
Li, Y., Kang, Z., Xue, Z., and Zheng, S. (2018). Theories and Practices of Carbonate Reservoirs Development in China. Petroleum Explor. Dev. 45 (4), 712–722. doi:10.1016/s1876-3804(18)30074-0
Liu, X. L., Jian, Y., Li, Z. Y., and Wang, Y. (2006). “A New Methodology on Reservoir Modelling in the Fracture-Cavity Carbonate Rock of Tahe Oilfield,” in Proceeding of the SPE International Oil & Gas Conference and Exhibition in China, Beijing, China, December 2006.
Liu, E. R., Johns, M., Zelewski, G., Burnett, W. A., Wu, X., and Zhang, J. (2015). “Fracture Characterization by Integrating Seismic-Derived Attributes Including Anisotropy and Diffraction Imaging with Borehole Fracture Data in an Offshore Carbonate Field, United Arab Emirates,” in Proceeding of The SPE International Petroleum Technology Conference, Doha, Qatar, December 2015.
Liu, J., Lu, M., and Sheng, G. (2021). Description of Fracture Network of Hydraulic Fracturing Vertical Wells in Unconventional Reservoirs. Front. Earth Sci. 9, 749181. doi:10.3389/feart.2021.749181
Luhmann, A. J., Covington, M. D., Alexander, S. C., Chai, S. Y., Schwartz, B. F., Groten, J. T., et al. (2012). Comparing Conservative and Nonconservative Tracers in Karst and Using Them to Estimate Flow Path Geometry. J. Hydrology 448-449, 201–211. doi:10.1016/j.jhydrol.2012.04.044
Lyu, X., Liu, Z., Hou, J., and Lyu, T. (2017). Mechanism and Influencing Factors of EOR by N 2 Injection in Fractured-Vuggy Carbonate Reservoirs. J. Nat. Gas Sci. Eng. 40, 226–235. doi:10.1016/j.jngse.2017.02.022
Morales, T., Valderrama, I. F., Uriarte, J. A., Antigüedad, I., and Olazar, M. (2006). Predicting Travel Times and Transport Characterization in Karst Conduits by Analyzing Tracer-Breakthrough Curves. J. Hydrology 334 (1), 183–198.
Parra, J. O., and Parra, J. S. (2012). “Integration of Crosswell Reflection Seismic with Well Logs Using Cokriging for Mapping Conduits in Carbonate Aquifers,” in Proceeding of The 2012 SEG Annual Meeting, Las Vegas, NevadaNovember 2012.
Pu, C. S., Jing, C., He, Y. L., Gu, X., Zhang, Z., and Wei, J. (2016). Multistage Interwell Chemical Tracing for Step-by-step Profile Control of Water Channeling and Flooding of Fractured Ultra-low Permeability Reservoirs. Petroleum Explor. Dev. 43 (4), 621–629. doi:10.1016/s1876-3804(16)30079-9
Rong, Y. S., Pu, W. F., Zhao, J. Z., Li, K., Li, X., and Li, X. (2016). Experimental Research of the Tracer Characteristic Curves for Fracture-Cave Structures in a Carbonate Oil and Gas Reservoir. J. Nat. Gas Sci. Eng. 31, 714–427. doi:10.1016/j.jngse.2016.03.048
Sanni, M., Abbad, M., Kokal, S., Ali, R., Zefzafy, I., Hartvig, S., et al. (2017). “Reservoir Description Insights from an Inter-well Chemical Tracer Test,” in Proceeding of The SPE Kingdom of Saudi Arabia Annual Technical Symposium and Exhibition, Dammam, Saudi Arabia, April 2017.
Shbair, A. F., Hammadi, H. A., Martinez, J., Adeoye, O., Abdou, M., Saputelli, L., et al. (2017). “The Value of Reservoir Surveillance-Applications to Fractured Carbonates under Waterflooding,” in Proceeding of the SPE Abu Dhabi International Petroleum Exhibition & Conference, Abu Dhabi, UAE, November 2017.
Shekhar, R., Edwards, E., and Obeta, C. (2019). “Review of Identification, Characterization and Modeling of Different Types of Fault & Fracture Systems in a Giant Offshore Carbonate Reservoir, UAE,” in Proceeding of The SPE Abu Dhabi International Petroleum Exhibition & Conference, Abu Dhabi, UAE, November 2019.
Sheng, G., Su, Y., and Wang, W. (2019). A New Fractal Approach for Describing Induced-Fracture Porosity/permeability/Compressibility in Stimulated Unconventional Reservoirs. J. Petroleum Sci. Eng. 179, 855–866. doi:10.1016/j.petrol.2019.04.104
Su, W., Hou, J. R., Zhao, F. L., Xi, Y., Zhao, T., and Ding, B. (2017). “Feasibility and Influencing Factors of Oil Tolerant Nitrogen Foam on EOR Effect in the Fractured-Vuggy Carbonate Reservoir,” in Proceeding of the SPE Abu Dhabi International Petroleum Exhibition & Conference, Abu Dhabi, UAE, November 14, 2017.
Tayyib, D., Al-Qasim, A., Kokal, S., and Huseby, O. (2019). “Overview of Tracer Applications in Oil and Gas Industry,” in Proceeding of The SPE Kuwait Oil & Gas Show and Conference, Mishref, Kuwait, October 2019.
Tian, F., Di, Q., Jin, Q., Cheng, F., Zhang, W., Lin, L., et al. (2019). Multiscale Geological-Geophysical Characterization of the Epigenic Origin and Deeply Buried Paleokarst System in Tahe Oilfield, Tarim Basin. Mar. Petroleum Geol. 102, 16–32. doi:10.1016/j.marpetgeo.2018.12.029
Trice, R., and C Reservoirs Ltd, (2005). “Challenges and Insights in Optimising Oil Production Form Middle Eastern Karst Reservoirs,” in Proceeding of the SPE Middle East Oil and Gas Show and Conference, Kingdom of Bahrain, March 12 2005.
Wan, Y.-Z., Liu, Y.-W., Chen, F.-F., Wu, N.-Y., and Hu, G.-W. (2018). Numerical Well Test Model for Caved Carbonate Reservoirs and its Application in Tarim Basin, China. J. Petroleum Sci. Eng. 161, 611–624. doi:10.1016/j.petrol.2017.12.013
Wang, X. W., Yuan, G., Tian, Y. C., Lv, L., and Qie, S. (2013). “Analysis of Factors Affecting Carbonate Fracture-Cave Imaging,” in Proceeding of The 2013 SEG Annual Meeting, Houston, Texas, September 2013.
Wei, P., Zhang, T. Y., Du, J., Ai, S., and Mao, J. (2019). “Caves Diagnosis in Carbonate Reservoirs,” in Proceeding of The SPE Middle East Oil and Gas Show and Conference, Manama, Bahrain, March 2019.
Xie, J. X., Liu, Z., Cheng, B. Q., Wang, C. R., Yu, Y. C., Lin, Y., et al. (2008). Tracer Technology Used in Sandstone Reservoir and Fractured Carbonate Reservoir. Well Logging Technol. 32 (3), 272–276. doi:10.16489/j.issn.1004-1338.2008.03.020
Yang, B., He, J., Lyu, D. L., Tang, H., Zhang, J., Li, X., et al. (2018). Production Optimization for Water Flooding in Fractured-Vuggy Carbonate Reservoir – from Laboratory Physical Model to Reservoir Operation. J. Petroleum Sci. Eng. 184, 106520. doi:10.1016/j.petrol.2019.106520
Yue, P., Xie, Z., Huang, S., Liu, H., Liang, S., and Chen, X. (2018). The Application of N2 Huff and Puff for IOR in Fracture-Vuggy Carbonate Reservoir. Fuel 234, 1507–1517. doi:10.1016/j.fuel.2018.07.128
Yue, P., Xie, Z., Liu, H., Chen, X., and Guo, Z. (2018). Application of Water Injection Curves for the Dynamic Analysis of Fractured-Vuggy Carbonate Reservoirs. J. Petroleum Sci. Eng. 169, 220–229. doi:10.1016/j.petrol.2018.05.062
Zhang, Z. W., Cheng, Z. Q., Gao, C. C., and Ren, S. Y. (2016). Tracing Detection Study on Underground Reservoir Capacity in Karst Depression Area. Geotechnical Investigation Surv. 44 (1), 44–50.
Zhao, X. E., Chang, Y., Ping, F., and Wu, J. (2017). Experimental Study of Solute Transport in Pool-Pipe System and its Significance on Karst Hydrogeology. J. Jilin Univ. (Earth Sci. Ed. 47 (4), 1219–1228. doi:10.13278/j.cnki.jjuese.201704202
Zhao, Y. Y. (2017). Quantitative Evaluation Method of Interwell Connectivity for Fractured-Vuggy Reservoirs and its Application. J. Xi'an Shiyou Univ. Nat. Sci. Ed. 32 (3), 68–72. doi:10.3969/j.issn.1673–064X.2017.03.010
Zheng, S., Yang, M., Kang, Z., Liu, Z., Long, X., Liu, K., et al. (2019). Controlling Factors of Remaining Oil Distribution after Water Flooding and Enhanced Oil Recovery Methods for Fracture-Cavity Carbonate Reservoirs in Tahe Oilfield. Petroleum Explor. Dev. 46 (4), 786–795. doi:10.1016/s1876-3804(19)60236-3
Keywords: fracture-cavity reservoirs, interwell tracer, fracture-cavity combination structure, morphological characteristics of tracer curve, peak characteristics
Citation: Jing C, Zhang S, Li L, Wang J, Chen B, Tian B, Dai Z and Gao L (2022) Rapid Identification of Interwell Fracture-Cavity Combination Structure in Fracture-Cavity Reservoir Based on Tracer-Curve Morphological Characteristics. Front. Energy Res. 10:892622. doi: 10.3389/fenrg.2022.892622
Received: 09 March 2022; Accepted: 11 April 2022;
Published: 04 May 2022.
Edited by:
Xun Zhong, Yangtze University, ChinaReviewed by:
Xiaofei Sun, China University of Petroleum (East China), ChinaCopyright © 2022 Jing, Zhang, Li, Wang, Chen, Tian, Dai and Gao. This is an open-access article distributed under the terms of the Creative Commons Attribution License (CC BY). The use, distribution or reproduction in other forums is permitted, provided the original author(s) and the copyright owner(s) are credited and that the original publication in this journal is cited, in accordance with accepted academic practice. No use, distribution or reproduction is permitted which does not comply with these terms.
*Correspondence: Cheng Jing, amljaC4wNzA0QDE2My5jb20=
Disclaimer: All claims expressed in this article are solely those of the authors and do not necessarily represent those of their affiliated organizations, or those of the publisher, the editors and the reviewers. Any product that may be evaluated in this article or claim that may be made by its manufacturer is not guaranteed or endorsed by the publisher.
Research integrity at Frontiers

Learn more about the work of our research integrity team to safeguard the quality of each article we publish.