 Li Zhang
 Pengya Guo
 Yidan Yuan
 Yangyang Liang1
 Qiang Guo
 Weimin Ma
95% of researchers rate our articles as excellent or good
Learn more about the work of our research integrity team to safeguard the quality of each article we publish.
Find out more
ORIGINAL RESEARCH article
Front. Energy Res. , 26 September 2022
Sec. Nuclear Energy
Volume 10 - 2022 | https://doi.org/10.3389/fenrg.2022.892592
This article is part of the Research Topic Experimental and Analytical Investigations on Nuclear Reactor Safety, Severe Accident Phenomena and Severe Accident Mitigation of Nuclear Power Plants View all 20 articles
This study described the natural circulation and heat transfer of a molten pool in a specifically designed core catcher conceived for a pressurized water reactor. In addition to external cooling, the core catcher features internal cooling tubes embedded in the molten pool. To investigate the coolability in such a configuration, first, a full-scale core catcher simulation is conducted to give a preliminary study under a real SA situation. Results illustrated that cooling efficiency can be remarkably enhanced due to the inner tubes. Then a test facility of the 2D slice with the geometrical scaled factor of 1:4 has been developed, and molten salt (NaNO3–KNO3) experiments will be implemented in the near future. This study also performed a pre-test simulation using molten NaNO3–KNO3 as a stimulant to study the heat transfer and flow characteristics of the salt pool. The melt convection in the test section was represented by a two-dimensional mesh with a WMLES turbulence model using the FLUENT code. The simulation captured the heat transfer enhancement by the cooling tubes as expected, and the results would help decide the proper test matrix and improvement of instrumentation required to obtain the necessary data for code validation.
During the course of a severe accident in NPPs, the reactor core may be melted down by the decay heat and transferred to the lower head of the reactor pressure vessel (RPV). The RPV may be melted through and relocated to the reactor cavity, resulting in basement melt penetration without countermeasures to mitigate the progress. Therefore, arresting the melted core in a controlled way in RPV or in the containment is of great importance, which leads to the in-vessel melt retention (IVR) or ex-vessel melt retention (EVR) strategy, respectively.
For high-power reactors like VVER-1000/1,200 and EPR, the EVR strategy is preferred to terminate the accident and mitigate the consequences in case of containment melting through (Ha et al., 2011) despite the IVR being simpler and costless. The VVER-1000/1,200 reactors (Asmolov, 2005) are equipped with core catchers installed under the RPV, while the EPR (Fischer, 2004) reactors are using the large spreading room for enhancement of ex-vessel cooling of the corium. For these two typical types of advanced reactors with an ex-vessel melt retention strategy, the key issue is ensuring that the corium flows into the designated area and cools down as expected. For these purposes, various measures such as the addition of sacrificial material (Khabensky et al., 2009) and multiple cooling methods have been adopted to deal with corium conditioning and to enhance heat transfer between the corium and coolant (Fischer et al., 2005).
To analyze the safety margin of in-vessel retention for AP1000, Zhang et al. (2010) developed a point estimate procedure IVRASA (IVR analysis code in a severe accident) for modeling the two-layer configuration and postulated three-layer steady-state core melt configurations. Their results indicated that for the two-layer configuration, the overall heat flux remains below the critical heat flux (CHF), while for the postulated three-layer configuration, due to the portioning of partial metal into the bottom layer, the heat flux in the light metal layer could surpass CHF. COPRA (Zhang et al., 2016a; Zhang et al., 2016b) (Corium Pool Research Apparatus) experiments on the in-vessel melt pool behavior had been extensively conducted in Xi’an Jiaotong University with a 2D 1/4 circular slice of full-scale (1:1) lower plenum of RPV for the Chinese large-scale advanced PWR, where simulant material NaNO3–KNO3 were chosen as working fluid with eutectic (50 mol% NaNO3–50 mol% KNO3) and non-eutectic (20 mol% NaNO3–80 mol% KNO3) composition. Experimental results showed that the downward heat transfer toward the vessel wall of the COPRA test was lower than that from other previous experiments and correlations with the relevant range of Rayleigh numbers (1015 ∼ 1017). With the COPRA experimental results, Luo et al. (2018) and Luo et al. (2019) numerically investigated the behavior of internally heated melt pool with eutectic salt, using the algebraic Wall Modeled LES (WMLES) model for the turbulence modeling, and found power changing will not affect the sideward heat flux significantly, while it had intensive impacts on the crust growth on the curved sidewall with a polar angle below 30°. Ge et al. (2019) numerically studied the effects of stratified interface instability on the thermal focusing effect in a two-layer corium pool, and relevant results can provide a reference for reactor IVR safety analysis and optimization design.
Motivated by the improvement of the cooling limit, the present study introduces a conceptual Ex-Vessel Retention design with a set of perforated tubes penetrating through a crucible which is filled with sacrificial materials under the RPV (see Figure 1). The whole device is kept dry during normal operation, while in case of severe accidents, water will be injected into the pit through the bottom of the basement until almost near the top of those tubes. Once the corium is pouring out from the RPV, the melt flow will be restricted to the center of the device by a refractory guide plate so that those tubes located along the outer circle wound not be damaged. When almost all the core melt is captured and its mixing with the sacrificial material comes to the state of layer reversion, the cooling water will be injected again until the whole pit is flooded and all the melt is surrounded by water. The internal flow of the coolant will be driven by natural circulation as well as the molten pool itself. The decay heat will finally be released by water evaporation and the mixture of the melt and sacrificial material will finally be solidified in the device. In order to analyze the efficacy in coolability enhancement of this design, a full-scale simulation with code FLUENT is conducted to give a preliminary study in the real situation. Actually, a slice test facility with a geometrical scaled factor of 1:4 is proposed meanwhile, and a pre-test simulation is carried out using non-eutectic molten salt which is 20–80% mixture of NaNO3 and KNO3 based on the test facility in the near future.

FIGURE 1. Sketch of the conceptual ex-vessel coolability enhancement.
Similar to the in-vessel molten pool, computation analysis is a complementary way to investigate the mechanism of heat transfer and pool behavior for the conceptual ex-vessel retention design. As to a similar problem, lots of simulation methods or models done by previous researchers could be referred to. The ECM and PECM methods performed by C.T. Tran (Tran and Dinh, 2009) were applied to predict thermal loads imposed on the vessel wall and control rod guide tubes (CRGTs) during core debris heatup and melting in a boiling water reactor (BWR) lower plenum. Buck et al. (2010) used ASTEC and ATHLET-CD as well as CFD code CONV in developing the post-test calculations compared with the FSt4 LIVE test. In addition, Zhang et al. (2013) developed a two-dimensional numerical model with the SIMPLE algorithm in investigating the LIVE-L4 molten pool heat transfer characteristics too. Andrej Horvat (Horvat and Mavko, 2004) performed a numerical analysis of natural convection with the SST model of CFX 5.7 fluid dynamic software according to Asfia experiments. In addition, the fixed interface model has been successfully employed to describe the heat transfer in the system of the immiscible fluids numerically compared to data measured in the SIMECO experiments (Gubaidullin and Sehgal, 2004). Zhang et al. (2018) and Zhang et al. (1000) launched a numerical simulation by Fluent 17.1 based on the wall-modeled large eddy simulation (WMLES) method and the VOF model, as well as the phase change model, to obtain the corium pool heat transfer characteristic which agreed well with COPRA experimental data.
The numerical work in this study is a 2D half-round slice compared to the whole lower head which includes a molten pool, crucible, and cooling tubes, as shown in Figure 2. The red part is the molten pool (mixture of core melt and sacrificial material), the green part is the crucible, and the blue part is the cooling tubes. The prototype case calculation was launched corresponding to the full size listed in Table 1. The decay heat under the real situation is input as
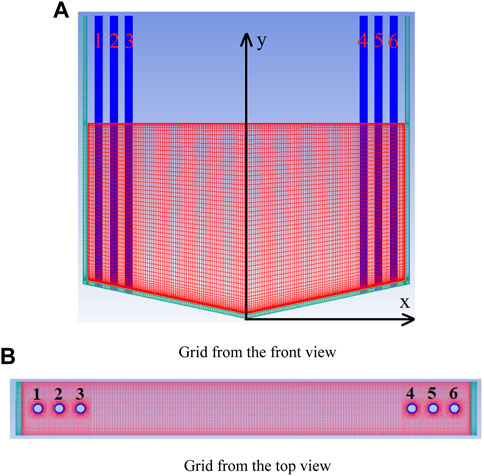
FIGURE 2. Schematic diagram of the 2D half-round slice. (A) Grid from the front view. (B) Grid from the top view.
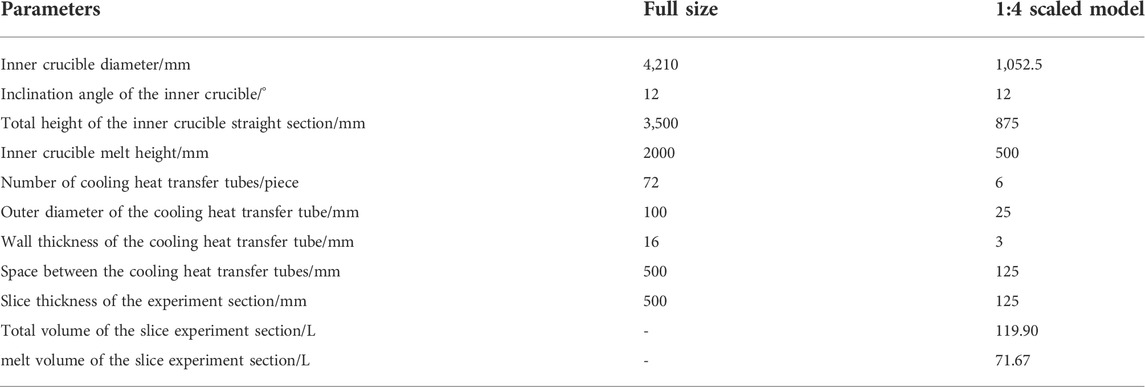
TABLE 1. Geometry of the full size device and 1:4 scaled model.
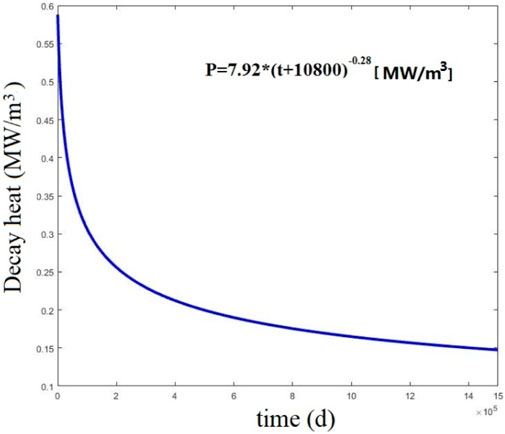
FIGURE 3. Typical decay heat of the reactor after severe accident.
The wall-modeled large eddy simulation is selected as the turbulence model so as to the solidification–melting phase transition model. Large temperature gradients are likely to occur near the wall of the cooling tubes and the wall of the crucible, so the grid needs to be heavily refined. Among them, a double O-block division is adopted near the cooling tube to achieve mesh densification and quality improvement. Tran et al. (2010) recommended that the boundary layer mesh size should satisfy ∆x < H/1,500 in calculating the molten pool whose Ra’ (
where
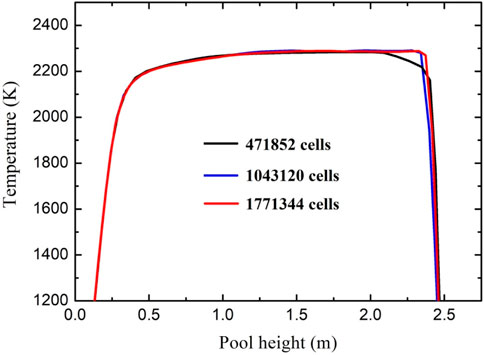
FIGURE 4. Central temperature vs. pool height at 10000s.
The physical properties of the prototype melt and non-eutectic mixture of NaNO3–KNO3 (20–80%) are shown in Table 2. Among them, the physical properties of prototype melt are set as constant, while heat capacity, conductivity, and viscosity data for NaNO3–KNO3 are changing with temperature. The Boussinesq approximation is assigned to the density for both to produce the volume force. In addition, stainless steel is used as the vessel wall both in prototype condition and simulant experiment. Its physical properties are listed in Table 3.

TABLE 2. Physical properties for real melt and non-eutectic mixture of NaNO3–KNO3 (20–80%).
TABLE 3. Physical properties for stainless steel.
For the prototype melt case, the outer wall of the molten pool on the side of the cooling water and the inner wall of the cooling tube are both set to a constant temperature 100°C. The top boundary of the molten pool is also set as 100°C, considering that the water around is saturated and it is conservative in coolability evaluation. The front and back walls are set as adiabatic boundaries.
For the experiment of NaNO3–KNO3, since the water is injected from the bottom then into the tubes, the outer wall of the molten pool on the side and the inner wall of the cooling tubes are both set to 25°C, thinking that the cooling water in the experiment is under room temperature. The top of the molten pool is set as convection boundary and the convection coefficient for NaNO3–KNO3 is set as 11.2 W/(m2·K). The front and back walls are set as adiabatic boundaries too. The inner wall of the molten pool and the outer wall of the cooling tube above the liquid level are set as the radiation boundary, and the outside zone temperature is set to 25°C with the surface emissivity 0.6. In addition, boundary temperature of top and bottom sections of the cooling tube as well as the top of the side wall of the molten pool is also 25°C.
The model was verified according to the experimental results of COPRA (Ge et al., 2019). The temperature profile vs. pool height (Figure 5) and heat flux distribution along with the polar angle had a good agreement according to the case of NaNO3–KNO3 (20–80%) molten salt experiment data. So it was indicated that the WMLES method is capable of illustrating the heat transfer and flow feature in a high-Rayleigh-number molten pool.
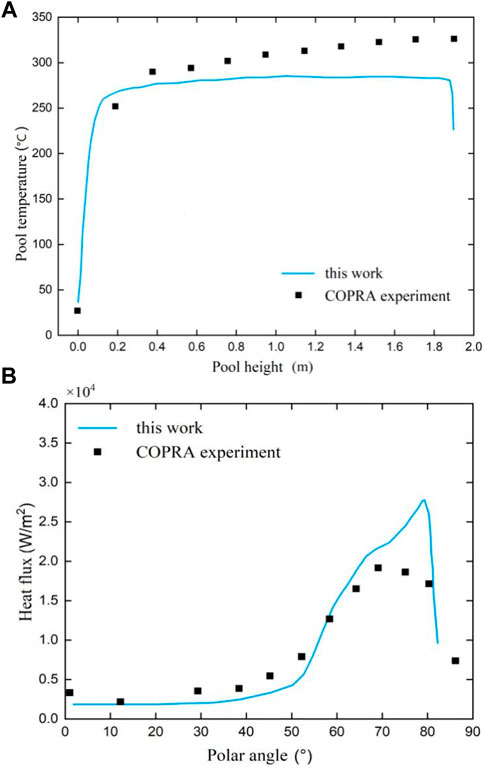
FIGURE 5. Verification of the model according to COPRA molten salt experiment. (A) Temperature profile vs. pool height. (B) Flux distribution along with the polar angle.
The most important question for this ex-vessel conceptual design is whether those cooling tubes would survive and keep functional. So the thermal load along the tubes is calculated in the prototype model as revealed by Figure 6. The heat flux is as high as 2.5 MW/m2 at the first 100s and would quickly drop to 1 MW/m2 during a few thousand seconds. With almost 72 tubes in the pool, the cooling surface is enlarged, which will greatly enhance the coolability of the device. The largest heat flux is located in 0.2 m beneath the melt surface. Maybe this is a dangerous situation for the tubes to be destroyed because CHF of the vertical stainless steel tube could be exceeded. According to the maximum temperature along the tubes (Figure 7), mostly the tubes would bear as high as 2000°C in the first 1000s including the left and right walls. But in fact, the refractory crust solidified by the coolant water may work as the proof from heat around the tubes; its conductivity is quite lower. So those tubes could still possibly survive in the authors’ opinion. But this needs to be proved by experiment or more detailed modeling. As revealed in Figure 6, the heat flux in the lower part of the tube is much smaller than that in the top part near the melt surface, thanks to the weak convection and lower heat transfer along the inclined bottom part.
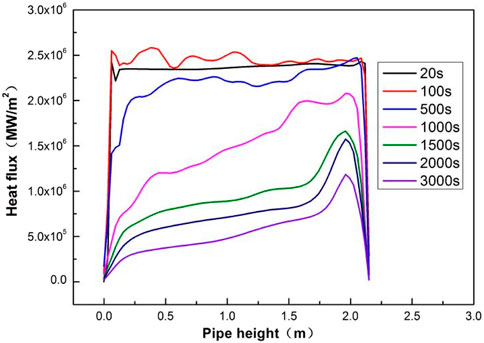
FIGURE 6. Heat flux vs. the height of the inner tube at the beginning.
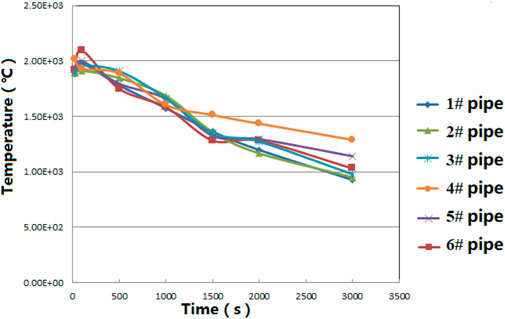
FIGURE 7. Maximum temperature along the tubes vs. time.
The initial temperature for the prototype melt case is assumed as 2800 K in the calculation. It is conservative because the reaction between the core melt and sacrificial material is endothermic. Figure 8 indicates that the largest temperature along 1.8 m pool level will decline from 2800 to 2400 K during the first 3000s. The temperature near those tubes would dramatically drop to a very low value within the space between the tubes. Specific heat and latent heat of the melt must be the main heat source at the first thousands of seconds, while during long time cooling, decay heat may act as the important role.
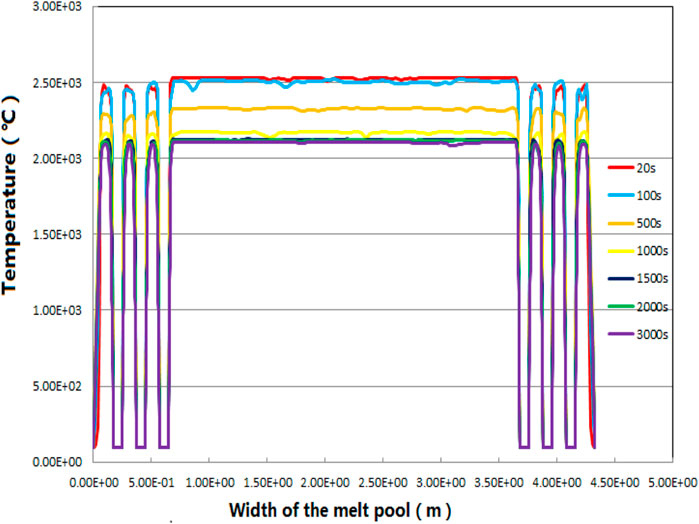
FIGURE 8. Temperature evolution at 0.2 m beneath the melt surface.
From the results of the simulation, it will take several months (no more than 10) for almost all the melt cooling down to temperature of 1800K, as shown by Figures 9, 10. Melt near the tubes, inclined bottom, and the top surface which directly contacts with water will quickly be solidified, while the center of the pool is still a mushy zone after several months.
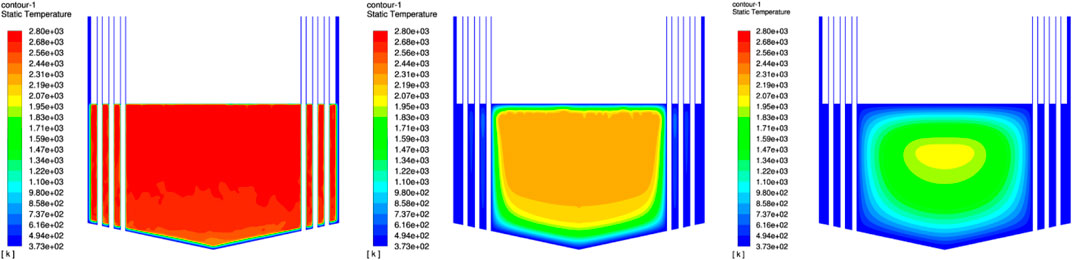
FIGURE 9. Thermal profile of the molten pool vs. time: 1) within 1000s; 2) several days; 3) several months.
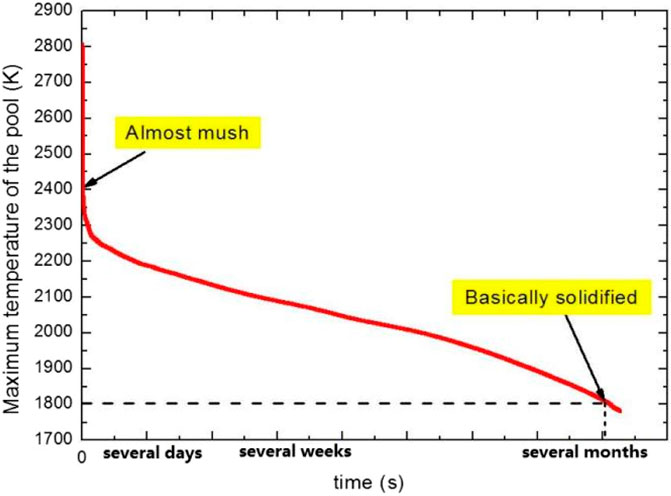
FIGURE 10. Solidification of the molten pool: Tmax vs. time.
The initial temperature for the molten salt of the test simulation is assumed as 298.15 K and a steady state solver is launched. Results show the temperature profile at the bottom of the molten pool rises more rapidly as the height increases no more than 0.1 m (see Figures 11, 12) in the center of the molten pool. Then temperature seems steady as high as 280°C afterward. The upper center part of the molten pool is the hottest with or without tubes. But the temperature difference between the two is insignificant. Due to the heat loss by convection on the top, temperature near the pool surface decreases within a thin layer. The brim of the pool, mainly near the lower part of the tubes, is easily and quickly cooled down.
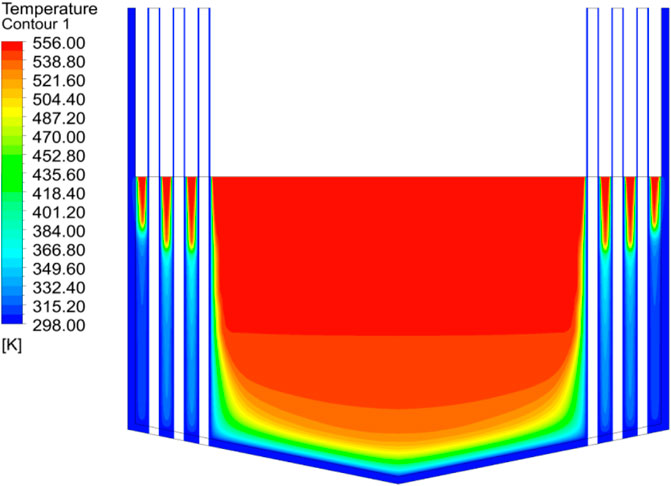
FIGURE 11. Temperature distribution of molten pool (NaNO3–KNO3).
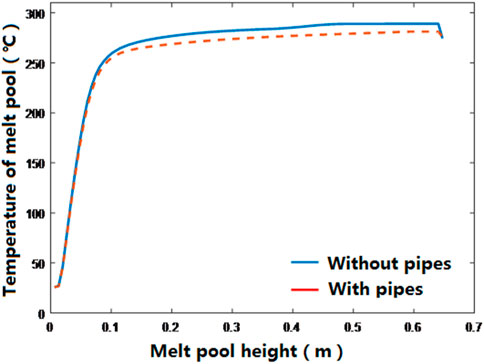
FIGURE 12. Temperature profile in the center of the molten pool (NaNO3–KNO3).
Similar to Figures 11, 12, temperature near the bottom of the molten pool, the side walls, and the cooling tube is lower than the solidus temperature, so it seems to be encrusted (see Figures 13, 14). Only a small area near the upper part of the cooling tube is still liquid. The distribution of the liquid phase in the main body of the molten pool is consistent with the temperature distribution. As the height increases, the liquid phase fraction rises more rapidly, and as the height rises further, the rising rate slows down. The liquid phase fraction profile in the center with tubes shows great reduction compared to case without tubes.
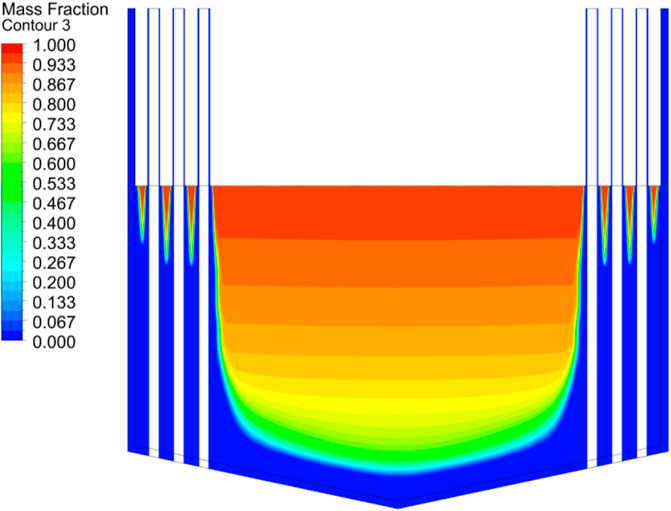
FIGURE 13. Distribution of liquid phase fraction in molten pool (NaNO3–KNO3).
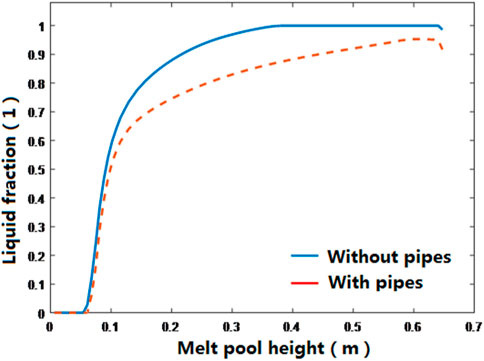
FIGURE 14. Distribution of liquid phase fraction in the center of the molten pool (NaNO3–KNO3).
The fluid is likely to move obviously between the upper part of the cooling tubes, and velocity may reach 0.0055–0.0072 m/s (see Figure 15). The convection under the melt surface is also relatively tense. In the case with tubes, the vector and flow stream lines inside the molten pool are more regular. It can be seen that the strong heat exchange of the cooling tubes also strengthens the regularity of the flow inside the molten pool.
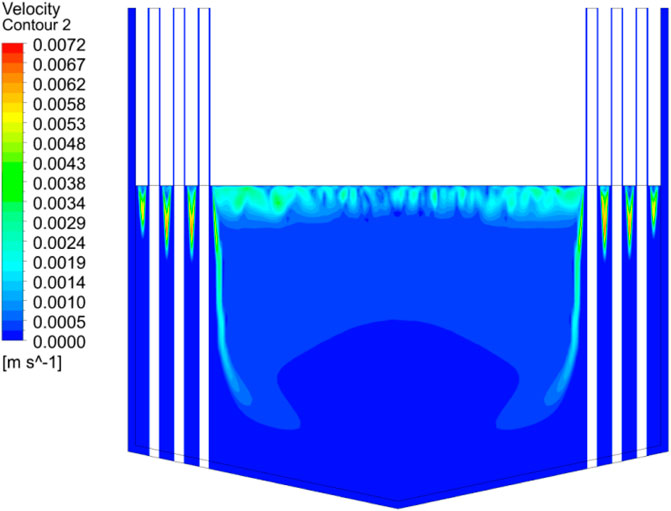
FIGURE 15. Velocity contour diagram of molten pool (NaNO3–KNO3).
As shown in Figure 16, since the bottom molten pool might be crusted, heat flux gradually increases with the pool height on the side wall of the molten pool. There may be great growth at the height 0.4–0.6 m until the peak value is reached near the molten pool surface. The maximum heat flux is 16.14 kW/m2 in the case with tubes, about one half of the one without tubes. Due to the effect of convection at the melt surface, the heat flux drops rapidly to some extent. The average heat flux on the side wall is 3.74 kW/m2. Moreover, the ratio of heat flux peak to the average value is 4.32.
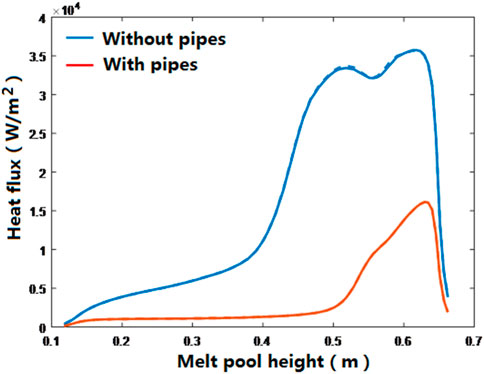
FIGURE 16. Heat flux distribution on the side wall of the molten pool (NaNO3–KNO3).
As revealed by Figure 17,
1) For the inner walls of cooling tubes 3 and 4, the heat flux is basically larger than that of others when the height of the molten pool is less than 0.45 m, probably because they are very close to the center of the hot pool. Above 0.5 m, thermal load seems the same for all the tubes since there are almost no differences for the melt around. The peak appears below the molten pool surface, which is about 44.75–47.48 kW/m2.
2) The addition of the cooling tubes can reduce the peak and average heat flux of the side wall to 45.1 and 23.1%, respectively, which is a great enhancement of coolability.
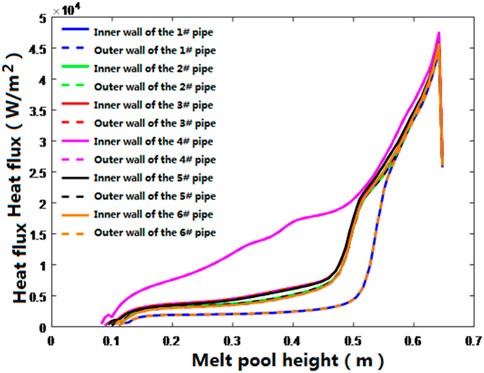
FIGURE 17. Heat flux distribution along the cooling tubes (NaNO3–KNO3).
The total heat flow statistics are shown in Table 4. It can be seen that without tubes, the heat flow on the side wall of the molten pool is much greater than that on the bottom wall, and the former is about 4.79 times that of the latter. After adding the cooling tubes, the heat flow exported from the cooling tube is much larger than that imposed on the side wall and bottom wall, and the ratio of the three is about 7.34:1.74:1. Therefore, the cooling tubes can transmit most of the heat out of the molten pool, which will greatly reduce thermal loads of the catcher brim, thereby reducing the risk of integrality breach by real high-temperature core melt.
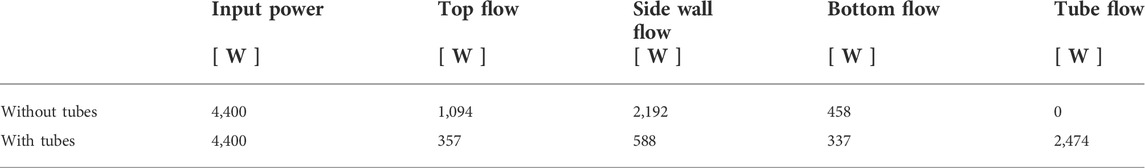
TABLE 4. Statistics of total heat flow in the molten pool.
According to the prototype melt numerical results, it seems that 1) cooling efficiency can be remarkably enhanced due to the inner tubes. The maximum temperature of the molten pool drops rapidly during the first several days and the cooling rate is relatively smooth until the melt basically solidifies after several months; 2) thermal loads of the tubes reach a peak of 2.5 MW⋅m−2 during the first hundred seconds, and the most dangerous part is located on the top of the molten pool.
As to the 1:4 scaled pre-test simulation with molten salt (NaNO3–KNO3) as simulant of the corium, it can be concluded that1) the adaption of the cooling tubes can greatly reduce the peak and average heat flux of the side wall, which seems a great enhancement of coolability under the steady state and a good protector for the catcher side walls; 2) with the incensement of pool height, the heat flux gradually increases until reaches the peak value near the molten pool surface, which is the same as the prototype melt case.
In the future, a 1:4 scaled heat transfer experiment of the molten pool will be conducted. Apart from the declining and vertical walls, thermal loads on inner tubes can also be investigated; till then scaled analysis work and test results shall be compared with the numerical calculations.
The original contributions presented in the study are included in the article/Supplementary Material; further inquiries can be directed to the corresponding author.
LZ, PG, and YL were contributors to the simulation work and the model interpretation; YG, WL, and QG were contributors to the experiment facility and scaling work related which was important for the numerical caculation. YY was the corresponding author and WM was the technical advisor.
This work was supported by the National Key R&D Program of China (Grant No. 2018YFB1900100).
Authors LZ, PG, YY, YL, YG, WL, and QG were employed by the company China Nuclear Power Engineering Co, LTD.
The remaining author declares that the research was conducted in the absence of any commercial or financial relationships that could be construed as a potential conflict of interest.
All claims expressed in this article are solely those of the authors and do not necessarily represent those of their affiliated organizations, or those of the publisher, the editors, and the reviewers. Any product that may be evaluated in this article, or claim that may be made by its manufacturer, is not guaranteed or endorsed by the publisher.
Addad, Y., Gaitonde, U., and Laurence, D. (2008). Optimal unstructured meshing for large eddy simulations” book chapter in quality and reliability of large-eddy simulations. ERCOFTAC Ser. 12, 93–103. doi:10.1007/978-1-4020-8578-9_8 (ISBN: 978-1-4020-8577-2)
Asmolov, V. G. (2005). “Crucible-type core catcher for VVER-1000 reactor,” in Proceedings of ICAPP'05 (Seoul: Korea, May), 15–19.
Buck, M., Burger, M., Miassoedov, A., Gaus-Liu, X., Palagin, A., Godin-Jacqmin, L., et al. (2010). The LIVE program – results of test L1 and joint analyses on transient molten pool thermal hydraulics. Prog. Nucl. Energy 52, 46–60. doi:10.1016/j.pnucene.2009.09.007
Fischer, M. (2004). The severe accident mitigation concept and the design measures for core melt retention of the European Pressurized Reactor (EPR). Nucl. Eng. Des. 230, 169–180. doi:10.1016/j.nucengdes.2003.11.034
Fischer, M., Herbst, O., and Schmidt, H. (2005). Demonstration of the heat removing capabilities of the EPR core catcher. Nucl. Eng. Des. 235, 1189–1200. doi:10.1016/j.nucengdes.2005.02.022
Gaus-Liu, X., and Miassoedov, A. LIVE experimental results of melt pool behaviour in the PWR lower head with insulated upper lid and external cooling[C]. The 21st International Conference on Nuclear Engineering (ICONE-21), Chengdu, China, October 2013 12
Ge, K., Zhang, Y., Tian, W., Su, G., and Qiu, S. (2019). Effect of stratified interface instability on thermal focusing effect in two-layer corium pool. Int. J. Heat Mass Transf. 133, 359–370. doi:10.1016/j.ijheatmasstransfer.2018.12.117
Gubaidullin, A. A., and Sehgal, B. R. (2004). Numerical analysis of natural convection and mixing in two-fluid stratified pools with internal heat sources. J. Heat. Transf. 126, 600–610. doi:10.1115/1.1777578
Ha, K. S., Yeol Kim, H., Kim, J., and Park, J. H. (2011). An evaluation of a direct cooling method for the ex-vessel corium stabilization. Nucl. Eng. Des. 241, 4737–4744. doi:10.1016/j.nucengdes.2011.03.033
Horvat, A., and Mavko, B. Numerical investigation of natural convection heat transfer in volumetrically heated spherical segments. International Conference Nuclear Energy for New Europe 2004, Portorož ,Slovenia, 2004 September 6-9.
Khabensky, V. B., Granovsky, V. S., Bechta, S. V., and Gusarov, V. V. (2009). Etc. Severe accident management concept of the VVER-1000 and the justification of corium retention in a crucible-type core catcher. Nucl. Eng. Technol. 41, 561–574. doi:10.5516/net.2009.41.5.561
Luo, S., Zhang, Y., Zhang, D., Su, G., and Qiu, S. (2019). Numerical analysis of simulant effect on natural convection characteristics in corium pools. Appl. Therm. Eng. 156, 730–740. doi:10.1016/j.applthermaleng.2019.04.101
Luo, S., Zhang, Y., Zhou, Y., Tian, W., Su, G., and Qiu, S. (2018). COPRA experiment and numerical research on the behavior of internally-heated melt pool with eutectic salt. Appl. Therm. Eng. 140, 313–324. doi:10.1016/j.applthermaleng.2018.05.041
Tran, C. T., and Dinh, T. N. (2009). The effective convectivity model for simulation of melt pool heat transfer in a light water reactor pressure vessel lower head. Part I: Physical processes, modeling and model implementation. Prog. Nucl. Energy 51, 849–859. doi:10.1016/j.pnucene.2009.06.007
Tran, C. T., Kudinov, P., and Dinh, T-N. (2010). An approach to numerical simulation and analysis of molten corium coolability in a boiling water reactor lower head. Nucl. Eng. Des. 240 (9), 2148–2159. doi:10.1016/j.nucengdes.2009.11.029
Zhang, L., Luo, S., Zhang, Y., Wenxi, G. H., Su, G., and Qiu, S. (2018). Large eddy simulation on turbulent heat transfer in reactor vessel lower head corium pools. Ann. Nucl. Energy 111, 293–302. doi:10.1016/j.anucene.2017.08.055
Zhang, L., Zhang, Y., Su, G. H., Ma, Z., Bu, S., Sun, W., et al. Numerical simulation for the heat transfer in two-layer corium pool in HPR1000 reactor. 12th International Topical Meeting on Nuclear Reactor Thermal-Hydraulics, Operation and Safety (NUTHOS-12) Qingdao, China, October 14-18, 2018
Zhang, Y. P., Qiu, S., Su, G., and Tian, W. (2010). Analysis of safety margin of in-vessel retention for AP1000. Nucl. Eng. Des. 240, 2023–2033. doi:10.1016/j.nucengdes.2010.04.020
Zhang, Y. P., Su, G. H., Qiu, S. Z., Tian, W. X., Gaus-Liu, X., Kretzschmar, F., et al. (2013). A simple novel and fast computational model for the LIVE-L4. Prog. Nucl. Energy 68, 20–30. doi:10.1016/j.pnucene.2013.04.009
Zhang, Y. P., Zhang, L., Zhou, Y., Tian, W., Qiu, S., Su, G., et al. (2016). Natural convection heat transfer test for in-vessel retention at prototypic Rayleigh numbers – results of COPRA experiments. Prog. Nucl. Energy 86, 80–86. doi:10.1016/j.pnucene.2015.10.014
Keywords: severe accident, molten pool, coolability, core catcher, simulation
Citation: Zhang L, Guo P, Yuan Y, Liang Y, Guo Y, Li W, Guo Q and Ma W (2022) Numerical simulation of natural convection and heat transfer in a molten pool with embedded cooling tubes. Front. Energy Res. 10:892592. doi: 10.3389/fenrg.2022.892592
Received: 09 March 2022; Accepted: 25 August 2022;
Published: 26 September 2022.
Edited by:
Luteng Zhang, Chongqing University, ChinaReviewed by:
Yapei Zhang, Xi’an Jiaotong University, ChinaCopyright © 2022 Zhang, Guo, Yuan, Liang, Guo, Li, Guo and Ma. This is an open-access article distributed under the terms of the Creative Commons Attribution License (CC BY). The use, distribution or reproduction in other forums is permitted, provided the original author(s) and the copyright owner(s) are credited and that the original publication in this journal is cited, in accordance with accepted academic practice. No use, distribution or reproduction is permitted which does not comply with these terms.
*Correspondence: Yidan Yuan, eWlkYW55dWFuMjAxMEBhbGl5dW4uY29t
Disclaimer: All claims expressed in this article are solely those of the authors and do not necessarily represent those of their affiliated organizations, or those of the publisher, the editors and the reviewers. Any product that may be evaluated in this article or claim that may be made by its manufacturer is not guaranteed or endorsed by the publisher.
Research integrity at Frontiers
Learn more about the work of our research integrity team to safeguard the quality of each article we publish.