 Yaopeng Gong
 Li Zhang
 Yidan Yuan
 Qiang Guo
 Weimin Ma
 Shanfang Huang
95% of researchers rate our articles as excellent or good
Learn more about the work of our research integrity team to safeguard the quality of each article we publish.
Find out more
ORIGINAL RESEARCH article
Front. Energy Res. , 11 May 2022
Sec. Nuclear Energy
Volume 10 - 2022 | https://doi.org/10.3389/fenrg.2022.892406
This article is part of the Research Topic Experimental and Analytical Investigations on Nuclear Reactor Safety, Severe Accident Phenomena and Severe Accident Mitigation of Nuclear Power Plants View all 20 articles
Thermophysical properties of molten core materials (corium) are necessary input parameters of models and computer codes which predict the severe accident progression in light water reactors. The corium contains the components of UO2, ZrO2, Zr and Fe. The measurement of molten corium properties is a very challenging task due to high melting points of corium which can reach 3000 K. This paper presents a density measurement system for a molten drop based on techniques of aerodynamic levitation, laser heating and image processing. A sphere of alumina was firstly levitated by argon gas flow above a conical converging-diverging nozzle. The sphere was then heated up and melted into a liquid drop by a laser beam. The shape of the drop was recorded by a high-speed camera, and the density was calculated from image processing.
Thermophysical properties of core melt (corium) are basic input parameters for physical models and computer codes which are developed to simulate severe accident phenomena of risk importance in light water reactors (Sehgal, 2011). Thermophysical properties of corium are also needed to assess the effectiveness of mitigation strategies, such as in-vessel (Kymäläinen et al., 1997) and ex-vessel (Fischer, 2004) melt retentions, which are preferred in advanced light water reactors. Due to high temperatures, molten corium properties are scarce, and extrapolation data (even from solid state) of corium have been used so far.
The corium contains the components of UO2, ZrO2, Zr and Fe, among which the molten oxides can reach the temperature of around 3000 K. Conventional measurement methods for thermophysical properties of molten oxides include the sessile drop method (Stalder et al., 2010) and the rotating bob method (Abalin et al., 2000), but both are hampered by interactions between sample and substrate at high temperatures. Thus, contactless methods, such as electromagnetic levitation (EML) (Bojarevics and Pericleous, 2003; Etay et al., 2008; Mohr et al., 2019), electrostatic levitation (ESL) (Rhim et al., 1999; Paradis et al., 2004; Paradis and Ishikawa, 2005; Tamaru et al., 2018), acoustic levitation (AL) (Trinh et al., 1988; Bayazitoglu and Mitchell, 1995; Ansari Hosseinzadeh and Holt, 2017; Kremer et al., 2018), gas-film levitation (GFL) (Barbé et al., 1999; Haumesser et al., 2002; Grishchenko and Piluso, 2011), aerodynamic levitation (ADL) (Granier and Heurtault, 1983; Coutures et al., 1994; Glorieux et al., 1999; Millot et al., 2008; Langstaff et al., 2013; Benmore and Weber, 2017; Kondo et al., 2019) and hybrid levitation (Weber et al., 1994; Ishikawa et al., 2006), are developed for measurements of material samples above 1800 K to avoid sample-substrate interactions.
In the EML method, an inhomogeneous electromagnetic field is generated in a coil and the sample with eddy currents is levitated via Lorentz force. Since the electromagnetic field is used for both levitation and heating of the sample, metallic materials with significant electrical conductivities are applicable in this method. This method is generally implemented under microgravity for viscosity measurement and under normal gravity for surface tension measurement since viscosity measurement is more sensitive to gravity (Mohr et al., 2019). The main drawback is that the interactions between the electromagnetic field and induced current in liquid metal disturb the measurements of surface tension and viscosity (Bojarevics and Pericleous, 2003; Etay et al., 2008).
For the ESL method, a charged sample is levitated by an electrostatic field via Coulomb force. Metallic materials are chargeable (Paradis and Ishikawa, 2005) while oxidic materials are impossible to be charged at low temperatures through hot electron effects and very time-consuming through UV photoelectric effects (Paradis et al., 2014). Besides, the charged surface may change the shape of the drop, which complicates the measurements of surface tension and viscosity, even though heating and levitation are separated.
Electric conductivity of a sample is not required for the AL method, and stable suspension of even irregular objects can be achieved in a well-designed acoustic field (Andrade et al., 2018). The acoustic force is used to counteract gravity in gas. However, the axial force is several times greater than the radial force, which results in large deformation of the molten sample. Besides, a high-density sample requires a greater acoustic intensity which may lead to strong surface oscillations causing droplet atomization and fragmentation.
For the GFL method, inert gas flows through a porous membrane to levitate the sample of a fairly large mass (up to 200 g for an oxide sample). The porous membrane with a concave is designed to guarantee levitation stability. Various empirical correlations are used to correct the influence of the large sample deformation, which results in lower measurement accuracy (Grishchenko and Piluso, 2011).
For the ADL method, the sample is levitated by gas in a conical converging-diverging nozzle proposed by Nordine (Nordine and Atkins, 1982) in which Bernouilli force stabilizes the sample to the nozzle axis. The ADL method relaxes the requirements of materials and only volatile materials are inapplicable. Many pioneering works on ADL have been focused on structural studies of liquids and glasses combined with Nuclear Magnetic Resonance and synchrotron radiation techniques (Benmore and Weber, 2017). The ADL method has the potential applied in the studies on thermophysical properties, glass forming and oxidation/reduction reactions due to its convenience, simplicity and low cost. Molten sample motion induced by gas flow has an impact on measurement, which is a technical difficulty needed to solve.
The hybrid levitation method combines two contactless methods such as aero-acoustic levitation (Weber et al., 1994) and electrostatic-aerodynamic levitation (Ishikawa et al., 2006) for better levitation stability. The levitation force is mainly provided by gas flow, and the acoustic or Lorentz force is used for levitation stability and position control. The high stability is obtained at the expenses of complex devices and high costs.
Since the melting points of corium components are so high that the container wall substrate is prone to interact with the molten sample, making the contact methods unsuitable for the property measurements of corium components. Among the contactless methods, EML and ESL are only applicable for metallic materials with good electric conductivity, while AL is difficult to provide both sufficient levitation force and stability at high temperatures. The GFL method has low stability at very high temperatures up to 3000 K. Therefore, the ADL method is selected in the present study to measure the properties of molten corium components due to its low requirements of sample materials, simplicity and low cost.
This paper firstly presents the experimental setup designed to measure the thermophysical properties of corium components. Secondly, the principles of density measurement and the commissioning of the setup are described. Alumina as the simulant of UO2/ZrO2 is employed in the commissioning which includes sample preparation, high-speed camera calibration and levitation stabilization. Finally, density measurement results are provided.
The experimental setup, named ALSEE (Aerodynamic Levitation-laSEr hEating installation for melt properties), is illustrated in Figure 1. It is designed for the measurements of thermophysical properties of molten corium components (UO2/ZrO2/Zr/Fe and their mixtures), including density, surface tension and viscosity. The ALSEE test facility is composed of an aerodynamic levitation system, laser heating system, image recording system, temperature measurement system, acoustic excitation system and data acquisition system (DAS). The first four systems and DAS have been built, which are sufficient for density measurement. The acoustic excitation system under installation is intended for the measurements of surface tension and viscosity.
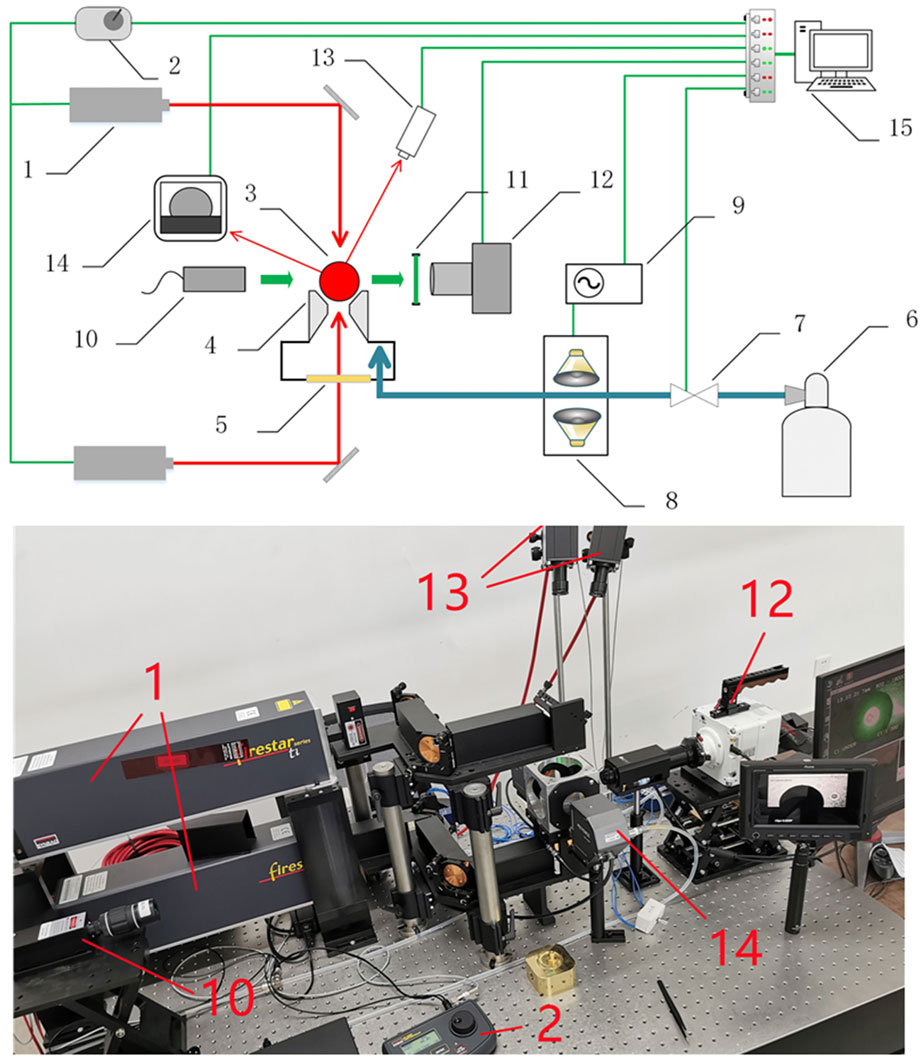
FIGURE 1. Schematic view and picture of the ALSEE experimental setup: 1- CO2 laser, 2- laser controller, 3- levitated sample, 4- conical converging-diverging nozzle, 5- ZnSe window, 6- argon gas tank, 7- gas flow controller, 8- loudspeakers, 9- waveform generator, 10- backlighting laser, 11- narrow-band filter, 12- high-speed camera, 13- bichromatic pyrometers, 14- 2D optical micrometer, 15- data acquisition system.
The aerodynamic levitation system consists of an aerodynamic levitator, a gas flow controller (KOFLOC EX250SC), and a 2D optical micrometer (Keyence TM-3000). Located in the center of the levitator is a conical converging-diverging nozzle to levitate a sample sphere of 2–3 mm in diameter. The argon gas stored in a high-pressure gas tank is depressurized to about 200 KPa and reaches the nozzle for sample levitation. The gas flow controller enables fine regulations of argon gas flowrate. To monitor and improve the sample levitation stability, a 2D optical micrometer is placed on the horizontal side of the sample sphere to measure the levitation height. The argon gas flowrate can be accordingly adjusted to improve the stability.
The laser heating system consists of two CO2 laser devices (Synrad ti-100HS) and their laser-beam delivery optics. The two 100 W CO2 laser devices controlled by a laser controller (Synrad UC 2000) are placed as such that they heat both the lower and the upper sides of the sample (see Figure 1). Each device emits a laser beam with a wavelength of 10.6 μm and a diameter of 2 mm. Two laser beams are guided to the sample via flat mirrors and focusing lenses. Since the lower laser beam passes through the gas channel, a ZnSe window transparent to the 10.6 μm laser beam is installed under the levitator.
High stability (2%) of the laser output power is necessary to the fine temperature regulations, and the heating efficiency is as high as practically achievable. The laser beam with the wavelength of 10.6 μm is favorable to absorption of oxidic materials. Two waveplates are inserted into the optical paths to convert linearly polarized beams into circularly polarized beams.
The image recording system consists of a high-speed camera (Phantom VEO440L), a zoom lens (Movetem MAZ12.0×LZ), a backlighting laser (CNI MGL-III-532) and a narrow-band filter. The high-speed camera equipped with the zoom lens has a magnification of 14 and a working distance of 85 mm, which makes full use of camera pixels.
The backlighting laser is employed in a shadow photography system in which the backlighting laser with a beam expander is positioned on the opposite side of the high-speed camera with the narrow-band filter installed in front of the camera lens. The shutter speed of the camera is therefore independent of temperature of the sample, and sharp edges of the sample can be obtained from the images.
Since the shadow photography system has not been ready yet, the present study uses conventional photography in which the direct images of the incandescent sample at high temperatures are recorded. The higher the temperature, the brighter the sample. This means the shutter speed of the camera has to be adjusted to obtain reasonable images at different temperatures.
The sample temperature is measured with two bichromatic pyrometers (Sensortherm H311), one with the measuring range of 1173–2073 K (0.75–0.93 μm and 0.93–1.1 μm), and the other 1873–3573 K (0.78 and 0.99 μm) with the measurement uncertainty of 0.5%. A programmable temperature controller (Sensortherm Regulus RD) integrates the temperature ranges of these two pyrometers and is connected to the laser controller, achieving fast temperature measurement and control. When the molten sample is heated by lasers which are indirectly controlled by the temperature controller, the temperature fluctuation is below 10 K. The pyrometers measure the spectral radiance of the sample at two selected wavelengths (signals are collected by two separate channels, respectively) and calculate the ratio. The influence of the argon gas around the sample is negligible since the ratio is almost unchanged even though both the two signals are changed.
The acoustic excitation system consists of a waveform generator and a group of loudspeakers. The waveform generator generates sinusoidal voltages of various frequencies which are transmitted to the loudspeakers. The loudspeakers are coupled to the argon gas pipeline. Therefore, the sound wave generated from the loudspeakers can be imposed on the molten sample through the argon gas. The molten sample is excited by the sound wave and the surface begins to vibrate. The resonance frequency can be found by measuring the vibration amplitude of the molten sample at different frequencies, and then the surface tension can be derived. Viscosity is finally calculated from the decay constant when loudspeakers working at the resonance frequency stop and the damped oscillations of the molten sample start. The acoustic excitation system is under installation and intended for measurements of surface tension and viscosity.
The density is the ratio of mass to volume of the sample. The mass of the sample is measured with an electronic balance and the volume is obtained from the images recorded by the high-speed camera. In the beginning, a sample is levitated above the conical nozzle and heated by the upper laser. Then the sample melts into a liquid drop. The images of the sample are recorded by the camera, and image processing is performed frame by frame with a software program written in MATLAB. The surface profile of the drop is determined through an image edge detection technique. Since the drop appears ellipsoidal, its center as well as semi-major axis and semi-minor axis are determined by an ellipse fitting algorithm. Based on these data, the density is calculated with the following equation:
where
Previous studies have shown that the Canny edge detection algorithm generally performs better than other operators such as Sobel, Robert, Prewitt, Laplacian, and Laplace of Gaussian (Maini and Aggarwal, 2009). A common Canny edge detection algorithm includes the following four steps: 1) a Gaussian filter is used to smooth the original image which eliminates the noise; 2) the edges including gradient intensity and gradient direction of the image are calculated by the first-order difference method with the Canny operator; 3) the Non-Maxima Suppression is performed so that only the points with the largest local gradient are retained; and 4) the double threshold algorithm is used to detect and connect the edges. The edge function using the Canny operator in MATLAB is preferred because it improves the Canny operator and threshold value.
In this paper, least-squares fitting based on algebraic distances is performed using the pseudo inverse technique (Zhang, 1997). A 2-D elliptic equation can be described as follows:
A common practice is to minimize the algebraic distance, which means to minimize the following function:
When the normalization of A + C = 1 is considered, the elliptic equation becomes:
Therefore, the elliptic equation can be described by a vector p:
For a point
Then, the elliptic equation becomes:
Given n points, the following matrix yields:
The function to minimize becomes:
Obtaining its partial derivative with respect to p and setting it to zero yield:
The solution is:
Therefore, elliptical parameters including A, B, C, D, E, and F are all known. Finally, the semi-major and semi-minor axes are determined as follows:
The measurement uncertainty of density mainly comes from uncertainties of the sample mass and volume according to Eq. 1. Mass is determined by the electronic balance which has the uncertainty of 0.05 mg for a sample of 19.69 mg. Since the semi-major and semi-minor axes of the ellipsoidal sample are obtained from image processing of the sample images, the measurement uncertainties of the semi-major and semi-minor axes can be considered, which are about 4.4 pixels within 690 pixels and 3.5 pixels within 670 pixels. According to Eq. 1, the accuracy of density measurement is 1.40%.
Some uncertainties in the measurement are not quantifiable such as the distortion of the photography of an incandescent object and the departure from the ellipsoidal assumption. The first influencing factor can be resolved through the shadowgraphy which will be implemented. However, caution must be paid to the possible deviation from an ellipsoidal shape, since the ellipsoidal shape may be affected not only by the joint forces of gravity and argon gas flow, but also by the temperature gradient inside the sample.
Powders or irregular objects can be melted into a nearly spherical sample by laser heating in a device called the laser hearth melter. The laser hearth melter is made of copper and the structure is shown in Figure 2. Oxide samples with a diameter of 2–3 mm can be made by the laser hearth melter. According to previous studies, the induced impurities are negligible (Richard Weber et al., 1996).
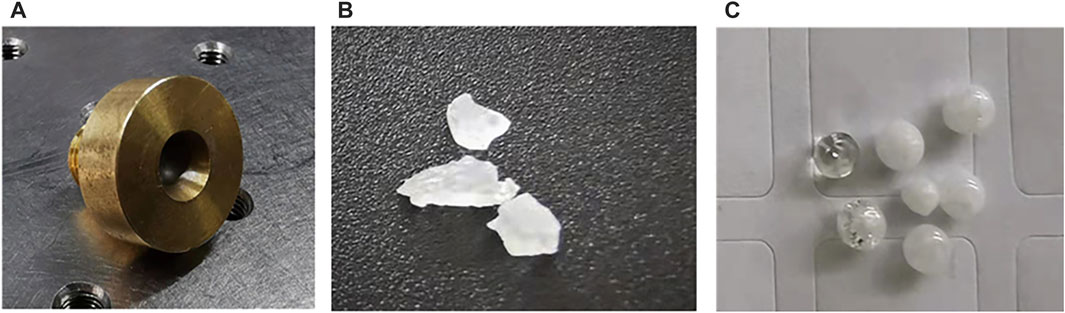
FIGURE 2. Preparation of alumina samples: (A) laser hearth melter. (B) irregular alumina objects. (C) alumina samples prepared by the laser hearth melter.
About 20 mg of alumina (99.9% purity) was put in the concave of the laser hearth melter and was heated into a liquid drop by the upper laser. A nearly spherical shape was formed due to surface tension. After the laser was turned off, the sample was solidified and homogenized by turning it over and remelting it. The alumina samples prepared by the laser hearth melter are also shown in Figure 2. When the laser power is gradually reduced to zero, the alumina drop can crystallize to form a transparent bead.
The sample diameter determined by the image processing is represented by pixels, so it is necessary to convert pixels to standard length units. Standard stainless-steel spheres with diameters of 2.0 and 2.5 mm were used in the calibration where the standard spheres were loaded on the nozzle and photographed by the camera. To improve measurement accuracy, the camera was set up with the maximum resolution of 2,560 × 1,600 pixels. The calibration for the relationship of pixel with micrometer given in Table 1 is obtained through the comparison of the pixels with accurate diameters of the standard spheres.
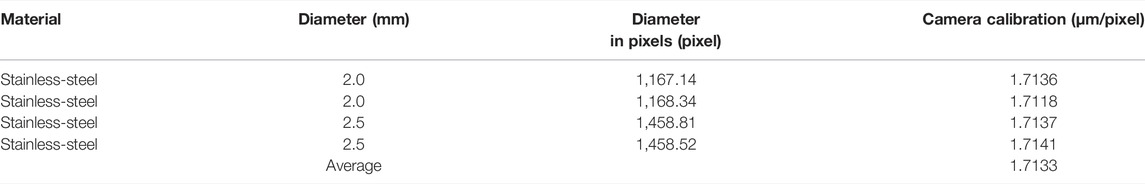
TABLE 1. High-speed camera calibration.
An alumina sample was firstly placed on the conical nozzle and levitated by argon gas flow. When the argon gas flowrate was about 0.4 L/min, there formed a gap of about 50 μm between the sample and the nozzle wall at ambient temperature without laser heating. The sample position fluctuation was monitored by the 2-D optical micrometer. When the sample was heated to 3333 K, the sample position fluctuation was determined by image processing results of the images recorded by the high-speed camera since the micrometer couldnot work when the sample was highly luminous. It turned out that the sample position fluctuation was below 10 μm at 298 K and 3333 K, as depicted in Figure 3. Though levitation instability was found when the sample was heated and melting, levitation stability resumed after the sample was entirely molten, i.e., after the formation of a drop at a prescribed temperature. Compared with the position fluctuations of 100 μm in an ESL experiment (Tamaru et al., 2018) and 40 μm in an ADL experiment (Krishnan et al., 1997), levitation stability in the present study is improved with the optimized nozzle.
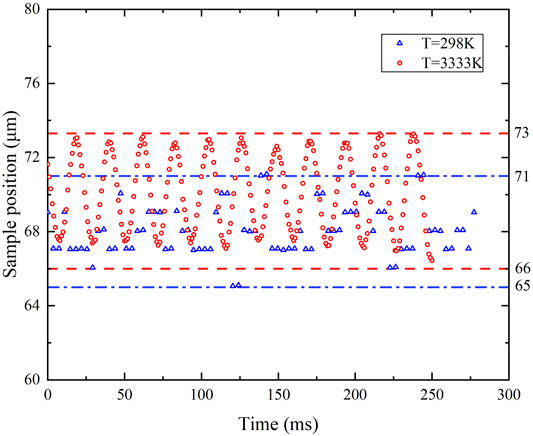
FIGURE 3. Sample fluctuating upward and downward the equilibrium position in 6 μm at 298 K and 7 μm at 3333 K (the y-axis is offset for zoom-in view).
At ambient temperature, the levitation is stable since the argon gas flow in the conical nozzle is laminar. When the upper laser is turned on for heating, the sample position fluctuation can reach about 200 μm since the thermal conductivity of the solid-state alumina sample is small, resulting in a large asymmetric temperature gradient. Therefore, the argon temperature field around the sample surface is also asymmetric which deteriorated the levitation stability.
During the melting of an alumina sample as shown in Figure 4, the solid and liquid parts coexist. The irregular shape of the melting sample will change the mass center, weakening levitation stability. When the sample starts to melt from the upper part to the lower part, the melting process is potentially stable, since the newly melted liquid part with lower temperature and higher density stays at the solid-liquid interface. If the sample is heated by the lower laser, it will start to melt from the lower part to the upper part, the newly melted liquid part with lower temperature and higher density will move to the bottom. The flow inside the liquid part will deteriorate the stability. Therefore, only the upper laser is used for sample melting to ensure levitation stability.
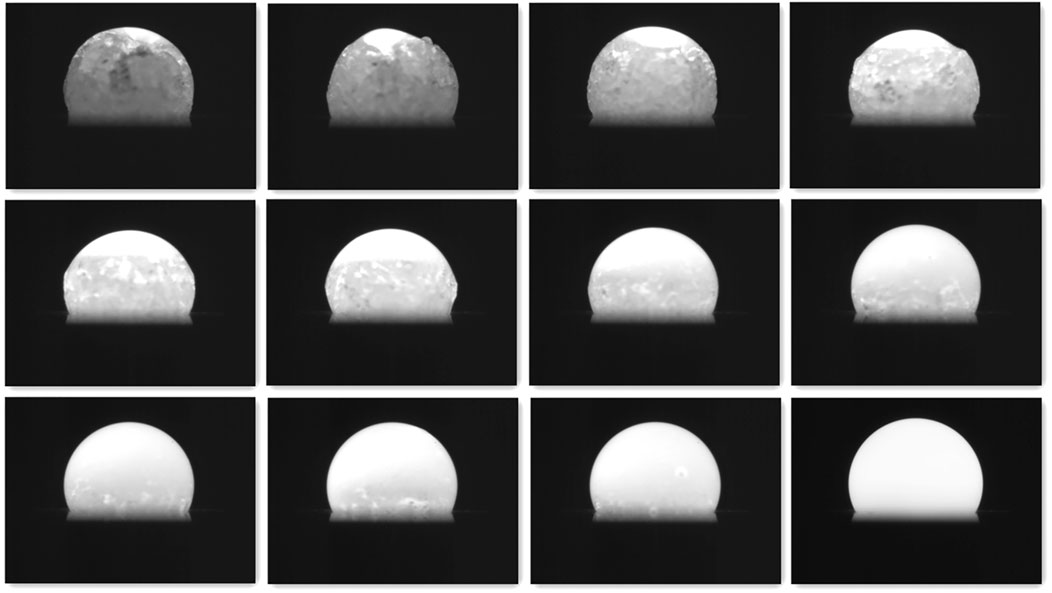
FIGURE 4. Melting process of the alumina sample heated by the upper laser. Lower part of the sample is hidden by the conical nozzle.
When an alumina sphere is entirely molten and the temperature is above 2300 K, the levitation of the drop is stable. This can be related to the increase in thermal conductivity and improvement of temperature uniformity. Besides, due to the decrease in density and increase in viscosity of argon gas around the sample, Reynolds number is less than 1/6 of that at ambient temperature which further improves the stability (Paradis et al., 1996).
Density measurement was conducted in the cooling process of the alumina sample after the sample was levitated, heated to 3333 K and stabilized for seconds. The cooling process was induced by the sudden shutdown of the heating laser. The camera was set up to record at 1,000 fps with a resolution of 2,560 × 1,600 pixels. The temperature was synchronously recorded by pyrometers.
The temperature history of the cooling process and sample images at different stages are shown in Figure 5. A sudden temperature rise is found while the recalescence phenomenon is recorded when the sample solidifies. In the sample images, the ellipse edge, major axis and minor axis determined by image processing are all plotted. The whole morphology of the molten drop is difficult to obtain due to the nozzle shielding. Therefore, it is difficult to evaluate the joint effects of gravity and argon gas flow shearing on the drop morphology. Nevertheless, the sample images show that the visible part of the liquid drop agrees well with the ellipsoidal assumption. Therefore, it is reliable to calculate the drop volume based on the ellipsoidal assumption.
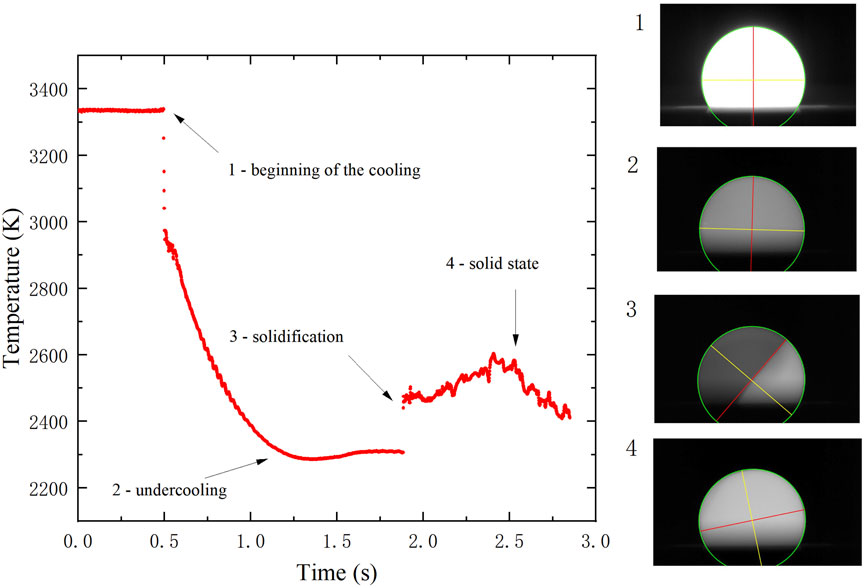
FIGURE 5. Temperature history and images of an alumina sample during the cooling process induced by shutdown of the heating laser.
The sample mass before and after the experiment is measured to be 19.82 and 19.69 mg. This is because the heating of the sample takes a few minutes, and the highest temperature 3333 K has exceeded the boiling point of alumina (3240 K), resulting in large evaporation and mass loss before the cooling process. On the other hand, since the cooling process takes less than 5 s, the mass loss during this period is negligible. Hence, the mass of 19.69 mg is used to calculate the density.
The temperature-dependent density measured in the present study is depicted in Figure 6, where the data measured by the ADL and ESL methods (Glorieux et al., 1999; Paradis et al., 2004; Langstaff et al., 2013; Tamaru et al., 2018; Kondo et al., 2019) are also plotted for comparison. More related data measured by various contact and contactless methods are given in Table 2. The relationship between density and temperature for the temperature range of 2300 K < T < 3000 K obtained in the present study can be fitted by the following equation:
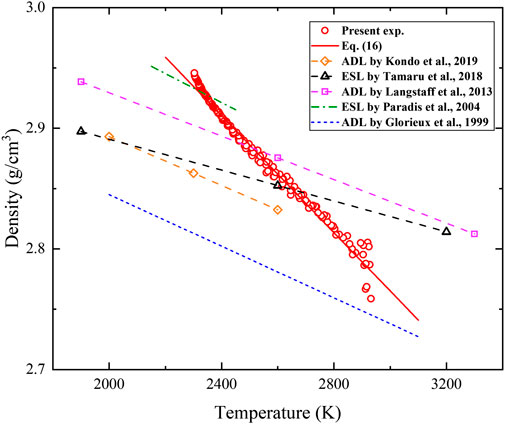
FIGURE 6. Temperature-dependent density of liquid alumina. Density and temperature data of the present experiment have error bars of 1.40% and 0.5% respectively.
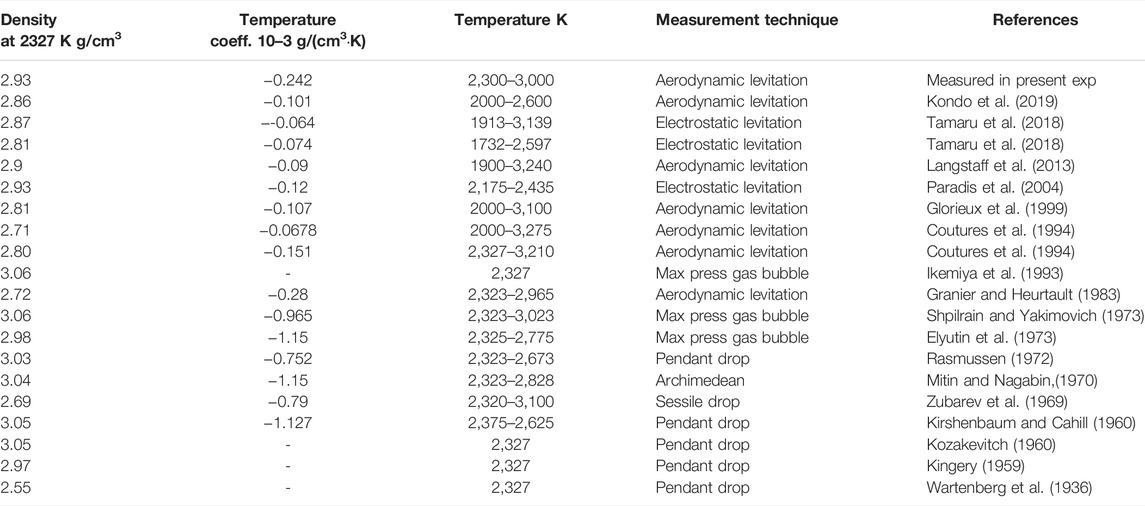
TABLE 2. Liquid alumina density in literatures.
Large fluctuations in the density measurement are found at the beginning of the cooling process. This is because the rapid thermal transient upon the shutdown of the laser results in a sudden position change as shown in Figure 7. The sample is positioned well in the horizontal direction, but moves down about 40 μm in 15 ms since the sample volume decreases with reducing temperature. The argon gas flow induced velocity and pressure changes quickly, producing disturbance of the sample surfaces as shown in Figure 8. The downward displacement may firstly elongate and then flatten the alumina drop, resulting in the decrease and then increase of the semi-major axis. The disturbance gradually disappears when a stable levitation is successfully re-established. Therefore, measured data between 3000 and 3333 K is not used due to poor accuracy.
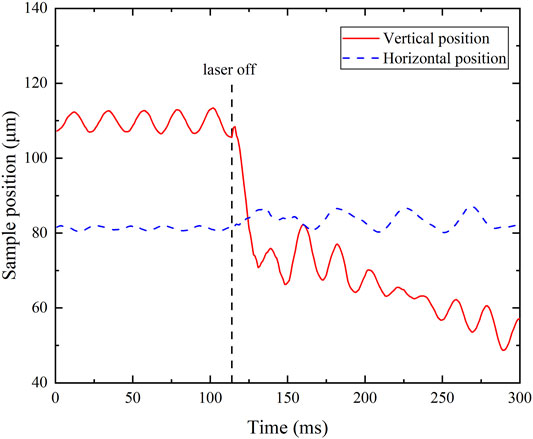
FIGURE 7. Position change after turning the upper laser off (the y-axis is offset for zoom-in view).
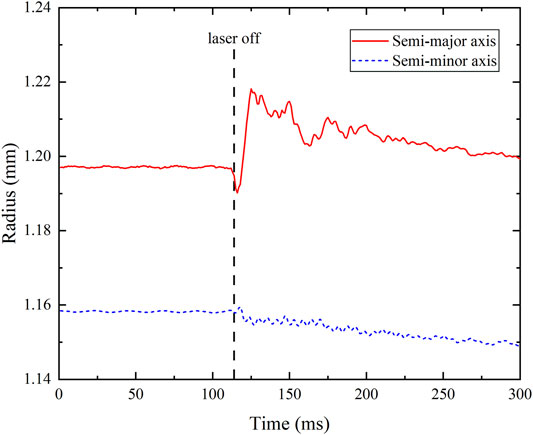
FIGURE 8. Radius change after turning the upper laser off.
When the temperature is lower, alumina density is overestimated with a fixed shutter time of the camera, which is a common phenomenon for the conventional photography of an incandescent object. In the image edge detection code, the edge of the liquid drop is determined by the gradient of gray value in the sample images. A threshold is set in the Canny algorithm to recognize the edge. When the gradient is greater than the threshold, it is considered as the edge. During the cooling process. the lightness of the liquid drop decreases before solidification (see Figure 5). The gradient is then smaller overall at lower temperatures. However, the threshold does not change, causing the detected edge moves towards the inside of the sample. Hence, the drop volume is underestimated and the density is overestimated. The edge movement is related to the temperature of the sample and the shutter time of the camera. Therefore, the detected edge movement accounts for the higher temperature coefficient of density in the present study. Besides, results may be different with different shutter times due to this common phenomenon. Shadowgraphy will be implemented to eliminate the effects of image brightness changes in future work. The background will be bright and the liquid drop will be black in sample images when a backlighting laser and a narrow-band filter are used. The brightness of the images is then independent of temperature during the cooling process. Nevertheless, conventional photography is still of great value and permits to visualize both the presence of impurities and the surface conditions, which can be used to investigate the solidification after undercooling.
In addition to the accuracy of the instruments, there are still multiple factors that affect the measurement accuracy. In the present study, the sample top side is heated by a single laser while the bottom side is not heated. Temperature gradient of a few hundred Kelvin is expected and may lead to a density gradient within the sample. The joint effect of gravity and argon gas flow shearing on drop morphology is still hard to estimate since lower part of the sample is hidden by the conical nozzle. The sample volume calculated by image processing of the visible portion based on 2-D ellipse fitting will also be affected. Besides, the pyrometers focus on the top side of the sample, which overestimate the sample temperature.
As shown in Table 2, a large density disparity exists between results obtained by contact methods. For example, the density at 2327 K of alumina, is 3.06 g/cm3 in (Ikemiya et al., 1993) and 2.55 g/cm3 in (Wartenburg et al., 1936). These contact measurements are quite old and are greatly affected by sample contamination. This may also account for the large disparity between the contact and contactless methods. Among the contactless methods, the density measured by Glorieux et al. (1999) is significantly lower. The reason may be that the sample is imaged from the top and assumed to be spherical, while the liquid alumina is closer to the ellipsoid under gravity and gas flow shearing. For example, the semi-major axis is about 3.4% longer than the semi-minor axis for the alumina drop at 3333 K (see Figure 8). Ignoring the influence of asphericity may overestimate the volume and underestimate the density of the sample. The density measured by Paradis et al. (2004) is higher instead. The reason may be the high-vacuum conditions. The liquid drop may become unstable due to sample evaporation. Another reason may be the low camera resolution. Work by Tamaru et al. (2018) is done under microgravity. Voids may form within the sample and are difficult to be removed, which may cause errors. Considering the 1.40% error bar of density (calculated based on mass and radius uncertainties) in the present study, good agreement is found with previously reported data measured by the ADL and ESL methods.
The liquid drop may rotate when levitated by argon gas flow. The higher the flow rate, the faster the rotation speed. When the levitation is well controlled, the deviation of the rotation axis from the vertical direction is small. However, when the temperature is close to the boiling point, or some large disturbance is introduced externally, the levitation becomes less stable and the deviation angle becomes larger. The destruction of flow field symmetry will lead to large measurement errors. Therefore, when a large deviation angle from the vertical direction during the cooling process occurs, another experiment is suggested for more accurate results. If the drop accidentally sticks to the nozzle wall during the measurement, the experiment needs to be terminated and restarted after cleaning the nozzle.
This paper presents an experimental setup (ALSEE) developed at CNPE for measurements of density, surface tension and viscosity of molten corium components based on aerodynamic levitation and laser heating. A conical converging-diverging nozzle is optimized to realize stable levitation at both ambient and high temperatures. The alumina density is measured during the cooling process upon the shutdown of laser heating after the drop is heated to 3333 K. Image processing including image edge detection and ellipse fitting is performed to calculate the volume of the ellipsoidal drop assumed in the present study.
In the present study, the alumina density is 2.929 g/cm3 at the melting point of 2327 K, with the temperature coefficient of −2.421 × 10⁻⁴ g/(cm3·K) from 2,300 to 3000 K. The uncertainty of density is 1.40%. Good agreement is found with other reported density data. The ellipsoidal assumption of the liquid drop levitated by the conical nozzle is confirmed to be reliable to calculate its volume. Large fluctuations at the beginning of the cooling process can be related to the rapid thermal transient upon the shutdown of the laser. Conventional photography of an incandescent object accounts for the higher temperature coefficient of density. Temperature gradient and deviation from the ellipsoidal shape also contribute to measurement errors.
Future research will focus on reducing measurement uncertainty which is mainly due to the volume overestimation of the sample photography of an incandescent object, the large temperature gradient by laser heating and the ellipsoidal assumption. The shadowgraphy will be used in the future with a backlighting laser and a narrow-band filter. The dual laser heating method will be used to reduce the temperature gradient. Finally, Measurements of density, surface tension and viscosity of corium components will be conducted when the acoustic excitation system is ready.
The raw data supporting the conclusion of this article will be made available by the authors, without undue reservation.
Experiment design and operation are finished by YG and LZ. Many suggestions are provided by QG. The experiment and paper writing is guided by YY, WM, and SH.
This work was supported by National Key R&D Program of China (Grant No. 2018YFB1900100).
Authors YG, LZ, YY, and QG were employed by the company China Nuclear Power Engineering Co., Ltd.
The remaining authors declare that the research was conducted in the absence of any commercial or financial relationships that could be construed as a potential conflict of interest.
This work was commercially supported by China Nuclear Power Engineering Co., Ltd apart from National Key R&D Program of China (Grant No. 2018YFB1900100) and was approved to be published by China Nuclear Power Engineering Co., Ltd without any conflict of interest.
All claims expressed in this article are solely those of the authors and do not necessarily represent those of their affiliated organizations or those of the publisher, the editors, and the reviewers. Any product that may be evaluated in this article, or claim that may be made by its manufacturer, is not guaranteed or endorsed by the publisher.
Abalin, S. S., Asmolov, V. G., Daragan, V. D., D’yakov, E. K., Merzlyakov, A. V., and Vishnevsky, V. Y. (2000). Corium Kinematic Viscosity Measurement. Nucl. Eng. Des. 200, 107–115. doi:10.1016/s0029-5493(00)00238-7
Andrade, M. A. B., Pérez, N., and Adamowski, J. C. (2018). Review of Progress in Acoustic Levitation. Braz J. Phys. 48, 190–213. doi:10.1007/s13538-017-0552-6
Ansari Hosseinzadeh, V., and Holt, R. G. (2017). Finite Amplitude Effects on Drop Levitation for Material Properties Measurement. J. Appl. Phys. 121, 174502. doi:10.1063/1.4982908
Barbé, J.-C., Parayre, C., Daniel, M., Papoular, M., and Kernevez, N. (1999). High-Temperature Containerless Viscosity Measurement by Gas-Film Levitation. Int. J. Thermophys. 20, 1071–1083. doi:10.1023/a:1022698619162
Bayazitoglu, Y., and Mitchell, G. F. (1995). Experiments in Acoustic Levitation - Surface Tension Measurements of Deformed Droplets. J. Thermophys. Heat Transf. 9, 694–701. doi:10.2514/3.726
Benmore, C. J., and Weber, J. K. R. (2017). Aerodynamic Levitation, Supercooled Liquids and Glass Formation. Adv. Phys. X 2, 717–736. doi:10.1080/23746149.2017.1357498
Bojarevics, V., and Pericleous, K. (2003). Modelling Electromagnetically Levitated Liquid Droplet Oscillations. ISIJ Int. 43, 890–898. doi:10.2355/isijinternational.43.890
Coutures, J., Rifflet, J.-C., Florian, P., and Massiot, D. (1994). A Thermal-Analysis and Very High-Temperature Al-27 NMR-Study of the Solidification Behavior in Contactless Conditions of Liquid Alumina-Alumina–Effects of the Melt Temperature and Oxygen Partial-Pressure. Revue Int. des Hautes Temp. des Refract. 29, 123–142.
Elyutin, V., Mitin, B., and Anisimov, Y. S. (1973). Surface Tension and Density of Al 2 O 3-BeO Melts, Izvestiya Akademii Nauk SSSR. Neorganicheskie Mater. 9, 1585–1587.
Etay, J., Schetelat, P., Bardet, B., Priede, J., Bojarevics, V., and Pericleous, K. (2008). Modelling of Electromagnetic Levitation - Consequences on Non-contact Physical Properties Measurements. High Temp. Mater. Process. 27, 439–448. doi:10.1515/htmp.2008.27.6.439
Fischer, M. (2004). The Severe Accident Mitigation Concept and the Design Measures for Core Melt Retention of the European Pressurized Reactor (EPR). Nucl. Eng. Des. 230, 169–180. doi:10.1016/j.nucengdes.2003.11.034
Glorieux, B., Millot, F., Rifflet, J.-C., and Coutures, J.-P. (1999). Density of Superheated and Undercooled Liquid Alumina by a Contactless Method. Int. J. Thermophys. 20, 1085–1094. doi:10.1023/a:1022650703233
Granier, B., and Heurtault, S. (1983). Method for Measuring the Density of Liquid Refractories-Aapplications to Alumina and Yttrium Oxide. Revue Int. des Hautes Temp. des Refract. 20, 61–67.
Grishchenko, D., and Piluso, P. (2011). Recent Progress in the Gas-Film Levitation as a Method for Thermophysical Properties Measurements: Application to ZrO2-Al2O3 System. High Temp. High Press 40, 127–149.
Haumesser, P. H., Garandet, J. P., Bancillon, J., Daniel, M., Campbell, I., and Jackson, P. (2002). High Temperature Viscosity Measurements by the Gas Film Levitation Technique: Application to Various Types of Materials. Int. J. Thermophys. 23, 1217–1228. doi:10.1023/a:1019892220523
Ikemiya, N., Umemoto, J., Hara, S., and Ogino, K. (1993). Surface Tensions and Densities of Molten Al2O3, Ti2O3, V2O5 and Nb2O5. ISIJ Int. 33, 156–165. doi:10.2355/isijinternational.33.156
Ishikawa, T., Yu, J., and Paradis, P.-F. (2006). Noncontact Surface Tension and Viscosity Measurements of Molten Oxides with a Pressurized Hybrid Electrostatic-Aerodynamic Levitator. Rev. Sci. Instrum. 77, 053901. doi:10.1063/1.2198787
Kingery, W. D. (1959). Surface Tension of Some Liquid Oxides and Their Temperature Coefficients. J Am. Ceram. Soc. 42, 6–10. doi:10.1111/j.1151-2916.1959.tb09134.x
Kirshenbaum, A. D., and Cahill, J. A. (1960). The Density of Liquid Aluminium Oxide. J. Inorg. Nucl. Chem. 14, 283–287. doi:10.1016/0022-1902(60)80272-2
Kondo, T., Muta, H., Kurosaki, K., Kargl, F., Yamaji, A., Furuya, M., et al. (2019). Density and Viscosity of Liquid ZrO2 Measured by Aerodynamic Levitation Technique. Heliyon 5, e02049. doi:10.1016/j.heliyon.2019.e02049
Kozakevitch, P. (1960). Viscosité et éléments structuraux des aluminosilicates fondus : laitiers CaO-AI2O3-Sio2 entre 1 600 et 2 100 °C. Rev. Mater. Paris 57, 149–160. doi:10.1051/metal/196057020149
Kremer, J., Kilzer, A., and Petermann, M. (2018). Simultaneous Measurement of Surface Tension and Viscosity Using Freely Decaying Oscillations of Acoustically Levitated Droplets. Rev. Sci. Instrum. 89, 015109. doi:10.1063/1.4998796
Krishnan, S., Felten, J. J., Rix, J. E., Weber, J. K. R., Nordine, P. C., Beno, M. A., et al. (1997). Levitation Apparatus for Structural Studies of High Temperature Liquids Using Synchrotron Radiation. Rev. Sci. Instrum. 68, 3512–3518. doi:10.1063/1.1148315
Kymäläinen, O., Tuomisto, H., and Theofanous, T. (1997). In-vessel Retention of Corium at the Loviisa Plant. Nucl. Eng. Des. 169, 109–130. doi:10.1016/S0029-5493(96)01280-0
Langstaff, D., Gunn, M., Greaves, G. N., Marsing, A., and Kargl, F. (2013). Aerodynamic Levitator Furnace for Measuring Thermophysical Properties of Refractory Liquids. Rev. Sci. Instrum. 84, 124901. doi:10.1063/1.4832115
Maini, R., and Aggarwal, H. (2009). Study and Comparison of Various Image Edge Detection Techniques. Int. J. Image Process. 3, 1–11.
Millot, F., Sarou-Kanian, V., Rifflet, J.-C., and Vinet, B. (2008). The Surface Tension of Liquid Silicon at High Temperature. Mater. Sci. Eng. A 495, 8–13. doi:10.1016/j.msea.2007.10.108
Mohr, M., Wunderlich, R. K., Koch, S., Galenko, P. K., Gangopadhyay, A. K., Kelton, K. F., et al. (2019). Surface Tension and Viscosity of Cu50Zr50 Measured by the Oscillating Drop Technique on Board the International Space Station. Microgravity Sci. Technol. 31, 177–184. doi:10.1007/s12217-019-9678-1
Nordine, P. C., and Atkins, R. M. (1982). Aerodynamic Levitation of Laser‐heated Solids in Gas Jets. Rev. Sci. Instrum. 53, 1456–1464. doi:10.1063/1.1137196
Paradis, P.-F., Ishikawa, T., Lee, G.-W., Holland-Moritz, D., Brillo, J., Rhim, W.-K., et al. (2014). Materials Properties Measurements and Particle Beam Interactions Studies Using Electrostatic Levitation. Mater. Sci. Eng. R Rep. 76, 1–53. doi:10.1016/j.mser.2013.12.001
Paradis, P.-F., Ishikawa, T., Saita, Y., and Yoda, S. (2004). Non-contact Thermophysical Property Measurements of Liquid and Undercooled Alumina. Jpn. J. Appl. Phys. 43, 1496–1500. doi:10.1143/jjap.43.1496
Paradis, P.-F., and Ishikawa, T. (2005). Surface Tension and Viscosity Measurements of Liquid and Undercooled Alumina by Containerless Techniques. Jpn. J. Appl. Phys. 44, 5082–5085. doi:10.1143/jjap.44.5082
Paradis, P. F., Babin, F., and Gagné, J. M. (1996). Study of the Aerodynamic Trap for Containerless Laser Materials Processing in Microgravity. Rev. Sci. Instrum. 67, 262–270. doi:10.1063/1.1146581
Rasmussen, J. J. (1972). Surface Tension, Density, and Volume Change on Melting of Al2O3 Systems, Cr2O3, and Sm2O3. J Am. Ceram. Soc. 55, 326. doi:10.1111/j.1151-2916.1972.tb11298.x
Rhim, W.-K., Ohsaka, K., Paradis, P.-F., and Spjut, R. E. (1999). Noncontact Technique for Measuring Surface Tension and Viscosity of Molten Materials Using High Temperature Electrostatic Levitation. Rev. Sci. Instrum. 70, 2796–2801. doi:10.1063/1.1149797
Richard Weber, J. K., Felten, J. J., and Nordine, P. C. (1996). Laser Hearth Melt Processing of Ceramic Materials. Rev. Sci. Instrum. 67, 522–524. doi:10.1063/1.1146631
Sehgal, B. R. (2011). Nuclear Safety in Light Water Reactors: Severe Accident Phenomenology. Oxford: Academic Press.
Shpilrain, E., and Yakimovich, K. (1973). Experimental Study of the Density of Liquid Alumina up to 2750 C. High. Temp.-High Press. 5, 191–198.
Stalder, A. F., Melchior, T., Müller, M., Sage, D., Blu, T., and Unser, M. (2010). Low-bond Axisymmetric Drop Shape Analysis for Surface Tension and Contact Angle Measurements of Sessile Drops. Colloids Surfaces A Physicochem. Eng. Aspects 364, 72–81. doi:10.1016/j.colsurfa.2010.04.040
Tamaru, H., Koyama, C., Saruwatari, H., Nakamura, Y., Ishikawa, T., and Takada, T. (2018). Status of the Electrostatic Levitation Furnace (ELF) in the ISS-KIBO. Microgravity Sci. Technol. 30, 643–651. doi:10.1007/s12217-018-9631-8
Trinh, E. H., Marston, P. L., and Robey, J. L. (1988). Acoustic Measurement of the Surface Tension of Levitated Drops. J. Colloid Interface Sci. 124, 95–103. doi:10.1016/0021-9797(88)90329-3
Wartenburg, H., Wehner, G., and Saran, E. (1936). The Surface Tension of Molten Al 2 O 3 and La 2 O 3, Nach. Akad. Wiss. Goettingen 2, 65–71.
Weber, J. K. R., Hampton, D. S., Merkley, D. R., Rey, C. A., Zatarski, M. M., and Nordine, P. C. (1994). Aero‐Acoustic Levitation: A Method for Containerless Liquid‐Phase Processing at High Temperatures. Rev. Sci. Instrum. 65, 456–465. doi:10.1063/1.1145157
Zhang, Z. (1997). Parameter Estimation Techniques: A Tutorial with Application to Conic Fitting. Image Vis. Comput. 15, 59–76. doi:10.1016/s0262-8856(96)01112-2
Keywords: molten drop, density measurement, aerodynamic levitation, laser heating, image processing
Citation: Gong Y, Zhang L, Yuan Y, Guo Q, Ma W and Huang S (2022) Density Measurement of Molten Drop With Aerodynamic Levitation and Laser Heating. Front. Energy Res. 10:892406. doi: 10.3389/fenrg.2022.892406
Received: 09 March 2022; Accepted: 20 April 2022;
Published: 11 May 2022.
Edited by:
Yapei Zhang, Xi’an Jiaotong University, ChinaCopyright © 2022 Gong, Zhang, Yuan, Guo, Ma and Huang. This is an open-access article distributed under the terms of the Creative Commons Attribution License (CC BY). The use, distribution or reproduction in other forums is permitted, provided the original author(s) and the copyright owner(s) are credited and that the original publication in this journal is cited, in accordance with accepted academic practice. No use, distribution or reproduction is permitted which does not comply with these terms.
*Correspondence: Yidan Yuan, eWlkYW55dWFuMjAxMEBhbGl5dW4uY29t
Disclaimer: All claims expressed in this article are solely those of the authors and do not necessarily represent those of their affiliated organizations, or those of the publisher, the editors and the reviewers. Any product that may be evaluated in this article or claim that may be made by its manufacturer is not guaranteed or endorsed by the publisher.
Research integrity at Frontiers
Learn more about the work of our research integrity team to safeguard the quality of each article we publish.