 Yuanjun Li
 Qitao Wu
 Yuling Zhang2
95% of researchers rate our articles as excellent or good
Learn more about the work of our research integrity team to safeguard the quality of each article we publish.
Find out more
ORIGINAL RESEARCH article
Front. Energy Res. , 21 April 2022
Sec. Sustainable Energy Systems
Volume 10 - 2022 | https://doi.org/10.3389/fenrg.2022.891742
This article is part of the Research Topic Technologies and Policies for Decarbonisation of the Industrial and Transport Sectors View all 7 articles
The continuously growing transportation sector has become the second largest, yet increasing, industrial emissions source of CO2, posing serious challenges to global environmental security. Among the various transport modes, road transportation yields the highest cumulative level of CO2 emissions. However, these emissions have not been sufficiently investigated in previous studies, especially with respect to analyses from the perspective of vehicle emission sources. This can make source management and emissions reduction difficult. To address these methodological issues, this study aims to build a highway traffic carbon emissions monitoring and spatial analysis system, employing the mobile carbon sources concept, and establish a carbon emissions model encompassing all types of passenger and freight vehicles based on interstation O-D traffic flow data recorded by the toll collection network, to calculate vehicle carbon emissions and create a mobile carbon source emissions map. Empirical analyses in Guangdong Province revealed that, compared with conventional studies, the mobile carbon source emission mapping approach can accurately identify vehicle types with higher emissions while assisting with source management. Of the average total daily carbon emissions from all types of vehicles that use highways (15,311 t), 57.10% originated from freight vehicles (8,743 t) while passenger vehicles contributed 42.90%. By specific vehicle type, emissions mainly originated from small and medium-sized vehicles, including Class I passenger vehicles (i.e., cars) and Class I and III freight vehicles. Further, the proposed method could locate road sections characterized by high carbon emissions. High-emission sections in Guangdong Province were mainly spatially autocorrelated, with peak aggregations on national highways; near economically developed and densely populated areas; and adjacent to surrounding airports, ports, and overpass roads. This study improves the scientific and spatial analytical accuracy for carbon emissions measurements of highway vehicles, thus informing source management and sustainable development, as well as providing technical support for attaining carbon neutrality in China.
Excessive greenhouse gas emissions, especially those of CO2, lead to anthropogenically driven climate change and an increasing frequency of extreme weather events, detrimentally affecting human survival and development while posing serious threats to global environmental security (Dong et al., 2020). Recently, unsound industrial and domestic practices have further increased energy consumption and CO2 emission rates. The annual global CO2 emissions will likely reach 33,000 Mt in 2021, marking a 5% increase over that in 2020, the largest recorded rise since the 2010 financial crisis (IEA, 2021). Accordingly, the only path to sustainable development involves active measures to conserve energy and reduce emissions to jointly address global environmental challenges. Globally, the transportation sector accounts for one-quarter of the total emissions and is the key sector for energy conservation and emissions reduction (Amin et al., 2020). In China, transportation was responsible for approximately 901 Mt of carbon emissions in 2019 (the second highest following that of the United States), accounting for approximately 10% of global emissions from the transportation sector (https://www.iea.org). Hence, promoting emissions reductions within China’s transportation sector is of significance for global low-carbon development. Among the various transportation modes, road transportation has always been dominant in the transportation structure of China (Li and Loo, 2016), normally accounting for ≥70% of the total transportation volume and the greatest proportion of carbon emissions. Highways are the major veins of the modern Chinese road network. Compared with general road transportation, highways are usually characterized by lower degrees of disturbance while maintaining higher traffic flows and resource allocation efficiencies (Gutiérrez, 2001). Meanwhile, accelerated infrastructure construction and continuous improvements to highway networks have reinforced the role that highways play for the transportation of goods and people. The total mileage of highways in China reached 140,000 km in 2019, ranking the first in the world, with a traffic volume of 7.814 billion passenger vehicles and 2.428 billion freight vehicles. In 2019, 14,852 vehicles used national roads in China daily. Particularly, 27,936 and 10,641 vehicles used highways and general roads, respectively (http://www.gov.cn). Highways are the main thoroughfare for vehicles traveling between cities, including private cars, passenger vehicles, and long-distance passenger buses, in addition to mini, medium, and heavy trucks. Notably, the proportion of new energy vehicles on the road is still relatively low; most vehicles currently rely on traditional energy sources, mainly diesel and gasoline. As a result, these vehicles emit large amounts of greenhouse gases (including CO2) during operation, detrimentally impacting the environment and livelihood of residents.
Owing to increasing environmental problems, the Chinese government has proposed the goal of reaching a carbon emissions peak by 2030, and has promoted a reduction of energy consumption and CO2 emissions per unit GDP by 13.5% and 18%, respectively, during the 14th Five-Year Plan period. Reducing CO2 emissions from highway vehicles has become an alternative avenue for source management and green development, and there is an urgency for the development of an empirical estimation model for carbon emissions from highway vehicles. Additionally, the implementation of directed reduction measures for different regions and road sections requires the spatial characterization of carbon emissions. Although emission estimation models and methodologies are being continuously improved, few studies have focused on carbon emissions from highway vehicles (Chang and Chung, 2018). Furthermore, the two main methods for calculating traffic carbon emissions, i.e., top-down and bottom-up, have failed to significantly improve the spatial accuracy of calculation results (Amin et al., 2020; Zakaria et al., 2021).
To address these issues, this study employed the mobile carbon sources concept to establish a highway carbon emissions estimation and spatial analysis methodology. Conventionally, pollution sources are divided into stationary and mobile sources (Liu et al., 2016), where the former refers to pollution sources at fixed locations (e.g., factory chimneys) and the latter refers to spatially dynamic pollution sources, including most types of vehicles (motor vehicles, airplanes, and ships) (Rondia et al., 1983; Zweidinger et al., 1988). These vehicles emit CO, HC, SO2, and other pollutants, causing serious problems in the atmospheric environment (Sallès et al., 1996). Historically, the concept of these two sources has facilitated the evaluation of the atmospheric quality and pollution source mapping (Liu et al., 2016), enabling the formation of representative empirical pollution prevention systems (Grassi et al., 2021). Thus, the concept of mobile carbon sources is the same as that of mobile pollution sources, focusing on the greenhouse gas emissions from vehicles. This is similar to the bottom-up approach used in traffic carbon emissions research (i.e., calculating emissions based on the driving trajectories of vehicles and proposing emissions reduction measures at the source level). Further, this approach aligns with modern entire-process environmental management strategies that focus on prevention and source control (Liu et al., 2016). Emissions reductions and sustainable development can thus only be achieved via continuous improvements to manufacturing technologies, modifications of vehicle structures, and optimization of vehicle driving routes at the source level.
The proposed mobile carbon source emission maps encompass vehicle emissions and their spatial characteristics. Compared with traditional spatial analyses of carbon emissions, our maps yielded the following significant contributions to the classification and spatially accurate identification of vehicles: 1) Vehicles were classified into 10 categories based on highway toll standards: classes I–IV passenger vehicles and classes I–VI freight vehicles, covering all highway vehicles for comprehensive and accurate calculations of highway carbon emissions. This allowed the classification and management of mobile carbon sources. 2) The information used to create the carbon emissions maps was origin–destination (O-D) traffic flow data between toll stations. The high degrees of spatial matching and high analytical accuracies enabled multi-path and multi-scale spatial analyses from road sections to networks and from cities to entire provinces.
In summary, this study attempted to construct a complete highway carbon emissions calculation model and analysis methodology by drawing mobile carbon source emissions maps and improve the scientificity and systematicity of traffic carbon emission estimations. Simultaneously, the spatial characteristics of carbon emissions were explored to facilitate the formulation of emissions reduction policies at the source level and promote the green development of transportation from a practical viewpoint.
Economic and social development have led to an increase in energy consumption and carbon emissions from the transportation sector owing to a corresponding growth in the demand for transportation. As a result, measures for reducing transportation carbon emissions are receiving increasing attention (Lin et al., 2017; Li and Zhang, 2020). However, due to incomplete statistical data (Sun et al., 2016), conventional studies on transportation carbon emissions have primarily focused on estimating the total emissions across the entire transportation sector to assist the government in formulating reasonable control policies (Zhang and Wei, 2015; Lopez et al., 2018). Relatively few studies have focused specifically on carbon emissions associated with specific modes of transportation; those that do exist have mostly employed quantitative measurements for air and railroad transportation (Chao, 2014; Edwards et al., 2016; Pritchard and Preston, 2018). Nevertheless, the transportation network is not a single system that relies on an individual mode of transportation; rather, it is an integrated system comprising various modes of transportation. Therefore, some of the service scopes in different transportation modes, such as aviation and railway transportation, may overlap. Through comparative analyses of carbon emissions from different transportation modes, recent studies have explored adjustments to the transportation structure for the transfer of humans and cargo across transportation networks to improve efficiency and thus reduce carbon emissions (Zuo et al., 2018; Strauss et al., 2021).
Among the few previous quantitative analyses of carbon emissions from road and highway transportation, most have examined the values of energy consumption and carbon emissions, notably lacking analyses of the spatial variability (Chang and Chung, 2018; Ramli et al., 2019). Recently, with advancements in transportation data digitization and freight networks, some researchers have explored the use of big data to analyze carbon emissions. For example, using track-to-truck trajectory data recorded by freight platforms to explore the carbon emission footprints of trucks and their spatial variability across road sections (Schulte et al., 2017; Cheng et al., 2020). However, applications of track-to-truck data in carbon emissions analysis face the following limitations. First, not all truck trajectories are effectively recorded by the freight networks due to technical limitations. Second, the use of various vehicle types on highways complicates measurements. Analyzing only freight vehicles cannot explain the true carbon emissions originating from road transport owing to the increasing contribution of private and passenger cars.
The top-down and bottom-up approaches provided by IPCC are two internationally accepted methods for calculating carbon emissions (IPCC, 2019; Svirejeva-Hopkins and Schellnhuber, 2008). The top-down approach measures the total carbon emissions from transportation based on energy consumption and the corresponding carbon emission coefficients. This method has been widely employed due to its statistical simplicity with respect to acquiring and analyzing data (Amin et al., 2020; Xu and Xu, 2021). Alternatively, the bottom-up method first determines the total energy consumption based on the mileage and energy consumption per unit mile for different transportation modes, followed by multiplying the results by the emission coefficient to calculate the total carbon emissions (Li and Loo, 2016; Zakaria et al., 2021; Wang et al., 2017). The top-down method can roughly estimate the total carbon emissions in situations where high-precision statistical data are not readily accessible, thus facilitating the analyses of urban carbon emission structures and temporal changes in transportation carbon emissions, which can further guide industrial restructuring. Nevertheless, the derived values represent the overall carbon emissions throughout the entire sector, and it is hard to distinguish between contributions from different sources, such as transportation, equipment manufacturing, or road construction. Further, this method is also difficult to measure the carbon emissions generated by individual transportation modes, thus providing limited insights for restructuring transportation. Comparatively, the bottom-up method provides subdivisions for transportation modes, with a clear differentiation between passenger and freight transportation (Sim, 2017), which enables lateral comparisons of the carbon emissions variability. However, the bottom-up method has two notable limitations. 1) High-precision spatial data are not readily available, complicating analyses of the spatial variability and preventing the identification of areas with high carbon emissions. Thus, owing to the diverse data required and the difficulties associated with data processing, the bottom-up method is often based on existing panel data to obtain the average vehicle mileage and number of registered vehicles. Further, administrative divisions limit the spatial scope. Most spatial analyses are carried out at large scales using provinces and cities as basic units (Ma and Kang, 2017); thus, refining estimates for specific road sections is impossible. 2) Vehicle classification is unreliable and unfavorable for identifying the variability in carbon emissions. Most studies have adopted sample and survey data (Zakaria et al., 2021; Wang et al., 2017; Tao et al., 2015) to determine the average mileage of vehicles at tourist attractions or in traffic station areas; these studies are unable to accurately or comprehensively quantify carbon emissions.
Overall, both the top-down and bottom-up methods are unsuitable for developing effective source management and emissions reduction policies. To address these limitations, this study created high-precision mobile carbon source emission maps using the carbon emissions measurement and analysis methodology shown in Figure 1. Here, we improved the traditional bottom-up approach to construct a highway carbon emissions model across all sample types, including class I–IV passenger vehicles and class I–VI freight vehicles. Mapping was conducted through a case study and the resulting map was analyzed from three perspectives: the carbon emissions by vehicle type and municipality and the overall spatial pattern. The initial analysis by vehicle type facilitated the direct identification of vehicles with higher carbon emissions, providing the necessary foundation for source control and scientific environmental management. Assessing carbon emissions by municipality can assist the formulation of policies for reducing emissions and achieving sustainable development via lateral comparisons among regions. Understanding the overall spatial variability facilitates the exploration of emission distribution patterns along highways and visually demonstrates the high spatial precision of the mobile carbon emission maps.
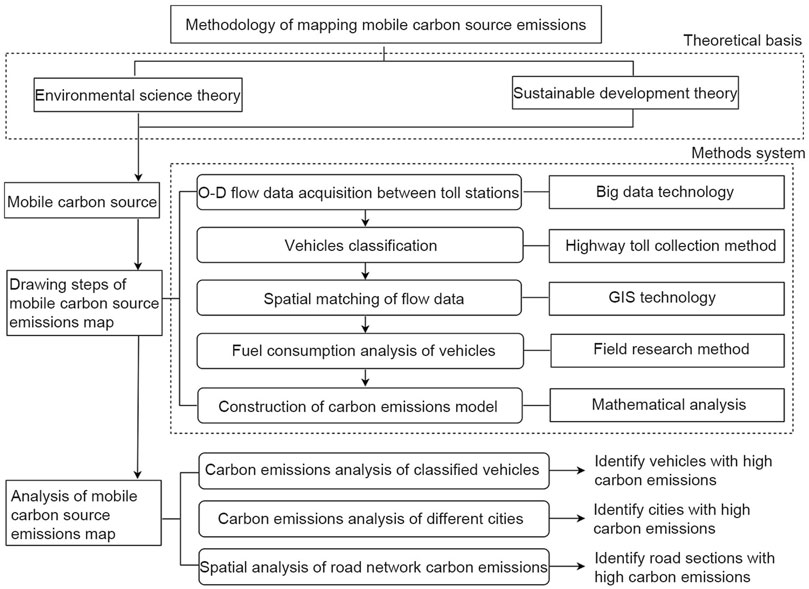
FIGURE 1. Conceptual diagram of the methodology used for mapping and analyzing the mobile carbon source emissions.
O-D traffic flow data were obtained from the highway toll collection network system, which was built, operated, and maintained by Chinese transportation departments. The system records a range of information on vehicles traveling along highways, including the total number of vehicles, O-D road sections, and distance. Part of the data fields are shown below (Table 1):

TABLE 1. Part of the O-D traffic flow data.
Vehicle type classification in this analysis followed that used by the highway toll collection system for convenient data collection and analysis. Passenger vehicles were classified into four categories (classes I–IV) based on the number of seats, while freight vehicles were divided into six categories (classes I–VI) based on the body length and number of axles. As classes V–VI freight vehicles can be characterized by various combinations of “tractor + trailer,” Figure 2 only shows typical classes I–IV passenger vehicles and classes I–IV freight vehicles.
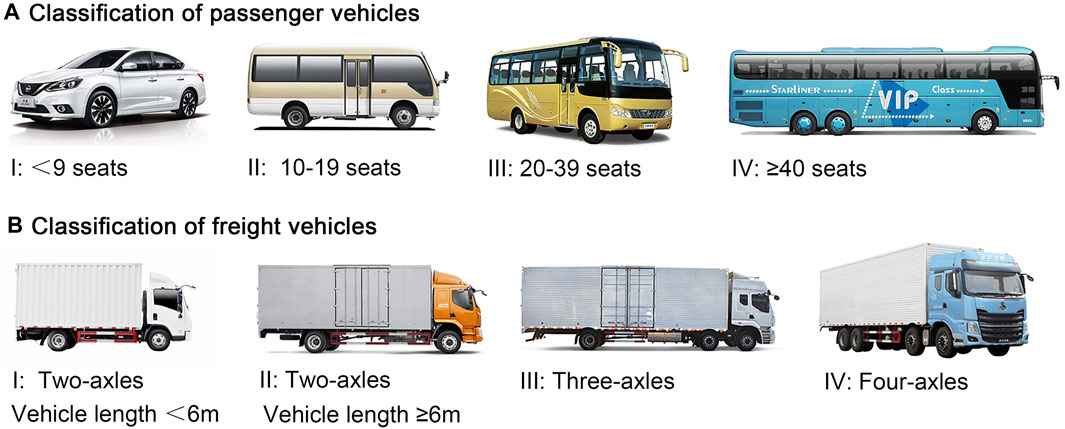
FIGURE 2. Photos of example classes I–IV passenger vehicles (A) and classes I–IV freight vehicles (B) used in this study.
Spatial matching of the O-D traffic data was completed using GIS, as illustrated in Figure 3. First, based on different driving conditions in urban and suburban areas and the corresponding differences in vehicle energy consumption, areas were delineated based on the development plans of individual cities. Here, Meizhou city in Guangdong Province was randomly selected as an example to illustrate this process (Other cities can also be selected for explanation, Meizhou city was chosen just because its relatively sparse highways and clear drawing.). In Figure 3, Meijiang District is the central urban area of the city, whereas the peripheral counties are the suburban areas of the city. Second, the administrative division and highway network layers were vectorized and overlain for the classification of urban and suburban road sections. Finally, toll stations were used as division points along the highway network to create road sections, which all started and ended at highway toll stations with defined spatial location information (corresponding to the original O-D traffic data).
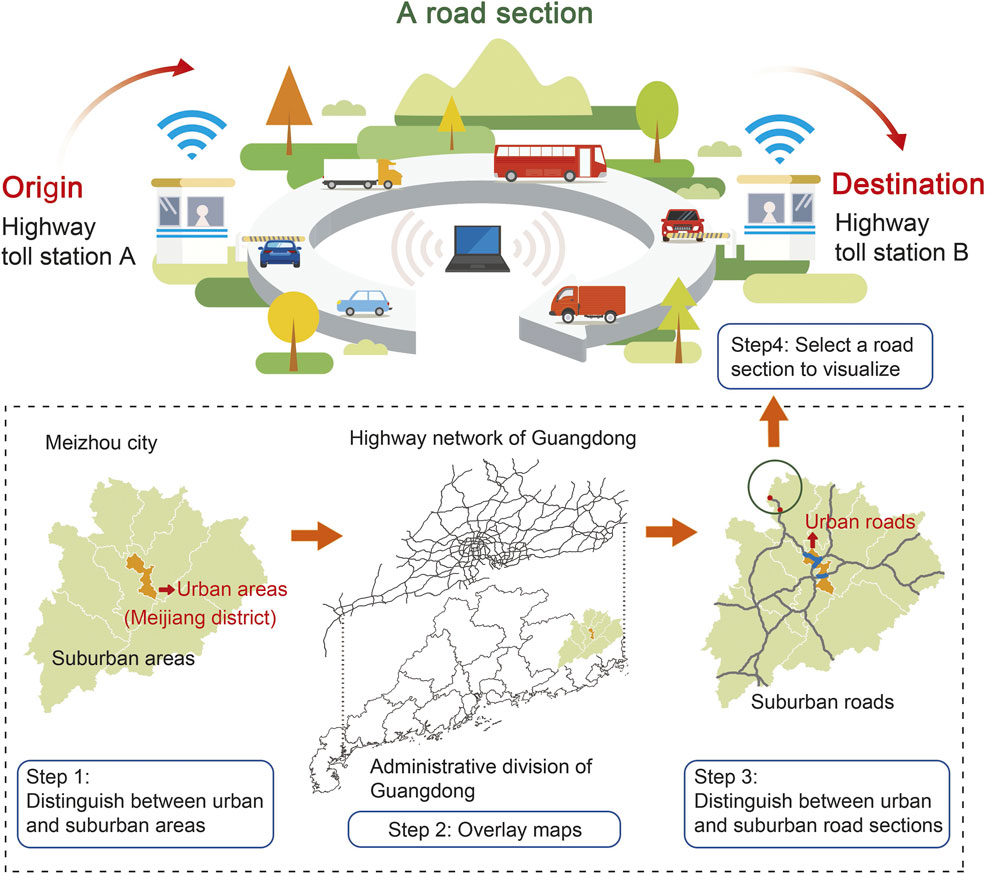
FIGURE 3. Schematic diagram of mobile data spatial matching.
Since it was difficult to measure the fuel consumption of each vehicle on the highway, this study took the average fuel consumption of “popular models”. Firstly, the “popular models” for each vehicle type were selected based on the quantity counted. Secondly, the fuel consumptions of these selected “popular models” were obtained from the MIIT (https://www.miit.gov.cn) and subsequently the average values were calculated.
The fuel consumption for classes V–VI freight vehicles was analyzed via a field survey. Specifically, field interviews and surveys were conducted with parked drivers in multiple service areas on typical road sections to obtain data on the vehicle type and respective fuel consumption in urban and suburban areas.
The IPCC provides a methodology for countries to establish greenhouse gas inventories and fulfill their emissions reduction agreements. This internationally accepted method employs easily accessible data, following simple and clear calculations, such that it has been commonly used for emission estimates:
where CEF is the CO2 emissions factor in kg CO2·kg−1; LCV is the average lower calorific value of the fuel in kJ·kg−1; PF is the potential carbon emissions factor, expressed as the carbon content per unit calorific value of the fuel, in tC·TJ−1; COF is the carbon oxidation rate in %; and K is the carbon conversion efficiency, i.e., the ratio of the molecular mass of CO2 to that of C (44/12 ≈ 3.67). Finally, the result is multiplied by 10−6 for unit conversion. In Eq. 2, CEFLi is the CO2 emissions factor of fuel type i in kg CO2·L−1 and ρi is the density of fuel type i. In Eq. 3, CDEi is the CO2 emissions from fuel type i in kg and FC is the fuel consumption in L.
All data were official data (Table 2). For example, the average lower calorific value was obtained from the General Rules for Calculating Comprehensive Energy Consumption (GB/T 2589-2020). The gasoline density was obtained from the National Standard for Motor Gasoline (GB 17930-2016), while the diesel density was based on the National Standard for Motor Diesel (GB 19147-2016). The carbon content per unit calorific value and carbon oxidation rate were set based on the Provincial Greenhouse Gas Inventory Preparation Guidelines. Based on these data, the carbon emissions factors for diesel and gasoline were 3.10 and 2.93 kg CO2 kg−1, respectively.
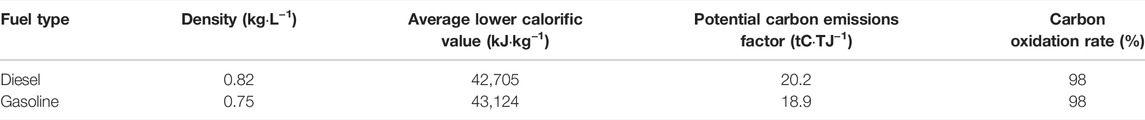
TABLE 2. Variables for the CO2 emissions factor calculations.
The carbon emissions estimation model for highways was developed based on the bottom-up method to obtain a high analytical precision. Spatially, the model operated at the toll station scale. Real-time data acquisition and the dynamic distribution of vehicles enabled the model to accurately reflect the highway traffic status. The model covered all 10 vehicle types while efficiently identifying those with higher energy consumption and carbon emissions. Furthermore, the model corrected the emissions coefficients based on the current status of fuel consumption along urban and suburban road sections. The estimation was performed as follows.
1) Model construction for the carbon emissions of vehicle type a travelling on road section r:
where CDEar is the carbon emissions of vehicle type a on road section r in kg, FCa is the fuel consumption per 100 km for vehicle type a in L, Dr is the length of road section r in km, and Var is the number of type a vehicles on section r. Considering the differences in fuel consumption resulting from variations in the driving conditions owing to traffic congestion, and differences in the operating speeds along suburban and urban road sections, local working conditions were incorporated into the model:
When section r was located in an urban area, FCa was set as FCa(urban), and the corresponding fuel consumption of the vehicle was representative of driving on urban highway sections. Conversely, if section r was located within a suburban area, FCa was FCa(suburb), and the corresponding fuel consumption of the vehicle was equivalent to that when the vehicle was travelling in suburban areas.
2) An emissions model for all vehicle types travelling across the entire road network was constructed as follows:
where CDEr is the total carbon emissions from all types of vehicles driving on road section r in kg and n is the number of vehicle types (n = 10 in this study). By integrating the above models, a carbon emissions estimation model for all vehicle types on the entire road network was established as follows:
where CDE is the total carbon emission in kg and m is the total number of road sections. The calculated result was multiplied by 10−8 for unit conversion.
Guangdong Province, located in south China, constitutes the largest portion of the economy and population in China, with a regional GDP of 11.08 trillion yuan ($1.7 trillion USD) and 126 million residents in 2020. Its superb economic and social development attract an ever-increasing inflow of people and goods to the point where it has become the province with the greatest traffic volume and most frequently occurring traffic congestion in China. In 2019, Guangdong Province ranked the first in the country in terms of total highway mileage (9,495 km), passenger and freight vehicle traffic volume, and volume of cargo transported via highways (http://www.stats.gov.cn). The highway traffic volume for passenger vehicles alone was 1.599 billion, accounting for 20% of the national total; in contrast, the highway traffic volume for freight vehicles was 0.393 billion, equivalent to 16% of the national total. Examining the provincial transportation structure revealed that the dominant mode of transportation in Guangdong is road transportation: roads are the primary arteries for cargo transfer, passenger travel, and commuting. Hence, as a province with dense traffic flows and strongly developed highway networks, Guangdong is a typical region suitable for studies on transportation carbon emissions.
In this study, average daily traffic data in April 2021 were obtained from the highway toll collection network system of the Department of Transport of Guangdong Province, which provided data on >6,589,000 vehicles, covering all 10 vehicle types. We note that Guangdong had already resumed transportation operations in March 2020; transportation had recovered to pre-COVID-19 levels by the end of 2020. In 2021, China entered its post-pandemic period, with relatively stable economic and social development. Therefore, data from April 2021 can be considered to be representative of the overall patterns. Additionally, this study divided the highway network in the province into 1,181 sections, which were spatially matched with the O-D traffic data using ArcGIS v10.3 and marked as national highway (G) and provincial highway (S). National highway mainly serves interprovincial transportation and provincial highway serves the intra-provincial. Meanwhile, information on the vehicle fuel consumption was acquired through an analysis of the Big Data of Vehicle Quantity in Guangdong Province in 2020 (http://www.daas-auto.com) and field surveys (Table 3).
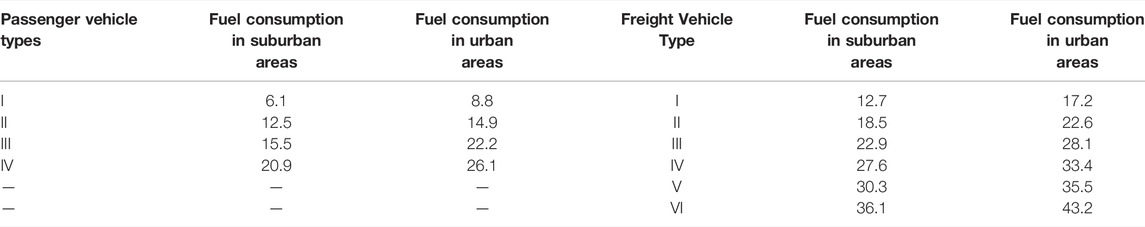
TABLE 3. Fuel consumption of typical vehicle types in suburban and urban areas in Guangdong Province (L·100 km−1).
Overall, carbon emissions along highways in Guangdong were primarily generated by freight vehicles (Figure 4). The total daily average carbon emissions from all vehicle types was 15,311 t, of which 8,743 t (57.10%) was derived from freight vehicles and 6,568 t (42.9%) originated from passenger vehicles. For specific vehicle types, carbon emissions mainly originated from small- and medium-sized vehicles, such as class I passenger vehicles and class I and III freight vehicles. Particularly, class I passenger vehicles (common private cars) had the greatest impact, generating carbon emissions of 6,112 t, accounting for 93.06% of the total carbon emissions of passenger vehicles and 39.92% of the total carbon emissions. Class III and I freight vehicles produced similar carbon emissions of 2,671 and 2,196 t, respectively, accounting for 17.45% and 14.34% of the total carbon emissions, respectively. The carbon emissions from all other passenger vehicle types (except for class I) in Guangdong were generally low. More specifically, class II passenger vehicles had the lowest carbon emissions value (46 t), accounting for only 0.30% of the total carbon emissions, followed by class III passenger vehicles (68 t), accounting for 0.44% of the total emissions.
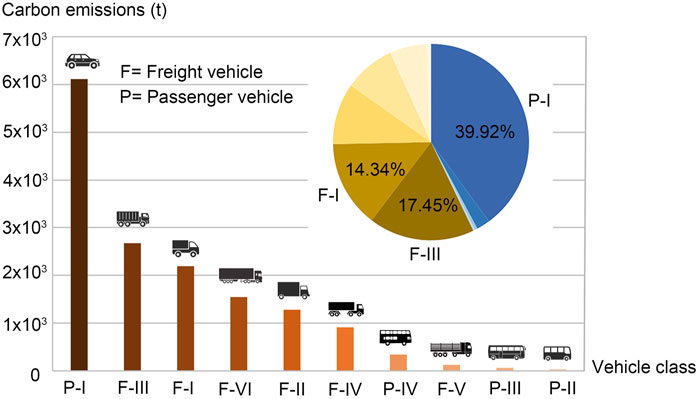
FIGURE 4. Vehicle carbon emissions on highways in Guangdong.
In Guangdong, areas with high carbon emissions along highways were mostly concentrated in the economically developed and densely populated Pearl River Delta (PRD) urban conglomeration located in the central part of the province. This demonstrates the prominent contribution from the capital city. The provincial capital, Guangzhou City, had the highest carbon emissions of 3,037 t (20.06% of the provincial total), followed by Foshan, which is adjacent to the capital city, with emissions of 2,055 t (13.51% of the total). The emissions from Foshan City were notably >30% lower than those from Guangzhou City. Further, the primary mobile carbon sources in cities with higher carbon emissions were class I passenger vehicles. For example, in Dongguan City, class I passenger vehicles emitted 757 t of carbon, accounting for 45.23% of the city’s total. In Huizhou City, the carbon emissions of the same vehicle type were 501 t, comprising 44.01% of the city’s total. Areas with relatively lower emissions levels were primarily located along the coastal areas of Guangdong Province. Notably, Zhuhai City had the lowest carbon emissions (56 t), approximately 1/50 of the total in Guangzhou City, followed by the carbon emissions from Shantou City along the east coast (124 t).
Cities with comparatively high carbon emissions from class I–III small- and medium-sized passenger vehicles (Figures 5Aa–Ac) were mostly aggregated in the PRD urban conglomeration (Figures 5C), such as Guangzhou City and Foshan City, whereas emissions from the same vehicle types in other regional cities were generally lower. Meanwhile, areas with relatively high carbon emissions from class IV passenger vehicles, which are large and travel over long distances (Figure 5Ad), included cities in the PRD, as well as those in the north, e.g., Qingyuan City. Similarly, cities with comparatively high carbon emissions from class I–II light freight vehicles (Figures 5Ba,Bb) were also concentrated in the PRD urban conglomeration. However, in Dongguan City, east of Guangzhou, carbon emissions from class I–II light freight vehicles were also high. Hence, there was a high carbon emissions area centered around Guangzhou City, flanked by Dongguan City and Foshan City on its east and west sides, respectively. Areas with relatively high carbon emissions from class III–VI freight vehicles (Figures 5Bc–Bf) were notably different from those with higher emissions from the aforementioned vehicle types. In addition to the PRD, cities in northern Guangdong had comparatively high carbon emissions levels, especially Qingyuan City and Shaoguan City. These cities are located at the provincial borders, serving as gateways to the northern provinces of China.
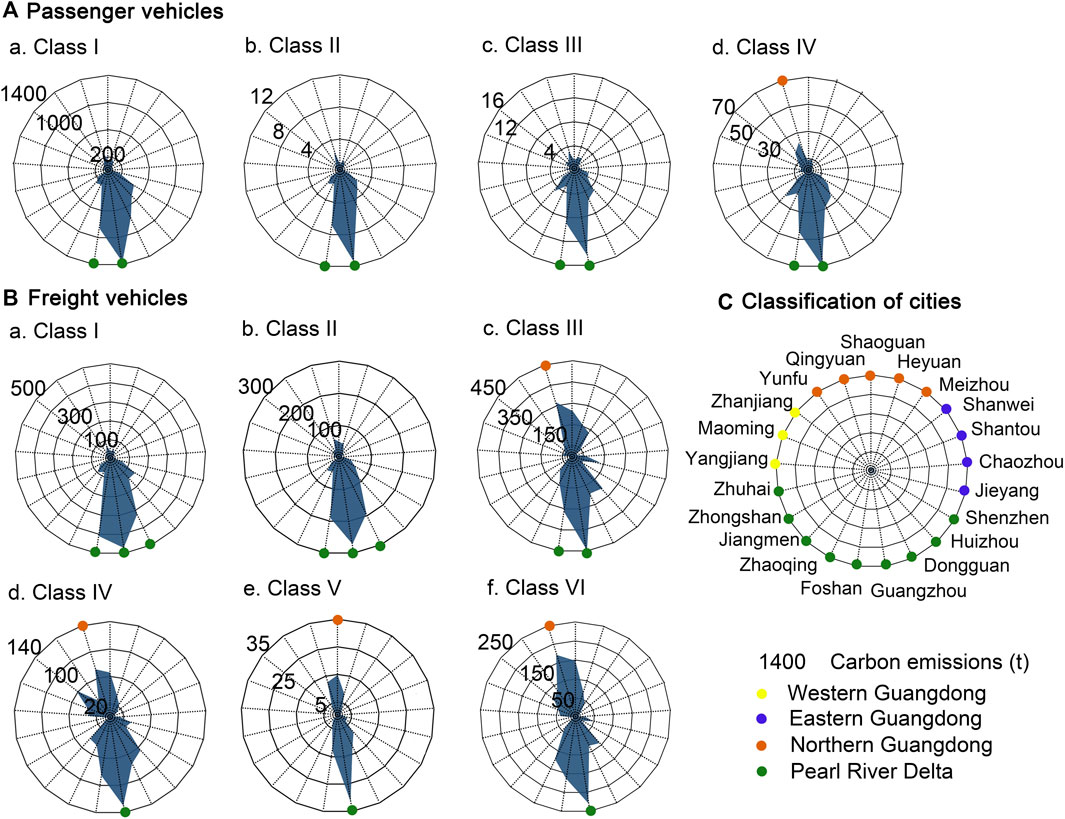
FIGURE 5. Carbon emissions in different cities by vehicle type and classification of cities in Guangdong.
Based on the natural breaks classification, the carbon emissions from all vehicle types were divided into five levels; Figure 6 shows the visualized results. The spatial distribution of highway carbon emissions exhibited the following characteristics: 1) road sections with high carbon emissions were concentrated in economically developed and densely populated areas. They were widely distributed across the region, with relatively high concentrations in the center of the PRD urban conglomeration and surrounding cities, e.g., Guangzhou City, Foshan City, Dongguan City, and Shenzhen City, as well as in the urban areas of Zhanjiang City and Shantou City. These areas generally have relatively high-density road networks. In contrast, road sections with low carbon emissions were distributed along the provincial periphery, such as in Meizhou City and Heyuan City. 2) Road sections with high carbon emissions were primarily concentrated along national highways (9,477 t; 61.90%); the carbon emissions of provincial road sections were relatively low (5,834 t; 38.10%). Spatially, sections with higher carbon emissions were concentrated along the G75 Lan–Hai Highway (Zhanjiang section), G15 Shen–Hai Highway (Jiangmen section), and G55 Er–Guang Highway (Zhaoqing section). Further, some national highways had high carbon emissions across their entire lengths, such as the G0423 Le–Guang Highway, G4 Beijing–Hong Kong–Macao Highway, and G45 Da–Guang Highway. Sections with comparatively low emissions were located on several E–W provincial roads in the northern part of the region, those along the coast, and several N–S provincial roads in the eastern and western parts of the study area, e.g., the S14 Shan–Zhan Highway (Zhaoqing–Huizhou section), S32 West Coastal Highway, S6 Guang–Long Highway (Heyuan section), S11 Da–Chao Highway, and S59 Huai–Yang Highway. 3) Road sections near ports, airports, and overpass connections had relatively high carbon emissions, such as those near the major sea ports of the province and river ports in the PRD, including the ports of Qingyuan, Zhaoqing, Huizhou, and Zhanjiang. Additionally, coastal highway sections near the Shenzhen Bao’an International Airport and highway sections near Guangzhou Baiyun International Airport had high emissions levels. Overpass connection sections, especially along highway sections in the PRD and Guangzhou Beltways, also showed high emissions. These areas host many large-scale overpass sections characterized by the merging of traffic from multiple directions, thus leading to comparatively higher carbon emissions.
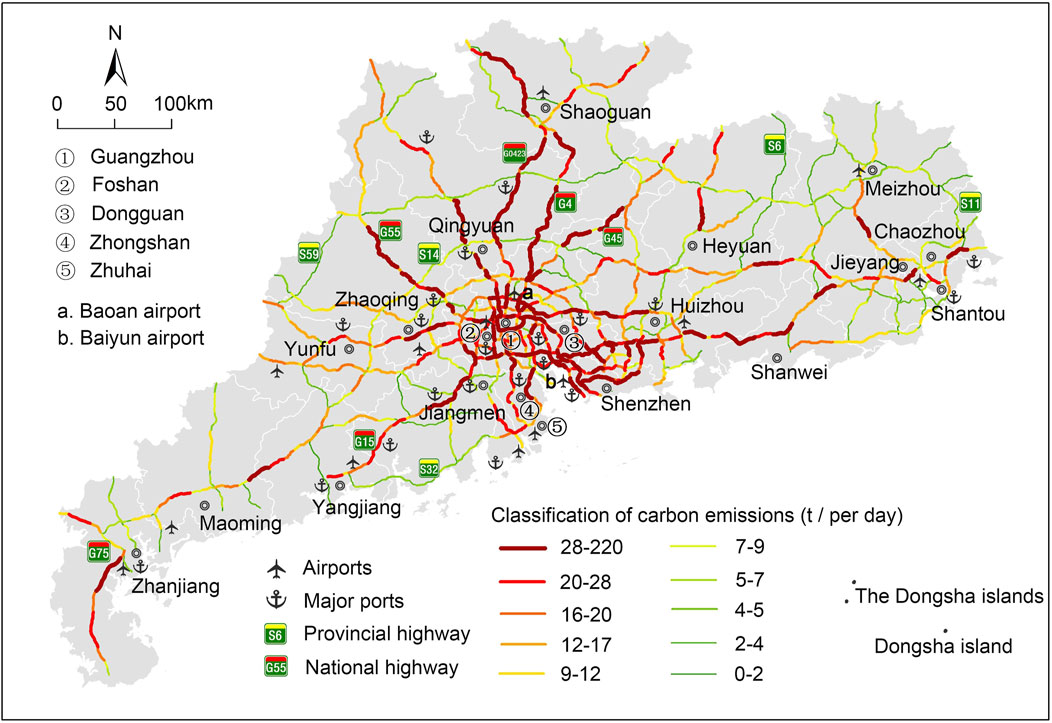
FIGURE 6. Spatial patterns of carbon emissions for all vehicle types on highways in Guangdong Province.
This study produced a map of the mobile carbon source emissions from highways based on a novel estimation and spatial analysis system that integrated O-D traffic flow data acquisition, vehicle classification, spatial matching of flow data, fuel consumption analysis, and carbon emissions model construction to enable source management and sustainable development.
First, the O-D traffic flow data established a foundation for the adoption of the mobile carbon sources concept. High-precision traffic flow data for all vehicle types were applied to more accurately identify the vehicle types and road sections characterized by high carbon emissions, with the ultimate goal of achieving source management. Further studies can extend the concept of mobile carbon sources to include mobile equipment for transportation infrastructure construction and other transportation modes, such as ships and airplanes. In this study, however, the classification of vehicles as various mobile carbon sources assisted the differentiation of the carbon emission characteristics depending on their respective mechanical structures, technical specifications, and fuel consumption (Mingolla and Lu, 2021; Wang et al., 2022; Liu et al., 2021). Emission reduction measures must be optimized based on these parameters. For example, based on the large number and significant contribution of class I passenger vehicles, we must optimize the energy structure to increase the proportion of vehicles using renewable energy sources on the road. Quantitative analysis shows that when the proportion of new energy vehicles on highways increases by 10%, total carbon emissions will drop by 4% (about 600 t). Furthermore, owing to the high unit fuel consumption and carbon emissions of class VI freight vehicles, improving their operation efficiencies is crucial to avoid empty carriages (i.e., no cargo) and optimize their driving routes. The spatial matching of flow data was essential for mapping mobile carbon emission sources; this is a distinctive feature of this study compared with traditional spatial analyses. Previous studies have focused on the spatial analysis of traffic carbon emissions across large administrative units (e.g., cities and provinces) due to a lack of complete statistical data and uncertainties in spatial positioning (Xu and Xu, 2021; Ma and Kang, 2017). Conversely, this study used O-D traffic data to locate mobile carbon sources by road section and explore the emissions characteristics of highways across multiple dimensions, by vehicle types, in individual cities, and for small-scale road sections. Results obtained at this level are informative for energy savings and emission reduction measures, also in line with modern environmental management (Zhang and Wen, 2008; Hang et al., 2019). Furthermore, vehicle classification is the foundation of fuel consumption analysis. Based on the comprehensive big data analysis and field surveys, the fuel consumption analysis results of this study, covering different vehicle types, are more representative of the actual situation compared with the traditional studies, which tend to oversimplify the classification of passenger cars and freight vehicles, as well as the calculation of fuel consumption (Lu et al., 2004; Chang and Chung, 2018).
Model construction is the core of the proposed methodology for estimating carbon emissions from highways. Based on the average lower heating value and densities of gasoline and diesel in official Chinese reports, the localized carbon emissions factors were estimated to produce a practical model. Carbon emission factors can be modified according to official local data for future analyses in other areas and countries. Further, the model follows a bottom-up approach based on the universal principle that transportation carbon emissions are equal to the product of the number of vehicles, their mileage, their fuel consumption per unit mileage, and carbon emissions factor (Romero et al., 2019). In this study, vehicle mileage was broken down and matched with the distances between O-D toll stations, thus improving the spatial analysis accuracy and realizing realistic fuel consumption analysis based on the 10 vehicle types. Finally, according to the carbon emissions analysis by vehicle type along individual road sections, a highway network carbon emissions estimation model was successfully established, forming a systemic foundation for mapping mobile carbon emissions sources.
In the context of the continuously increasing traffic carbon emissions and their subsequent impact on sustainable development and environmental security, this study established a carbon emissions estimation and spatial analysis methodology for highways by mapping the mobile carbon sources in Guangdong Province, China. The ultimate goal of this study was to promote source management and emissions reduction.
The results showed that, when compared with traditional carbon emissions research, the proposed methodological system for mobile carbon source emissions mapping enabled more detailed and accurate analyses, thus improving the spatial precision of carbon emission measurements. First, the method accurately identified the vehicle types that produce high carbon emissions, which is essential for source control. We note that the carbon emissions from highways in Guangdong Province primarily originated from freight vehicles. The total carbon emissions from all vehicle types was 15,311 t, of which 8,743 t (57.10%) originated from freight vehicles and 6,568 t (42.90%) was from passenger vehicles. By vehicle type, small- and medium-sized vehicles, such as class I passenger vehicles (i.e., cars), and class I and III freight vehicles primarily contributed to the carbon emissions from highways. Second, our method identified sections with high emissions, followed by an analysis of the distribution of carbon emissions. In the highway network of Guangdong Province, road sections with high carbon emissions were concentrated along national highways, adjacent to economically developed and densely populated areas, and near airports, ports, and road overpasses. Sections with the highest carbon emissions were aggregated in the PRD urban conglomeration and other urban areas; in contrast, sections with low carbon emissions were distributed throughout peripheral cities. The carbon emissions of the national highway sections in Guangdong accounted for 61.90% of the total emissions, while provincial highway sections contributed 38.10%.
This study explored a novel approach for the estimation and spatial analysis of carbon emissions from highways, and the results can provide a methodological reference for mobile carbon source mapping in other countries and regions. This in turn can promote the development of green transportation modes and ensure global environmental security. Future studies should investigate the temporal variations in carbon emissions from highways to further improve the spatiotemporal analyses.
The data analyzed in this study is subject to the following licenses/restrictions: The traffic flow data comes from Chinese government departments. Requests to access these datasets should be directed to http://td.gd.gov.cn/.
YL: Writing, data processing, modeling and pictures drawing. QW: Modifying and editing. YZ: Translation guidance, editing. GH: Editing. SJ: Data providing and processing. SF: Data processing.
This work was supported by the National Natural Science Foundation of China (42071165, 42171242), the GDAS’ Project of Science and Technology Development (2020GDASYL-20200104007) and the Key Special Project for Introduced Talents Team of Southern Marine Science and Engineering Guangdong Laboratory (Guangzhou) (GML2019ZD0301).
The authors declare that the research was conducted in the absence of any commercial or financial relationships that could be construed as a potential conflict of interest.
All claims expressed in this article are solely those of the authors and do not necessarily represent those of their affiliated organizations, or those of the publisher, the editors and the reviewers. Any product that may be evaluated in this article, or claim that may be made by its manufacturer, is not guaranteed or endorsed by the publisher.
IEA, International Energy Agency; IPCC, Intergovernmental Panel on Climate Change; O-D, Origin-Destination; GIS, Geographic Information System; PRD, Pearl River Delta; MIIT, Ministry of Industry and Information Technology of China.
Amin, A., Altinoz, B., and Dogan, E. (2020). Analyzing the Determinants of Carbon Emissions from Transportation in European Countries: the Role of Renewable Energy and Urbanization. Clean. Techn Environ. Pol. 22, 1725–1734. doi:10.1016/10.1007/s10098-020-01910-2
binti Zakaria, N. F. F., Mat Yazid, M. R. b., and Fadilah Yaacob, N. F. (2021). Quantifying Carbon Emission from Campus Transportation: A Case Study in Universiti Kebangsaan Malaysia. IOP Conf. Ser. Mater. Sci. Eng. 1101 (1), 012011. doi:10.1088/1757-899X/1101/1/012011
Chang, C.-C., and Chung, C.-L. (2018). Greenhouse Gas Mitigation Policies in Taiwan's Road Transportation Sectors. Energy Policy 123, 299–307. doi:10.1016/j.enpol.2018.08.068
Chao, C.-C. (2014). Assessment of Carbon Emission Costs for Air Cargo Transportation. Transportation Res. D: Transport Environ. 33, 186–195. doi:10.1016/j.trd.2014.06.004
Cheng, S., Zhang, B., Peng, P., Yang, Z., and Lu, F. (2020). Spatiotemporal Evolution Pattern Detection for Heavy-Duty Diesel Truck Emissions Using Trajectory Mining: A Case Study of Tianjin, China. J. Clean. Prod. 244, 118654. doi:10.1016/j.jclepro.2019.118654
Dong, H., Xue, M., Xiao, Y., and Liu, Y. (2021). Do carbon Emissions Impact the Health of Residents? Considering China's Industrialization and Urbanization. Sci. Total Environ. 758, 143688. doi:10.1016/J.SCITOTENV.2020.143688
Edwards, H. A., Dixon-Hardy, D., and Wadud, Z. (2016). Aircraft Cost index and the Future of Carbon Emissions from Air Travel. Appl. Energ. 164, 553–562. doi:10.1016/j.apenergy.2015.11.058
Grassi, Y. S., Brignole, N. B., and Díaz, M. F. (2021). Vehicular Fleet Characterisation and Assessment of the On-Road mobile Source Emission Inventory of a Latin American Intermediate City. Sci. Total Environ. 792, 148255. doi:10.1016/J.SCITOTENV.2021.148255
Gutiérrez, J. (2001). Location, Economic Potential and Daily Accessibility: An Analysis of the Accessibility Impact of the High-Speed Line Madrid-Barcelona-French Border. J. Transport Geogr. 9 (4), 229–242. doi:10.1016/S0966-6923(01)00017-5
Hang, Y., Wang, Q., Wang, Y., Su, B., and Zhou, D. (2019). Industrial SO2 Emissions Treatment in China: A Temporal-Spatial Whole Process Decomposition Analysis. J. Environ. Manage. 243, 419–434. doi:10.1016/j.jenvman.2019.05.025
IEA (2021). Global Energy Review 2021. Available at: https://www.iea.org/reports/global-energy-review-2021 (Accessed April 20, 2021).
IPCC (2019). 2019 Refinement to the 2006 IPCC Guidelines for National Greenhouse Gas Inventories. Available at: https://www.ipcc.ch/report/2019-refinement-to-the-2006-ipcc-guidelines-for-national-greenhouse-gas-inventories.
Li, L., and Loo, B. P. Y. (2016). Carbon Dioxide Emissions from Passenger Transport in China: Geographical Characteristics and Future Challenges. Geographical Res. 35 (07), 1230–1242. doi:10.11821/dlyj201607002
Li, L., and Zhang, X. (2020). Integrated Optimization of Railway Freight Operation Planning and Pricing Based on Carbon Emission Reduction Policies. J. Clean. Prod. 263, 121316. doi:10.1016/j.jclepro.2020.121316
Lin, B., Liu, C., Wang, H., and Lin, R. (2017). Modeling the Railway Network Design Problem: A Novel Approach to Considering Carbon Emissions Reduction. Transportation Res. Part D: Transport Environ. 56, 95–109. doi:10.1016/j.trd.2017.07.008
Liu, Y., Wang, Y., Lyu, P., Hu, S., Yang, L., and Gao, G. (2021). Rethinking the Carbon Dioxide Emissions of Road Sector: Integrating Advanced Vehicle Technologies and Construction Supply Chains Mitigation Options under Decarbonization Plans. J. Clean. Prod. 321, 128769. doi:10.1016/J.JCLEPRO.2021.128769
Liu, Z., Yang, Y., and Tian, H. (2016). Theory and Development of Environmental Science. Beijing: China Water & Power Press.
Lopez, N. S., Chiu, A. S. F., and Biona, J. B. M. (2018). Decomposing Drivers of Transportation Energy Consumption and Carbon Dioxide Emissions for the Philippines: the Case of Developing Countries. Front. Energ. 12 (3), 389–399. doi:10.1007/s11708-018-0578-7
Lu, H., Wang, J., and Zhang, P. (2004). Urban Transport Structure Optimization Based on Energy Consumption. J. Tsinghua University(Science Technology) 44(03), 383–386. doi:10.3321/j.issn:1000-0054.2004.03.034
Ma, H., and Kang, L. (2017). Spatial and Temporal Characteristics and Prediction of Carbon Emissions from Road Traffic in the Beijing-Tianjin-Hebei Region. Resour. Sci. 39 (07), 1361–1370. doi:10.18402/resci.2017.07.13
Mingolla, S., and Lu, Z. (2021). Carbon Emission and Cost Analysis of Vehicle Technologies for Urban Taxis. Transportation Res. Part D: Transport Environ. 99, 102994. doi:10.1016/J.TRD.2021.102994
Pritchard, J. A., and Preston, J. (2018). Understanding the Contribution of Tunnels to the Overall Energy Consumption of and Carbon Emissions from a Railway. Transportation Res. Part D: Transport Environ. 65, 551–563. doi:10.1016/j.trd.2018.09.010
Ramli, A. F., Muis, Z. A., Ho, W. S., Idris, A. M., and Mohtar, A. (2019). Carbon Emission Pinch Analysis: an Application to the Transportation Sector in Iskandar Malaysia for 2025. Clean. Techn Environ. Pol. 21 (10), 1899–1911. doi:10.1007/s10098-018-1579-2
Romero, Y., Chicchon, N., Duarte, F., Noel, J., Ratti, C., and Nyhan, M. (2020). Quantifying and Spatial Disaggregation of Air Pollution Emissions from Ground Transportation in a Developing Country Context: Case Study for the Lima Metropolitan Area in Peru. Sci. Total Environ. 698, 134313. doi:10.1016/j.scitotenv.2019.134313
Rondia, D., Cooke, M., and Haroz, R. K. (1983). Mobile Source Emissions Including Policyclic Organic Species. Dordrecht: Springer. doi:10.1007/978-94-009-7197-4
Sallès, J., Janischewski, J., Jaecker-Voirol, A., and Martin, B. (1996). Mobile Source Emission Inventory Model. Application to Paris Area. Atmos. Environ. 30 (12), 1965–1975. doi:10.1016/1352-2310(95)00278-2
Schulte, F., Lalla-Ruiz, E., González-Ramírez, R. G., and Voß, S. (2017). Reducing Port-Related Empty Truck Emissions: A Mathematical Approach for Truck Appointments with Collaboration. Transportation Res. E: Logistics Transportation Rev. 105, 195–212. doi:10.1016/j.tre.2017.03.008
Sim, J. (2017). The Influence of New Carbon Emission Abatement Goals on the Truck-Freight Transportation Sector in South Korea. J. Clean. Prod. 164, 153–162. doi:10.1016/j.jclepro.2017.06.207
Strauss, J., Li, H., and Cui, J. (2021). High-speed Rail's Impact on Airline Demand and Air Carbon Emissions in China. Transport Policy 109, 85–97. doi:10.1016/J.TRANPOL.2021.05.019
Sun, J., Zhang, J., Tang, G., Hu, H., and Chen, M. (2016). Review on Carbon Emissions by Tourism Transportation. China Popul. Resour. Environ. 26 (05), 73–82. doi:10.3969/j.issn.1002-2104.2016.05.009
Svirejeva-Hopkins, A., and Schellnhuber, H.-J. (2008). Urban Expansion and its Contribution to the Regional Carbon Emissions: Using the Model Based on the Population Density Distribution. Ecol. Model. 216 (2), 208–216. doi:10.1016/j.ecolmodel.2008.03.023
Tao Yuguo, 陶., Huang Zhenfang, 黄., and Shi Chunyun, 史. (2015). Carbon Dioxide Emissions from Regional Tourism Transport: a Substitutional Bottom-Up Analysis. Acta Eco Sin 35 (12), 4224–4233. doi:10.5846/stxb201309042211
Wang, J., Gui, H., Yang, Z., Yu, T., Zhang, X., and Liu, J. (2022). Real-world Gaseous Emission Characteristics of Natural Gas Heavy-Duty Sanitation Trucks. J. Environ. Sci. 115, 319–329. doi:10.1016/J.JES.2021.06.023
Wang, Y., Yang, L., Han, S., Li, C., and Ramachandra, T. V. (2017). Urban CO2 Emissions in Xi'an and Bangalore by Commuters: Implications for Controlling Urban Transportation Carbon Dioxide Emissions in Developing Countries. Mitig Adapt Strateg. Glob. Change 22 (7), 993–1019. doi:10.1007/s11027-016-9704-1
Xu, X., and Xu, H. (2021). The Driving Factors of Carbon Emissions in China's Transportation Sector: A Spatial Analysis. Front. Energ. Res. 9, 664046. doi:10.3389/FENRG.2021.664046
Zhang, K.-m., and Wen, Z.-g. (2008). Review and Challenges of Policies of Environmental protection and Sustainable Development in China. J. Environ. Manage. 88 (4), 1249–1261. doi:10.1016/j.jenvman.2007.06.019
Zhang, N., and Wei, X. (2015). Dynamic Total Factor Carbon Emissions Performance Changes in the Chinese Transportation Industry. Appl. Energ. 146, 409–420. doi:10.1016/j.apenergy.2015.01.072
Zuo, C., Birkin, M., Clarke, G., McEvoy, F., and Bloodworth, A. (2018). Reducing Carbon Emissions Related to the Transportation of Aggregates: Is Road or Rail the Solution? Transportation Res. A: Pol. Pract. 117, 26–38. doi:10.1016/j.tra.2018.08.006
Keywords: traffic flows, highway, mobile carbon source, emissions estimation model, spatial analysis, Guangdong
Citation: Li Y, Wu Q, Zhang Y, Huang G, Jin S and Fang S (2022) Mapping Highway Mobile Carbon Source Emissions Using Traffic Flow Big Data: A Case Study of Guangdong Province, China. Front. Energy Res. 10:891742. doi: 10.3389/fenrg.2022.891742
Received: 08 March 2022; Accepted: 04 April 2022;
Published: 21 April 2022.
Edited by:
Helena Martín, Universitat Politecnica de Catalunya, SpainReviewed by:
Lluis Monjo, Universitat Politecnica de Catalunya, SpainCopyright © 2022 Li, Wu, Zhang, Huang, Jin and Fang. This is an open-access article distributed under the terms of the Creative Commons Attribution License (CC BY). The use, distribution or reproduction in other forums is permitted, provided the original author(s) and the copyright owner(s) are credited and that the original publication in this journal is cited, in accordance with accepted academic practice. No use, distribution or reproduction is permitted which does not comply with these terms.
*Correspondence: Qitao Wu, d3VxaXRhb0BnZGFzLmFjLmNu
Disclaimer: All claims expressed in this article are solely those of the authors and do not necessarily represent those of their affiliated organizations, or those of the publisher, the editors and the reviewers. Any product that may be evaluated in this article or claim that may be made by its manufacturer is not guaranteed or endorsed by the publisher.
Research integrity at Frontiers
Learn more about the work of our research integrity team to safeguard the quality of each article we publish.