
95% of researchers rate our articles as excellent or good
Learn more about the work of our research integrity team to safeguard the quality of each article we publish.
Find out more
ORIGINAL RESEARCH article
Front. Energy Res. , 30 May 2022
Sec. Smart Grids
Volume 10 - 2022 | https://doi.org/10.3389/fenrg.2022.891184
This article is part of the Research Topic Prospects of Energy and Mobility - Connected and Autonomous Electric Vehicles for Sustainable Smart Cities View all 7 articles
 Zhiquan Wang1,2*
Digital twin can well solve complex problems, especially in the case of mechanical failures. Digital twin technology can be applied in 3D IoT smart factories, new smart city construction, smart medical care, digital energy, digital archives, warehousing and logistics visualization and other fields. Deep learning covers a wide range of applications and is extremely common. This paper discusses the application of the two in the risk prediction of coal and gas outburst strength. This paper firstly describes the method of predicting coal and gas outburst intensity. For example, the BP neural network algorithm applied to the prediction of coal and gas outburst intensity in deep learning, the air flow control system model of digital twin for coal mines, and the risk assessment algorithm of coal and gas outburst intensity in coal mines based on grey relational analysis, and various ways to predict risk. And the system model is designed in this paper. Combined with the Formula, this paper describes the process of predicting risk in detail, and then conducts experiments based on digital twin and deep learning to predict coal and gas outburst intensity. In this paper, digital twin is used to systematically design coal and gas outburst intensity prediction, and a neural network prediction model based on optimized quantum gate nodes is established. In this paper, the practical application experiment and result analysis of the optimization algorithm in the coal and gas outburst prediction model are carried out, and the conclusion is drawn. After QGNN is optimized by the sdPSO algorithm, the error is extremely small, only 2.0914, and the specific value of the prediction accuracy in practical applications is as high as 95%. The experimental data verifies the feasibility of digital twin and deep learning technology in the prediction of coal and gas outburst intensity.
Coal and gas outburst refers to coal outburst or gas outburst, which is a dynamic phenomenon in the process of mine excavation and collection. Coal and gas outburst is a type of special gas gushing phenomenon, that is, under the action of pressure, the broken coal and gas are suddenly ejected in large quantities from the coal body to the mining space. The main manifestation of this phenomenon is that in a very short period of time, a large amount of coal or gas will be erupted in the mine. In the end, it forms a peculiarly shaped cavity, which also has certain effects on objects in the mine, such as pushing mine carts and destroying facilities. The coal and gas erupted instantaneously in this phenomenon can fill hundreds or thousands of meters of roadways under the action of wind. Therefore, this phenomenon is very dangerous and is one of the most threatening and destructive natural disasters in the mine production process. In order to ensure the safe operation and production of the mine and avoid more risks in the process, it is necessary to analyze and study the phenomenon of coal and gas outburst and make high-precision predictions. At present, there is no thorough research on this phenomenon, and the causes of coal and gas outburst are very complicated. The traditional prediction models developed on the market can only study the individual outburst phenomena of coal and gas, and cannot interpret complex and changeable scenarios, and the prediction accuracy is not high. explaining the advantages of the methods which they used (they need to compare it with other methods) Therefore, the study of effective prevention methods and related prediction techniques can greatly ensure the safety of mine production and the safety of personnel. This research has a great impetus to safety production.
The sdPSO prediction model tested in this paper is extremely accurate. In addition, the relevant risk prediction methods of coal and gas outburst intensity are discussed in this paper. The system design based on digital twin has good application prospects and has good guiding significance in risk prediction. In this paper, a neural network prediction model based on optimized quantum gate nodes is established on the basis of the digital twin system. This method can provide a novel research direction for coal and gas outburst intensity prediction, and can also provide new ideas for digital twin and deep learning application research.
XuJ said that there are large pulses and pulsations in the process of coal and gas explosion. Five to six large pulses can occur between single extensions. After each big pulse, there are some accompanying pulses. In the process of explosion, the pressure change and average impact force of each main pulse showed a downward trend, but the cumulative energy of acoustic emission first decreased and then increased, and the increase rate reached 60% (Xu et al., 2018). ChengwuLI showed that there is a good power relationship between comparable pressure beams. The Formula for the pressure relief ring and outlet port is R = 1.8886r 0.9351. The elastic energy per unit volume of coal is 1.0–6.5 times the gas expansion energy, accounting for 52%–87% of the total energy. There is a positive linear correlation between soil stress and burial depth (Chengwu et al., 2018). To achieve digital twin vision, LiC uses the concept of dynamic Bayesian networks to build a general probabilistic model for diagnosis and prognosis, and illustrates the proposed method with an example of fatigue crack growth in an aircraft wing. Dynamic Bayesian networks integrate physical models and various sources of contingent and epistemic uncertainty in crack propagation prediction (Li et al., 2017). SchleichB proposes a comprehensive reference model based on the skin model shape concept as a digital twin of the physical product in design and manufacturing. He addresses all conceptualizations, representations, and implementations covering models in their application throughout the product life cycle (Schleich et al., 2017). WangJ established a wind power range prediction model based on the multi-output characteristics of BP neural network, and proposed an optimization criterion considering the prediction interval information. He then refined the model using a modified particle swarm optimization (PSO) algorithm. The simulation results of an example show that the proposed wind power range prediction model can effectively predict the output power range and provide decision-making basis for power grid dispatchers (Wang et al., 2017a). XieR uses elastic wave theory to analyze parameters such as density, stress and strain that affect longitudinal and shear wave velocity. He used the LM-BP neural network to fit the experimental results and estimated the average relative error to be 2.22% (Lü et al., 2017). However, these studies basically have insufficient evidence and should be adjusted.
In the forward propagation of the signal and the back propagation of the error, if the current output sample does not match the desired sample, the sample needs to be sent to the error propagation process. During error backpropagation, some process sequences are completely opposite to forward propagation (Jain et al., 2018). The output samples are sent from the hidden layer to the input layer in a specific format, and in the process are continuously propagated layer by layer, and all errors are evenly distributed to each hidden layer unit. Finally, the error signal of each hidden layer is retrieved and the weights of each unit are corrected accordingly (Tang and Guan, 2017). In order to make the final signal error reach the expected range or acceptable range, it is necessary to iteratively update the two processes of forward propagation and back propagation, and to continuously modify the weights in the process (Abooali and Khamehchi, 2019). The correction method is also the least squares method. Figure 1 is the BP neural network model and its function expression process.
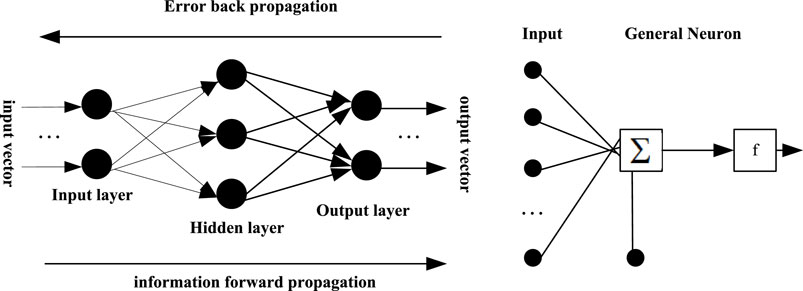
FIGURE 1. BP neural network model and its functions.
In the transfer function, the logarithmic transfer function and the tangent transfer function are both functions between linear and nonlinear. They have both linear and nonlinear characteristics. When using the sigmoid function in the output layer of a BP neural network, its output will be limited between -1 and 1 (Chatterjee et al., 2017). The sigmoid function is convenient for derivation, can compress data, and has the same amplitude and is convenient for forward transmission. And if the purelin function is used in its output layer, its output will be unlimited. Therefore, in the process of propagation, the Sigmoid function is generally applied to the hidden layer to transmit the samples, and then the purelin function is applied to the output layer to expand the range of the final output samples (Peng et al., 2017).
Let the input vector be
The transfer function is uniformly a unipolar Sigmoid function, the unipolar sigmoid function features continuity and derivation, namely
Substitute this error into the hidden layer to get:
Then expand the input and output layers to get:
It can be seen that the network error is a function of the weights of each neural level, which means that adjusting the weight is adjusting the error
The constant
The weight adjustment Formula of the algorithm is:
In the process of predicting the risk between coal and gas, BP neural network will be used. At this time, it should be noted that the dimensions and physical meanings of the collected data are different (Xia et al., 2018). The limitation of BP neural network is that the learning speed is slow, it is easy to fall into the local minimum value, the selection of the number of network layers and the number of neurons has no corresponding theoretical guidance, and the network promotion ability is limited. Therefore, it is necessary to unify the components of the input samples at the beginning of network training, and it is necessary to ensure that each input sample has the same status. In the process of network training, the transfer function corresponding to the neuron is a logarithmic function and a tangent sigmoid function, and the output domain of the function is [0,1]. At the same time, during the training process, the input data and output data must be processed in advance to ensure that the network converges quickly enough. Data preprocessing includes data cleaning, data integration, data transformation, and data reduction. When the components of the mentioned samples are unified and the status is the same, the maximum value
It can be known from the obtained Formula that the input data or output data is represented by
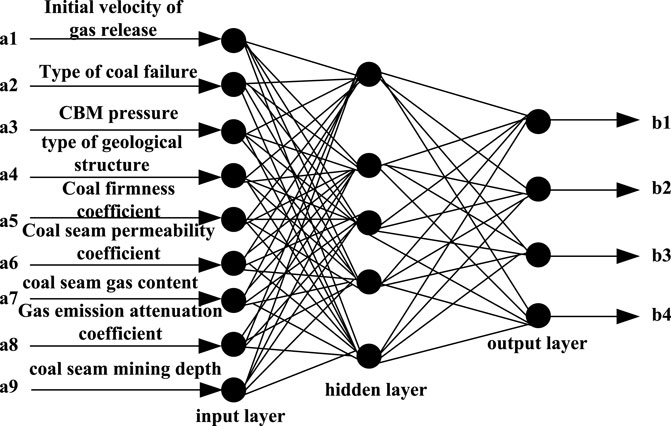
FIGURE 2. Structure of coal and gas outburst BP neural network.
The four databases of spatial database, attribute database, time database and knowledge database are combined into a coal and gas explosion risk management system (Pan et al., 2017). The gas explosion conditions are gas concentration, sufficient oxygen content, and sufficient energy ignition source.
The last knowledge database stores many kinds of data, such as the relevant national policies, problem-solving models, knowledge and experience of book materials, etc. (Nouh et al., 2021). The structural design of the framework for the mentioned coal and gas outburst risk prediction management system is shown in Figure 3. Its main purpose is to realize the real-time connection of attribute data and geographic data in the system (Li et al., 2018).
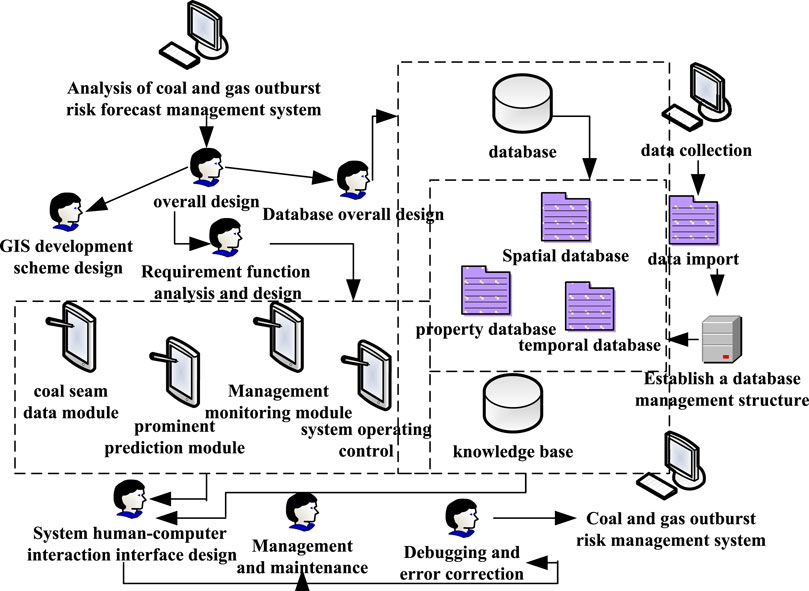
FIGURE 3. Coal and gas outburst risk prediction management system.
In the wind flow control system, its physical space and virtual space need to exchange information on the digital twin of the wind flow control system (Zhuang et al., 2017). The digital twin is also a new tool medium for current mine wind flow regulation. The structure of the wind flow control system based on digital twin is shown in Figure 4. The new wind flow control system mainly applies the concept of digital twin. In the digital twin wind flow control system, the entities of the wind flow control system are divided into two types, one is a physical entity and the other is a virtual entity. At the same time, the system also includes twin data and intelligent decision-making system (Ghassemzadeh et al., 2021).
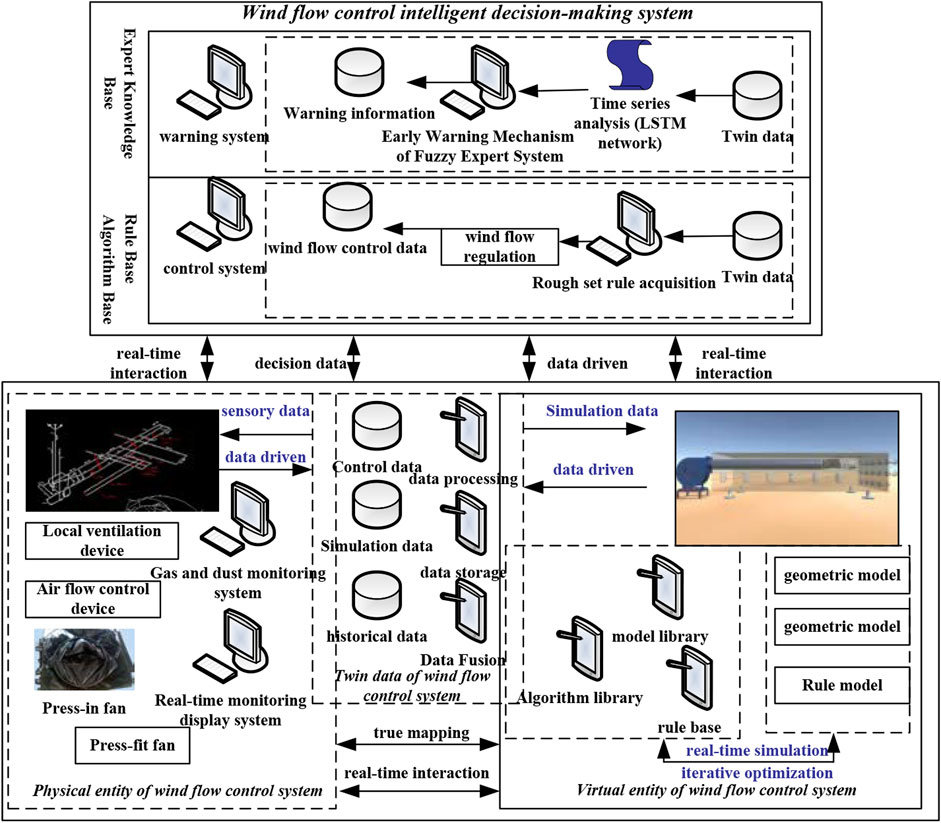
FIGURE 4. Structure of the digital twin wind flow control system.
Air flow control device, air duct, monitoring system, gas dust generation system and press-in fan constitute the physical entity of the entire air flow control system (Wang et al., 2017b). Among the components, the wind flow control device is the core of the entire physical entity. Through the wind flow control device, it can achieve various functions, such as adjusting the opening and closing size of the caliber, controlling the movement and deflection of the air outlet, etc. In addition, the physical entity also includes a gas dust detection system, which is composed of multiple sensors (dust sensor, gas sensor, wind speed sensor), a host computer, and a data collector. It is mainly responsible for real-time reading and collection of data such as dust concentration, gas concentration and wind speed in different areas of the entire mine (Bo et al., 2018). At the same time, the system will also collect the data of the virtual wind flow control system, and provide important guidance for adjusting the wind flow control device.
The wind flow control physical system needs to continuously collect the data in the area in real time, and then conduct a summary analysis to establish a huge data analysis library to provide accurate data support for the control of the entire system. The wind flow control logistics system usually needs to collect multi-dimensional data, such as wind speed, dust concentration and gas concentration. Multi-dimensional, big data, multi-scale, etc. are the main features of the system. Through this system, the staff can not only control various real-time data in the area, but also know the relationship and law between the control parameters of the air outlet and the data collected in a timely manner (Qi et al., 2017). The existence of the wind flow control physical system enables the mine to have a higher control over the stability and accuracy of the entire wind flow control system. The data collected by the wind flow control physical system is transmitted through the communication device, and the data is processed and stored through the relevant conversion device (Liu et al., 2021). Effective and practical information is extracted from it to realize the synchronized and coordinated operation of the physical entity and the virtual entity of the wind flow control system. Among the data required by the mine, the air outlet parameter control data and the gas dust concentration prediction data are also key. The data fusion of the two is performed to obtain the fusion model in Figure 5. Based on the obtained fusion data and model, the virtual entity of the wind flow control system is continuously updated, optimized and simulated, and finally the dynamic synchronization between the physical entity and the virtual entity and the intelligent wind speed control are achieved.

FIGURE 5. Twin data information fusion model of coal mine airflow control system.
By establishing the relevant structural model, the movement data of the air duct is calculated and collected, and the opening and closing process of the air duct diameter can be simulated and deduced by the three-dimensional modeling software of the computer (Chen et al., 2017). In the process of model calculation, the relationship between input and output is established by continuously inputting the data of the shaft rotation angle of the power gear to calculate the law between it and the opening and closing size of the air duct. Figure 6 is the aperture opening and closing structure of the single blade in the wind flow regulating device. In this structure, the input member is a motor, and the motor drives mechanical structures such as a bevel gear, a lead screw nut and a pull rod to control the opening and closing of the diameter of the air duct.
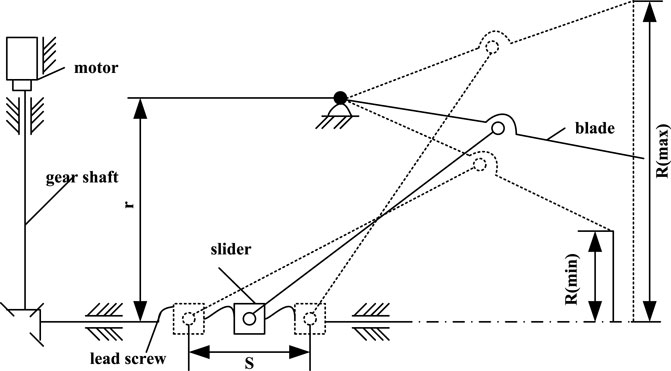
FIGURE 6. Opening diameter and opening and closing mechanism of air flow control device in coal mine.
When researching the monitoring system of the whole mine, the method of grey relational analysis is used. Taking the mine monitoring system as the object to establish the relevant mathematical model, quantify the dynamic development process of the whole system and carry out detailed analysis, so as to find out the relevant factors, characteristics and contradictions that have a significant impact on the system. The calculation steps of grey relational analysis are to determine the influencing factors of the system and the behavioral feature vector, data preprocessing, calculation of relational degree, relational degree analysis and sorting. The grey relational analysis method can quantitatively analyze various factors and their influence degrees, and this method requires little information for the research samples but can finally get more accurate research results. When the summary data of coal and gas outburst is extremely limited and has a large gray scale, it is very suitable to adopt the method of gray correlation analysis, and it can also eliminate the interference of human factors on the final result to a certain extent. The grey relational analysis method is very suitable for the situation of limited data, no typical law, large gray scale of data and human interference (Weidong et al., 2018). By analyzing the similarity between the behavior sequence of a system and the reference sequence, we can judge the tightness of the relationship between the two. The grey relational degree is used to map the degree of similarity in this kind of situation. The higher the degree of similarity between the two sequences, the higher the degree of association between the two sequences. First determine the reference series and the data comparison series of coal and gas, and let the time series at this time be
There are
1) Initial value transformation
Taking
At this time,
2) Mean transformation
Also let
3) Interval value transformation
Also let
At this time,
4) Inverse transformation
Taking
At this time,
5) Reciprocal transformation
Let
At this time,
The difference sequence at this time is as follows:
The maximum difference and minimum difference are expressed as:
It can be got,
According to the relevant information obtained from the analysis, based on the principle of establishing the risk prediction index of coal and gas outburst, and guided by the comprehensive action hypothesis, the coal and gas outburst risk prediction index system was successfully established. Formula (29) and formula (30) represent the correlation coefficient and the correlation degree, respectively. This paper also uses the method of grey relational analysis to determine the key factors causing coal and gas outburst through specific analysis of relevant factors, and makes a rigorous evaluation of the indicators. The key factors obtained by using the grey relational analysis method are the predictors needed in this paper, such as gas pressure, gas content, coal seam failure type, etc.
Based on the Unity3D engine, on its special tool, the system is designed and developed on the Unity3D engine tool with reference to the operation mode and composition of the digital twin wind flow control system. The Unity3D engine supports multiple format import, high-performance lighting system, AAA-level image rendering engine, realistic particle system, etc. In order to realize the parametric control of the wind flow control device, C language will be used to write and develop related control scripts, and at the same time, the control interface of the whole system will be designed and developed. On this basis, the entire air flow control system can perform complete particle simulation of dust and gas, and at the same time, the air flow control intelligent decision-making system can also realize the intelligent operation of the air flow control device.
The functions of the digital twin wind flow control system are as follows:
1) Particle simulation: In the system, the actual movement of gas, dust, etc. can be simulated. The dust or gas concentration in the monitoring area can be identified, so that the difficult-to-observe substances can be presented on the display with a special rendering simulation method.
2) Intelligent regulation: By analyzing the monitoring data collected in each area, the wind flow regulation virtual system can give relevant warnings to gas and dust. And when the concentration of gas and dust is about to exceed the warning concentration, the parameters of the wind flow are appropriately adjusted through the intelligent control system.
3) Motion control: The operator can manually adjust the parameters of the air outlet, so that the air outlet can make corresponding physical movements under the driving of the parameters. This function is convenient for operators to be familiar with the principle and provides certain convenience for related experiments.
4) Scenario display: By establishing a virtual simulation model, it provides operators with more operational cognition, such as parameter adjustment, sensor configuration, and air outlet control.
5) Regional monitoring: The configuration of related sensors of wind speed, gas and dust is changed by the operator in real time, so that the real-time data of each region can be graphically embodied. It can predict the changing trend of each region, and provide guarantee and basis for various control actions.
The system development process is shown in Figure 7. In the digital twin wind flow control system, the user interface is mainly developed and designed using the UGUI class controls in Unity3D. The system’s user interface and related structures of virtual entities are shown in Figure 8.
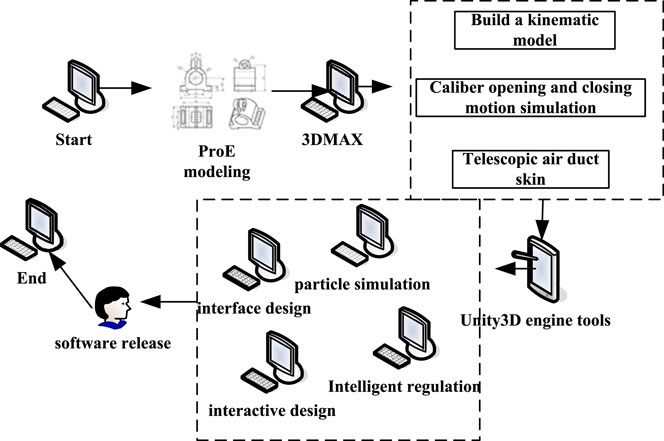
FIGURE 7. System development process.
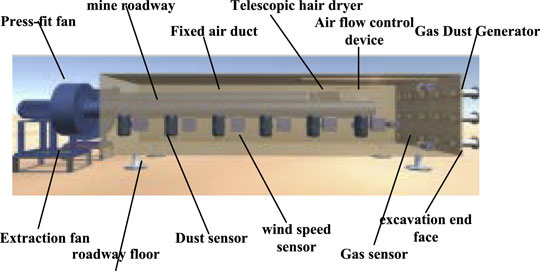
FIGURE 8. The construction of the virtual entity of the digital twin mine wind flow control.
The digital twin wind flow control system is essentially the mutual mapping of parameters and their corresponding physical entities. In the system, through the obtained various monitoring data, the modification of the parameters is guided, and the change of the parameters drives the physical entity to carry out corresponding movement changes, so as to realize the intelligent operation of the entire wind flow control device. At the same time, it changes the wind direction and speed in real time, thereby reducing the gas and dust concentrations in various areas of the entire mine.
The digital twin wind flow control system mentioned in the article is mainly designed and developed through the Unity3D engine tool. The system can establish the relationship model between the control system and the control device, and establish related simulation models for gas and dust. Under the relevant experiments and verification, the obtained data and conclusions are added to the model, so that the completeness of the entire system is improved.
The fusion of quantum theory with neural networks has given birth to the quantum gate node neural network, which is a new type of neural network and a very common quantum neural network. Quantum theory reveals the basic laws of the microscopic material world and lays a theoretical foundation for atomic physics, solid state physics, nuclear physics and particle physics. It can well explain the atomic structure, the regularity of atomic spectrum, the properties of chemical elements, the absorption and radiation of light, etc. Quantum logic gates are represented using unitary matrices. Just as common logic gates generally operate on one or two bits, common quantum gates also operate on one or two qubits. In this network, various types of information are transmitted through quantum revolving gates and controlled NOT gates. Thanks to the blessing of quantum theory, the network has greater computing advantages. The structure of the quantum gate node neural network is shown in Figure 9:
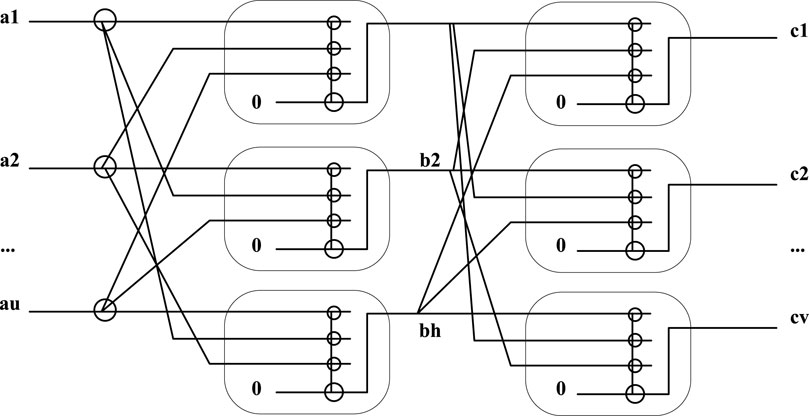
FIGURE 9. Quantum gate node neural network.
Let the quantum gate node neural network input be
Where the unknown is a normalization constant. At this time, the Formula of the quantum state input
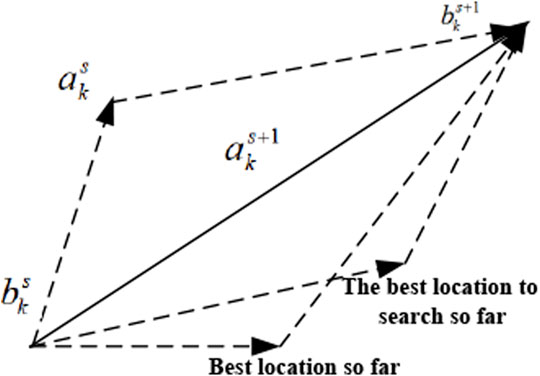
FIGURE 10. Particle evolution diagram.
Select multiple test functions with different characteristics to carry out related analysis and verification, and compare the final results with the standard particle swarm optimization algorithm, so as to evaluate the performance of the particle swarm optimization algorithm from multiple angles. Particle swarm optimization algorithm is a random search algorithm based on group cooperation developed by simulating the foraging behavior of birds. Among all the selected functions, the test functions such as Rastrigin, Griewank, and Sphere exhibit nonlinear characteristics. Genetic algorithm is a global optimization algorithm, but it also has the disadvantage that it may fall into local extreme value. The Rastrigin function can test the global search ability of the genetic algorithm. At the same time, the nonlinear characteristics of these functions are in line with the trend of coal and gas outburst prediction index data. Therefore, the variables of two of these functions are uncorrelated in order to compare and analyze related algorithms. In order to compare the optimization performance of the algorithm, when optimizing the test functions, the sub-dimension evolution particle swarm optimization algorithm and the standard particle swarm optimization algorithm are used for optimization respectively. The dimension of the test function is set to three-dimensional and the performance of the two algorithms is analyzed and compared, so as to effectively verify the performance of the algorithm. In this case, in addition to setting the dimension to three and limiting the maximum number of iterations to 1,200, the global optimal values of the three functions are all 0. The parameters of each function are shown in Table 1.
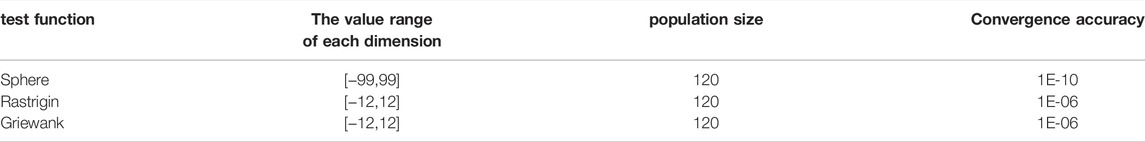
TABLE 1. The parameter values of the three functions.
In the parameter environment of the standard function, the PSO algorithm and the sdPSO algorithm are run 72 times respectively. Then, the performance of the two algorithms is compared by comparing the optimal solution, the number of iterations of the optimal solution, the average optimal solution, the success rate of optimization, and the average number of iterations. The minimum iteration times of the three functions under the two algorithms are shown in Table 2:

TABLE 2. Minimum number of iterations for three functions under two algorithms.
By comparing the optimal solution and the minimum number of iterations of the two algorithms, it can be seen that both can find the optimal solution of the function. At this time, the value of the minimum number of iterations of the two algorithms is also low, which verifies that the two algorithms have an effective optimization effect on the three types of standard test functions. Comparing the optimization success rates of the two algorithms, it can be seen that both algorithms have a 100% success rate when optimizing the Sphere function. However, in the optimization of the other two functions, the success rate of the PSO algorithm cannot meet the expected requirements, and there is a large gap with the sdPSO algorithm. This shows that the sdPSO algorithm has better performance when optimizing multimodal functions. The average number of iterations and the average optimal solution of the PSO algorithm and the sdPSO algorithm are shown in Table 3.
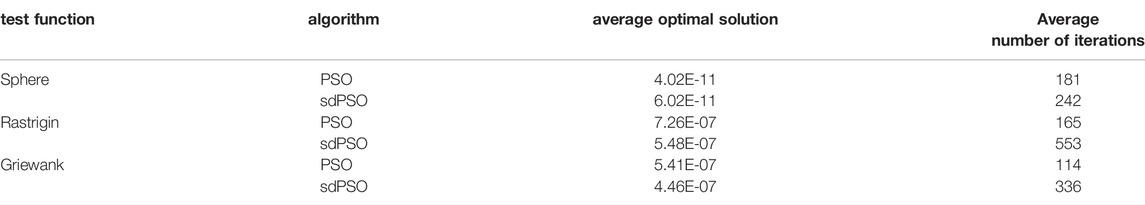
TABLE 3. Average number of iterations for three functions under two algorithms.
The analysis and comparison of the average optimal solutions of the two algorithms shows that when optimizing the Sphere function, the average optimal solution of the PSO algorithm is lower than that of the sdPSO algorithm. But in the optimization of the other two test functions, the average optimal solution of the PSO algorithm is higher than that of the sdPSO algorithm. It can be concluded that the sdPSO algorithm has better optimization ability when optimizing multimodal functions. The optimization curves of the three functions in the three-dimensional state are shown in Figure 11:
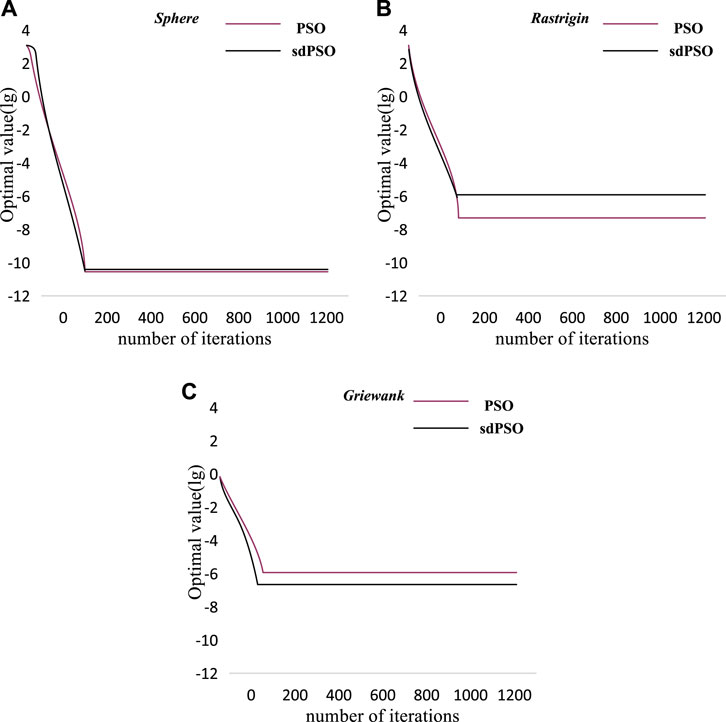
FIGURE 11. Three-dimensional optimization curves for three functions (among them, (A) is the Sphere function, (B) is the Rastrigin function, and (C) is the Griewank function).
Next, the same operation is used to obtain the curve in its dimensional state, as shown in Figure 12:
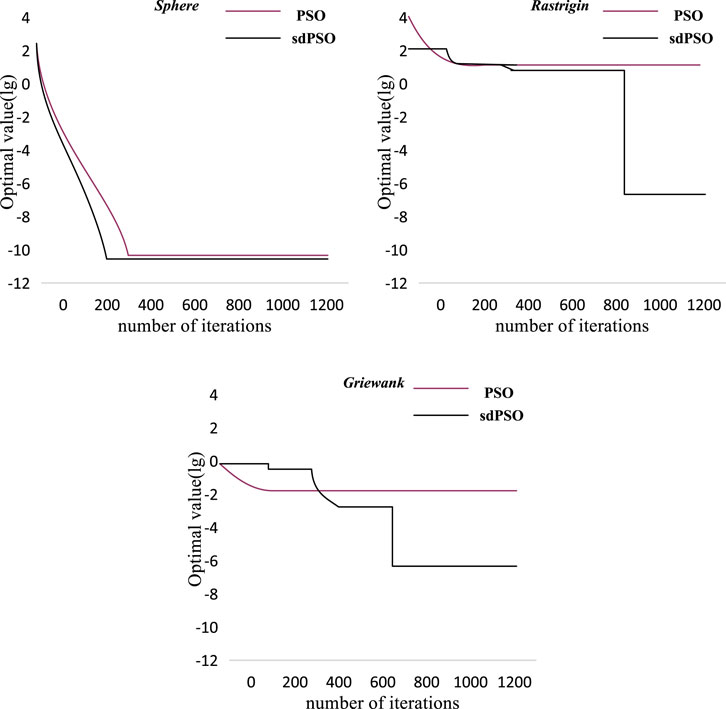
FIGURE 12. Optimization curves for three functions in 10-dimensional state.
Because the sub-dimension evolution strategy takes each dimension of the particle as a breakthrough, and performs mutation operation on the sub-dimension with poor diversity, the dimension of the standard test function is set to 3-dimensional and 10-dimensional to compare and analyze the performance of the two optimization algorithms. Therefore, the sdPSO function performs better when optimizing functions, especially multimodal functions.
For group coal mines with complex geological structure, there are strong pressure and in-situ stress inside. Therefore, it often occurs phenomena such as top drilling, injection holes, etc. A certain amount of samples are selected from coal mines, and the samples are crushed and then screened to obtain 0.14–0.32 mm coal powder. The obtained pulverized coal was compressed for 2 h using a pressure of 120 Mpa, and finally a sample of 48 × 48 ± 0.24 mm was obtained and sealed for preservation. With the assistance of 8 GB running memory, the relevant algorithms are written in the MatlabR2020b environment to build the sdPSO-QGNN gas outburst risk level prediction model. Real-time data was obtained from this coal mine and historical data were aggregated, and a total of 24 non-prominent and outburst data sets were obtained. 48 groups were selected to test the prediction model, and the remaining datasets were used to train the prediction model. The input of the quantum gate node neural network was set to five dimensions, and the output was set to four dimensions. Initialize the parameters of the PSO algorithm: the learning factors are 1 and 2, the maximum number of iterations is 240, the number of particles is 40, and the maximum flight speed is 1. The sdPSO algorithm is also initialized: the learning factor is 2, the maximum number of iterations is 240, the number of particles is 40, and the inertia weight is 1. The prediction model is trained with the remaining samples, and the energy function obtained by QGNN after optimization by the PSO algorithm and the sdPSO algorithm changes with the number of iterations as shown in Figure 13:
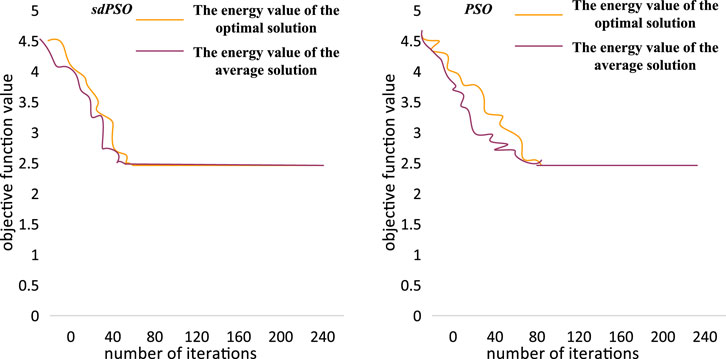
FIGURE 13. Neural network energy iteration steps under two algorithms.
It can be seen that the value of the energy function optimized by the sdPSO algorithm is significantly lower than the corresponding value optimized by the PSO function. Moreover, it can be seen from the Formula calculation that after the QGNN is optimized by the sdPSO algorithm, the output result has a lower error, and the error is 2.0914. The error of the output result after optimization by PSO algorithm is 3.1613.
The test sample is added, and after normalization, the input matrix of the quantum state is obtained. In this prediction model, the learning step size is set to 0.001, and the maximum number of iterations of this model is set to 2,800. From this data, a comparison between the predicted and actual values of coal and gas outburst intensity is obtained.
According to the comparison results in Figure 14, the predicted values of coal and gas outburst intensity are very close to their actual values. Therefore, the sdPSO-QGNN optimal prediction model has a strong ability to deal with nonlinear data, and has a very obvious advantage in regression analysis. Comparing the prediction level and the pre-actual level, it can be seen that the two almost coincide. In the analysis and research of coal and gas outburst phenomenon, the prediction accuracy rate of 90% is high-precision prediction. The specific value of the prediction accuracy in this paper is as high as 95%, indicating that the optimal prediction model of sdPSO-QGNN has a very high prediction accuracy.
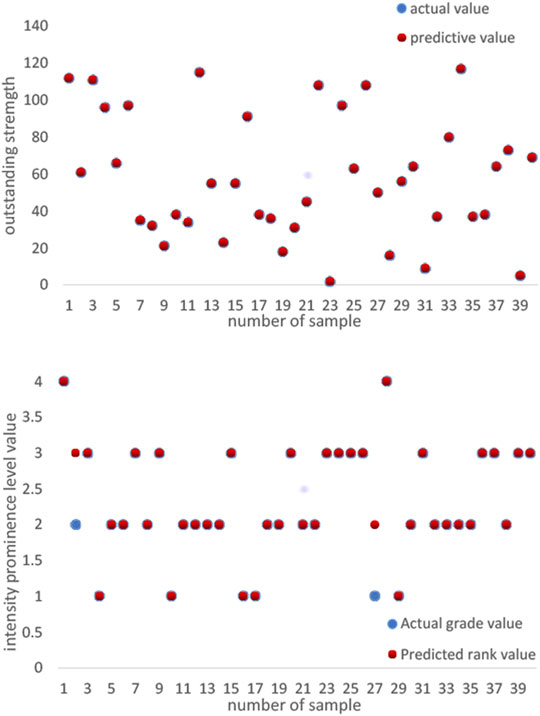
FIGURE 14. Prediction accuracy of sdPSO-QGNN prediction model on coal and gas outburst intensity.
Coal and gas accidents occur frequently in mines, which seriously threatens the safe collection of coal mines. The frequent occurrence of accidents has also brought a lot of obstacles to the development of the whole society and economy. Therefore, the outburst prediction of coal and gas is a top priority. High-precision prediction can bring extremely significant help to the safety of mine production, and can also avoid the occurrence of many accidents. This paper focuses on the research on the prediction system of coal and gas, which has the characteristics of nonlinearity and complexity. Therefore, particle swarm optimization algorithm needs to be used to optimize the prediction. For this model, this paper adopts a variety of example methods to verify multi-dimensionality, and analyzes the experimental results. In the three-dimensional state and ten-dimensional state, the performance of the algorithm proposed in this paper is relatively superior, and in the prediction model, the algorithm proposed in this paper is also very accurate in predicting the coal and gas outburst intensity.
It can be seen from the experiments in this paper that the sdPSO algorithm is significantly better than the PSO algorithm in the comprehensive performance of optimization. The sdPSO-QGNN outburst prediction model is used to predict the outburst of coal and gas, which has higher accuracy and greater advantages. In this paper, training samples and test samples are used to train the model, and the final prediction accuracy reaches 95%.
The original contributions presented in the study are included in the article/Supplementary Material, further inquiries can be directed to the corresponding author.
ZW-writing and editing.
The author declares that the research was conducted in the absence of any commercial or financial relationships that could be construed as a potential conflict of interest.
All claims expressed in this article are solely those of the authors and do not necessarily represent those of their affiliated organizations, or those of the publisher, the editors and the reviewers. Any product that may be evaluated in this article, or claim that may be made by its manufacturer, is not guaranteed or endorsed by the publisher.
Abooali, D., and Khamehchi, E. (2019). New Predictive Method for Estimation of Natural Gas Hydrate Formation Temperature Using Genetic Programming. Neural Comput. Applic 31, 2485–2494. doi:10.1007/s00521-017-3208-0
Bo, Z., Wen, G., Sun, H., and Bo, W. (2018). Similarity Criteria and Coal-like Material in Coal and Gas Outburst Physical Simulation[J]. Int. J. Coal ence Technol. 5 (2), 167–178.
Chatterjee, S., Sarkar, S., Hore, S., Dey, N., Ashour, A. S., and Balas, V. E. (2017). Particle Swarm Optimization Trained Neural Network for Structural Failure Prediction of Multistoried RC Buildings. Neural Comput. Applic 28 (8), 2005–2016. doi:10.1007/s00521-016-2190-2
Chen, L., Wang, E., and Feng, J. (2017). Hazard Prediction of Coal and Gas Outburst Based on Fisher Discriminant Analysis[J]. Geomechanics Eng. 13 (5), 861–879.
Chengwu, L. I., Shuai, F. U., Xie, B., Zhang, M., Dong, L., Wang, F., et al. (2018). Establishment of the Prediction Model of Coal and Gas Outburst Energy and its Application in Pingdingshan Mining Area[J]. J. China Univ. Min. Technol. 47 (2), 231–239.
Choi, M. L., Lim, M. J., and Kwon, Y. M. (2017). A Study on the Prediction Method of Emergency Room (ER) Pollution Level Based on Deep Learning Using Scattering Sensor[J]. J. Eng. Appl. Sci. 12 (10), 2560–2564.
Ghassemzadeh, S., Gonzalez Perdomo, M., Haghighi, M., and Abbasnejad, E. (2021). A Data-Driven Reservoir Simulation for Natural Gas Reservoirs. Neural Comput. Applic 33, 11777–11798. doi:10.1007/s00521-021-05886-y
Jain, N. K., Nangia, U., and Jain, J. (2018). A Review of Particle Swarm Optimization[J]. J. Institution Eng. 99 (4), 1–5. doi:10.1007/s40031-018-0323-y
Li, C., Mahadevan, S., You, L., Choze, S., and Wang, L. (2017). Dynamic Bayesian Network for Aircraft Wing Health Monitoring Digital Twin[J]. AIAA J. 55 (3), 1–12. doi:10.2514/1.j055201
Li, D. J., Li, Y. Y., Li, J. X., and Fu, Y. (2018). Gesture Recognition Based on BP Neural Network Improved by Chaotic Genetic Algorithm[J]. Int. J. Automation Comput. 15 (03), 1–10. doi:10.1007/s11633-017-1107-6
Liu, H., Dong, Y., and Wang, F. (2021). Prediction Model for Gas Outburst Intensity of Coal Mining Face Based on Improved PSO and LSSVM. Energy Eng. 118 (3), 679–689. doi:10.32604/ee.2021.014630
Lü, J., Xie, R., Zhou, W., Liu, Y., and Zhang, C. (2017). Application of LM-BP Neural Network in Simulation of Shear Wave Velocity of Shale Formation[J]. J. China Univ. Petroleum(Edition Nat. Sci. 41 (3), 75–83.
Nouh, M. I., Azzam, Y. A., and Abdel-Salam, E. A.-B. (2021). Modeling Fractional Polytropic Gas Spheres Using Artificial Neural Network. Neural Comput. Applic 33, 4533–4546. doi:10.1007/s00521-020-05277-9
Pan, Q., Dong, H., Han, Q., Wang, Y., and Ding, R. (2017). A Computing Method for Attribute Importance Based on BP Neural Network[J]. J. Univ. Sci. Technol. China 47 (1), 18–25.
Peng, L., Xu, D., Zhou, Z., Lee, W. J., and Bo, Z. (2017). Stochastic Optimal Operation of Microgrid Based on Chaotic Binary Particle Swarm Optimization[J]. IEEE Trans. Smart Grid 7 (1), 66–73.
Qi, L., Tang, X., Wang, Z., and Peng, X. (2017). Pore Characterization of Different Types of Coal from Coal and Gas Outburst Disaster Sites Using Low Temperature Nitrogen Adsorption Approach. Int. J. Min. Sci. Technol. 27 (2), 371–377. doi:10.1016/j.ijmst.2017.01.005
Schleich, B., Anwer, N., Mathieu, L., and Wartzack, S. (2017). Shaping the Digital Twin for Design and Production Engineering. CIRP Ann. 66 (1), 141–144. doi:10.1016/j.cirp.2017.04.040
Tang, Y., and Guan, X. (2017). Parameter Estimation for Time-Delay Chaotic System by Particle Swarm Optimization[J]. Chaos Solit. Fractals 40 (3), 1391–1398.
Wang, C., Zhang, H., Fan, W., and Ma, P. (2017). A New Chaotic Time Series Hybrid Prediction Method of Wind Power Based on EEMD-SE and Full-Parameters Continued Fraction. Energy 138 (nov.1), 977–990. doi:10.1016/j.energy.2017.07.112
Wang, J., Zhou, Z., Zhang, J., Yu, Y., and Liu, Q. (2017). SαS-PNN Model for Forecast of Coal and Gas Outburst Risk and its Application[J]. Chin. J. Sensors Actuators 30 (7), 1112–1118.
Wang, J., Fang, K., Pang, W., and Sun, J. (2017). Wind Power Interval Prediction Based on Improved PSO and BP Neural Network. J. Electr. Eng. Technol. 12 (3), 989–995. doi:10.5370/jeet.2017.12.3.989
Weidong, G., Deyong, G., and Yueqiang, L. (2018). Prediction Model of Coal and Gas Outburst Based on Rough Set-Unascertained Measure Theory[J]. J. Eng. Technol. Sci. 50 (6), 758–777.
Xia, T., Zhong, J., and Zhang, Y. (2018). Non-invasive Continuous Blood Pressure Measurement Based on Mean Impact Value Method, BP Neural Network, and Genetic Algorithm[J]. Technology and Health Care. official J. Eur. Soc. Eng. Med. 26 (6), 1–15.
Xu, J., Geng, J., Peng, S., Yuan, M., and Luo, X. (2018). Analysis of the Pulsating Development Process of Coal and Gas Outburst[J]. J. China Univ. Min. Technol. 47 (1), 145–154.
Keywords: digital twin, BP neural network, grey relational analysis, particle swarm optimization, quantum gate node
Citation: Wang Z (2022) Prediction Method of Coal and Gas Outburst Intensity Based on Digital Twin and Deep Learning. Front. Energy Res. 10:891184. doi: 10.3389/fenrg.2022.891184
Received: 07 March 2022; Accepted: 18 April 2022;
Published: 30 May 2022.
Edited by:
Fadi Al-Turjman, Near East University, CyprusReviewed by:
Gaoqing Ji, Hebei University of Architecture, ChinaCopyright © 2022 Wang. This is an open-access article distributed under the terms of the Creative Commons Attribution License (CC BY). The use, distribution or reproduction in other forums is permitted, provided the original author(s) and the copyright owner(s) are credited and that the original publication in this journal is cited, in accordance with accepted academic practice. No use, distribution or reproduction is permitted which does not comply with these terms.
*Correspondence: Zhiquan Wang, d3pxX2FkMjAyMUAxNjMuY29t
Disclaimer: All claims expressed in this article are solely those of the authors and do not necessarily represent those of their affiliated organizations, or those of the publisher, the editors and the reviewers. Any product that may be evaluated in this article or claim that may be made by its manufacturer is not guaranteed or endorsed by the publisher.
Research integrity at Frontiers
Learn more about the work of our research integrity team to safeguard the quality of each article we publish.