 Baocheng Wu1
 Fengchao Xiao
- 1PetroChina Xinjiang Oilfield Company, Karamay, China
- 2Education Ministry Key Laboratory of Petroleum Engineering, China University of Petroleum, Beijing, China
Efficient development of deep tight reservoirs in the southern margin of the Junggar Basin requires stimulation technology, and effective propped hydraulic fractures are the key to successful stimulation. To optimize the proppant selected for reservoir stimulation, the important parameters of proppant selection were determined through the proppant conductivity evaluation experimental study and field test, considering the influences of high temperature and high closure pressure. The results show that closure pressure, temperature, and sand concentration have a great influence on the conductivity of the proppant pack. The conductivity of the proppant pack decreases by about 10% at high temperatures, which is because the high temperature will rupture more proppant and thus reduce proppant pack permeability. In the long term, the Scenario B placement pattern can maintain high conductivity, and the long-term conductivity is increased by 6–26% compared with the Scenario C placement pattern. Furthermore, increasing the proppant placement concentration is conducive to the long-term conductivity of the fracture. During the operation of the test well, the treatment pressure was stable, and the fractures were effectively propped. No proppant flowing back occurred in the test production after the fracturing treatment, which achieved the purpose of the evaluation well, provided support for the large-scale development of subsequent development wells, and ensured orderly development.
Introduction
The southern margin of the Junggar Basin has experienced a long exploration history, mainly including the discovery of shallow oil reservoirs in the Dushanzi and Paleoproterozoic reservoirs in the Caindik backslope, good shows of oil and gas in the deep Cretaceous and Jurassic in the Dushan No.1 well in 2011, and high production in the Cretaceous Qingshuihe Formation under the Gaoquan backslope Gao Tan No.1 well in 2019 (Kuang, 1991; Wang et al., 2013; Zhi, 2018). The significant breakthrough of the Gao Tan No.1 well fully indicates that the deep southern margin has a favorable reservoir formation system with a large development potential (Chen, 2019). Belonging to the deep high-temperature and high-pressure reservoir, the burial depth of the Lower Cretaceous Qingshuihe Formation in the Gao Tan No.1 well is 5768–5775 m, the reservoir temperature is 139.58°C, the original formation pressure is 134.00 MPa, and the lithology is mainly sandstone and sand conglomerate (Jin et al., 2019; Mao et al., 2020). For the effective development of ultra-deep wells, well drilling (Feng et al., 2016; Zhuo et al., 2020), fracturing treatment (Li et al., 2012; Liu et al., 2012; Li et al., 2007), and production system (Du et al., 2020) are facing great challenges. The ultimate goal of the stimulation is to provide long-term effective hydraulic fractures, to which the key lies in the effective support of proppant adapted to the high closure pressure and high temperature of the reservoir.
Under the condition of high temperature and high pressure, the width of hydraulic fracture is generally small, which is not conducive to the transportation of proppant and faces the risk of sand plugging. The key point to successful stimulation is to add proppant safely and effectively prop fractures. For the Tarimuk deep gas field (burial depth about 6500–8000m, pressure coefficient between 1.60 and 1.85, and formation temperature between 125 and 182°C), Che et al. (2018) and Jiang et al. (2018) used the multi-stage proppant plug during the pad stage and multi-stage size combination to effectively reduce the sand plugging risk. Mi et al. (2015) used horizontal well multi-stage fracturing technology to implement treatments in the Shun NO.9 well block with deep burial and high closure pressure and fracture pressure, and the fracturing fluid was selected from water-based freeze gel. Besides, the proppant selection was 30/50 mesh high-strength ceramic. The fracturing well got good production. The deep tight gas well in the Sultanate of Oman was buried at a depth of 5000 m, with a formation pressure of 64 MPa and a reservoir temperature of 166°C. Two sets of fracturing fluid systems were optimized during the fracturing treatments. One set is the cross-linked fracturing system +20/40 mesh high-strength ceramic and the other is the linear fracturing system +30/50 mesh high-strength ceramic (Kindi et al., 2019). The lower Tertiary Wilcox sandstone reservoir in the Gulf of Mexico, United States, has a vertical depth of burial of more than 7900 m, a reservoir pressure of 127–135 MPa, and a maximum reservoir temperature of around 126°C. The reservoir develops several small layers, so the single-trip multizone completion technique was developed, and the proppant selection was 20/40-mesh ceramic (Ogier et al., 2011). Overall, single particle size and multi-stage particle size combinations of proppant selection have been used for deep reservoir development. The research studies mentioned previously only verify the feasibility of the sanding mode through field treatments and do not carry out systematic comparative experimental research to evaluate the differences of various sanding modes and optimize the optimal proppant adding mode.
As the deep reservoir on the southern margin is explored and developed, the ultra-deep Jurassic strata will become the target reservoir for development. To obtain long-term high single-well production from the high-temperature and high-pressure reservoirs, this study optimized the proppant placement pattern to match the high-temperature and high-pressure reservoir conditions of the Jurassic Toutunhe Formation and conducted field tests, forming adding sand fracturing treatment tech for the subsequent efficient development of the southern margin zone.
Laboratory Experiments
Experimental Setup
Fracture Conductivity Test
The laboratory fracture conductivity test is an effective method for evaluating the fracturing effect. Many scholars have carried out a large number of conductivity experiments on different reservoirs and studied the variation rule of conductivity of fractures under various conditions (Gaoyuanp, 2012; Cipolla et al., 2019). In this study, the conductivity test system (FCES-100) was used to get the proppant pack’s conductivity. The schematic of the test setup is illustrated in Figure 1. The design and operation of the device are in strict accordance with API standards. It can be designed to evaluate the conductivity under different reservoir conditions and different influencing factors. Brine flow is regulated using two parallel pump controllers at a constant flow rate of 2–5 ml/min. The gauge is calibrated over a range of 0–300 kPa with an accuracy of ±0.25%F.S. Figure 2 is the section view of the conductivity cell; the cell consists of Hastelloy platens with seals at the top and the bottom, and the proppant is sandwiched between the top and bottom surface steel platens. The heating element of the conductivity cell is composed of two heating rods; the temperature control system of the FCES-100 will control the test temperature.
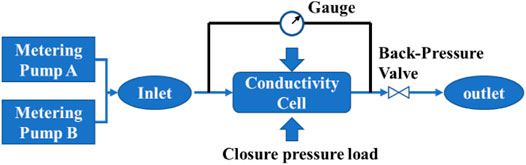
FIGURE 1. Schematic of the experimental setup.

FIGURE 2. Components of the conductivity cell.
The conductivity of the proppant pack can be calculated using the following formula:
where k is the proppant pack permeability, um2; Wf is the width of the proppant pack, cm; Q is the flow rate, cm3/s; μ is the fluid viscosity, mPa·s; and ∆p is the pressure differential through the test section, kPa.
Proppant Crushing Rate Test
The proppant crushing ratio test device consists of the crushing chamber and the axial load platform as shown in Figure 3. The crushing ratio can be calculated using the formula (2).
where
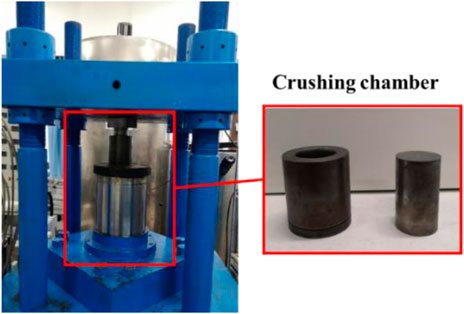
FIGURE 3. Test device of the proppant crushing ratio.
Major Experimental Parameters
The closure pressure of the target Formation in the southern margin of the Junggar Basin is about 100 MPa and the temperature is about 150°C, so the temperatures of the design experiment were set to 26°C (the ambient temperature) and 150°C, and the closure pressure range was set to 90–105 MPa, with five pressure points (see Table 1). In order to make the test liquid maintain liquefaction at the high temperature, the test back-pressure was set to 150 kPa. In our study, the test liquid was water with 10 wt% KCL brine to simulate the formation water, and the ceramic proppant (30/50 mesh and 40/70 mesh) was used. The proppant concentrations were set to 2.5, 5, 7.5, and 10, respectively.
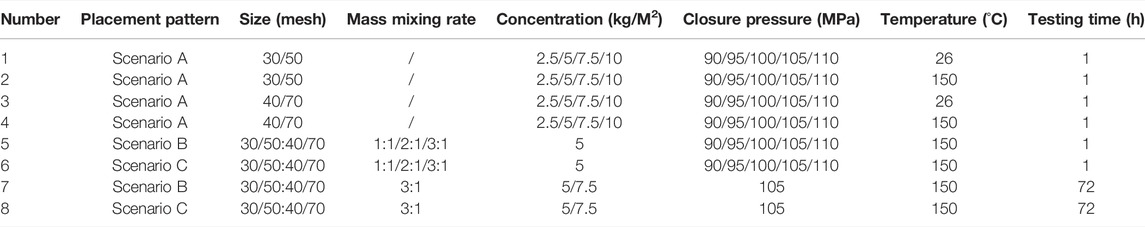
TABLE 1. Experimental parameters.
In this study, there are three proppant placement patterns to analyze the effects of proppant placement patterns on proppant pack conductivity as shown in Figure 1. Scenario A is the uniform pattern, where the proppant pack contains only one particle size. Scenario B is the sequence placement pattern, where the proppant particles are arranged in accordance with the decreasing-size order. The smaller-size proppant was arranged at the entrance part of the cell, and the larger was arranged at the export part (see Figure 1 Scenario B). Scenario C is the mixture-uniform placement pattern, in which the two different sizes of proppant were mixed and uniformly placed in the conductivity cell (see Figure 4 Scenario C). As shown in Table 1, different mixing ratios were set for both Scenario B and Scenario C for comparison experiments.
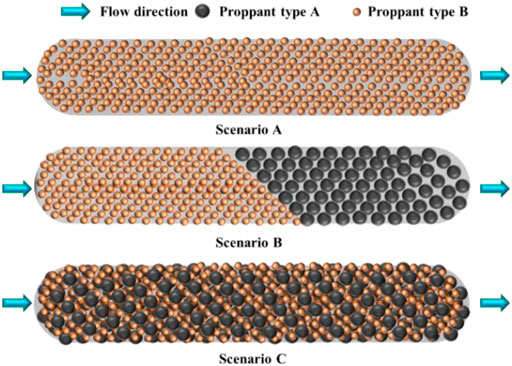
FIGURE 4. Schematic diagram of the proppant placement patterns.
The proppant embedment leads to implications on proppant conductivity (LaFollette and Carman, 2010; Mittal, 2018; Tang et al., 2018). However, the reservoir of the Toutunhe Formation in the southern margin is buried about 6 km deep, meaning that it is very difficult to take the downhole cores. In addition, the lithology is mainly conglomerate, so it is difficult to obtain rock plates for our experiments. All experiments were conducted using steel plates, ignoring the effects of proppant embedment.
Results and Discussion
Single-Particle Size Short-Term Conductivity
Figure 5 shows the conductivity of 30/50 mesh ceramic proppant; the dotted line represents the proppant conductivity at 150°C, and the solid line represents 26°C. With the closure pressure increasing, the conductivity decreases gradually. As the closure pressure increased from 90 to 110 MPa, the conductivity decreased around 38–48% at the 26°C testing condition, whereas it was 31–43% at 150°C. Closure pressure can have a tremendous impact on proppant embedment (Raysoni and Weaver, 2013; Wang et al., 2020), leading to implications for proppant conductivity. When tested at 26°C, compared with the conductivity of the proppant with small particle size (40/70 mesh), the proppant with the larger particle size (30/50 mesh) increases by 17–32 and 23% on average under the same concentration and closure pressure. In comparison, it is 9–25 and 18% on average at 150°C. Besides, the size of the proppant particle has a great influence on the proppant pack conductivity; the crushing rate of the small particle size is much smaller than that of the large particle size (see Figure 7). In addition, the conductivity increases with the concentration of the proppant pack. More specifically, when the concentration increases from 2.5 kg/m2 to 5.0 kg/m2 under 105 MPa at the 150°C testing condition, the conductivity is enhanced by 63% as shown in Figure 5.
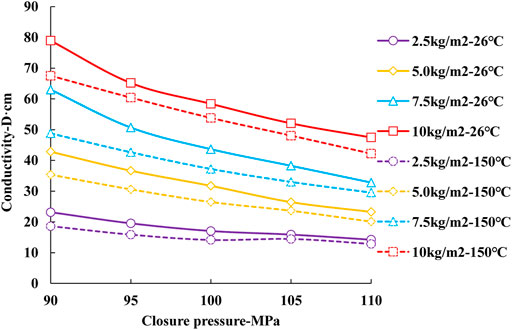
FIGURE 5. Conductivity of 30/50 mesh ceramic proppant under different closure pressures and concentrations.
It can be seen from Figure 5 and Figure 6 that the conductivity at high temperature (150°C) is lower than that at ambient temperature (26°C). Figure 7 illustrates the crushing rates of the 40/70 mesh proppant and 30/50 mesh proppant. The 26°C-pre-test bar represents the crushing rate of the proppant under 105 MPa at 26°C. The 26°C-post-test bar is the crushing rate of the proppant pack after one hour of testing with 5 kg/m2 under 105 MPa at 26°C, and the 150°C-post-test bar is the crushing rate of the proppant pack (40/70 mesh) after one hour of testing with 5 kg/m2 under 105 MPa at 150°C. By contrast, the high-temperature effect increases the crushing rate of the 30/50 mesh proppant and 40/70 mesh proppant by 5 and 9%, leading to the conductivity dropping by 9 and 10%, respectively. Figure 8 shows morphological characteristics of crushing proppant after one hour of testing with 5 kg/m2 under 105 MPa at 26 and 150°C. As the testing temperature rises, the degree of proppant breakage increases. In addition, the broken particle size is much smaller (see Figure 7 and Figure 8). Overall, the high temperature causes more fine particles to break up and lower proppant pack permeability.
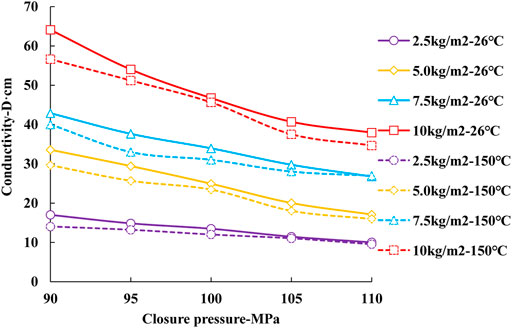
FIGURE 6. Conductivity of 40/70 mesh ceramic proppant under different closure pressures and concentrations.
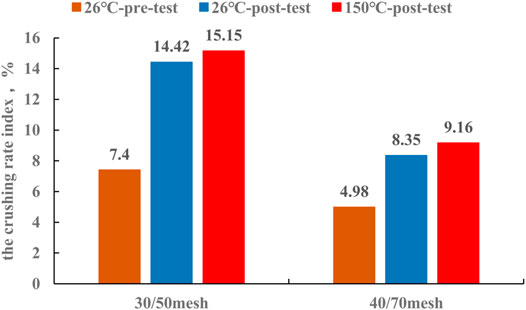
FIGURE 7. Bar chart of 40/70 mesh and 30/50 mesh ceramic proppant crushing rates.
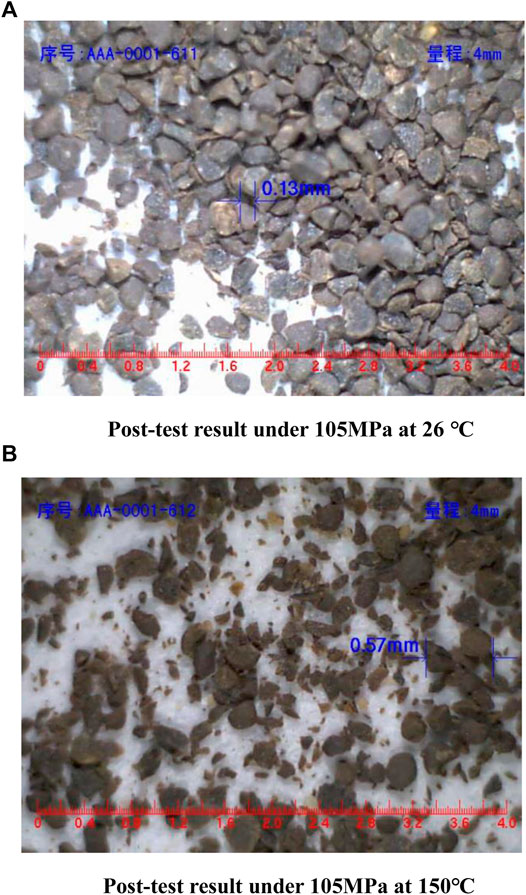
FIGURE 8. Morphological characteristics of crushing proppant (40/70 mesh). (A) Post-test result under 105 MPa at 26°C. (B) Post-test result under 105 MPa at 150°C.
Mixing Particle Size Short-Term Conductivity
As shown in Figure 9, the yellow and green lines are reference lines, representing the conductivity of 30/50 mesh proppant and 40/70 mesh proppant at a concentration of 5.0 kg/m2, respectively. The dotted line represents the conductivity of the Scenario C placement pattern and the solid line denotes the Scenario B placement pattern. Figure 9 shows that the larger the 30/50 mesh proppant mixing ratio, the greater the conductivity of the proppant pack. When the mixing ratio of 30/50 mesh and 40/70 mesh is 3:1, the conductivity is similar to that of the single-particle size (30/50 mesh) as shown in Figure 9. Under the same mixing ratio, Scenario B and Scenario C have similar conductivity.
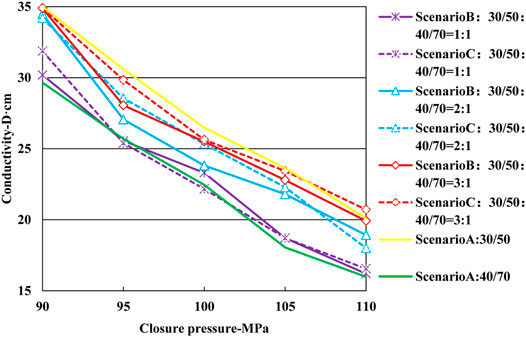
FIGURE 9. Conductivity with various mixture ratios and different placement patterns.
After one hour of testing, Scenario A and Scenario C formed a stable proppant pack (Figures 10A,B). In comparison, the 40/70 mesh proppant pack in Scenario B was still loose as shown in Figure 10B (left). Uniform placement and large particle size placement at the fracture entrance can effectively reduce proppant backflow.
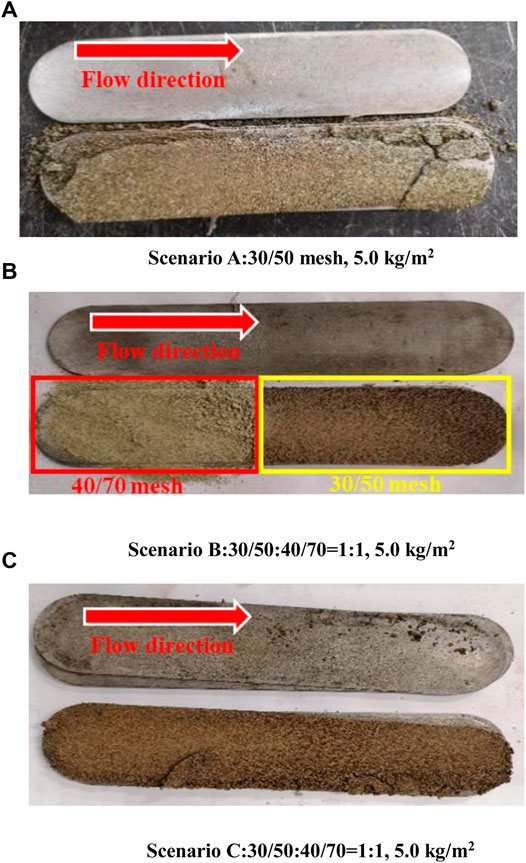
FIGURE 10. Proppant distribution after testing. (A) Scenario A: 30/50 mesh, 5.0 kg/m2. (B) Scenario B: 30/50:40/70 = 1:1, 5.0 kg/m2. (C) Scenario C: 30/50:40/70 = 1:1, 5.0 kg/m2.
Mixing Particle Size Long-Term Conductivity
During the 72-h test, there were two main changes in conductivity. One is that conductivity decreases rapidly during the first 24 h of testing, and the other is that conductivity remains relatively stable after 24 h of testing (see Figure 11). At the concentration of 7.5 kg/m2, the conductivity in Scenario B decreased by 34% and that in Scenario C by 43%. As for the concentration of 5 kg/m2, they are 60 and 72%, respectively. In terms of long-term conductivity, the Scenario B placement pattern is better than the Scenario C placement pattern. Increasing proppant pack concentration can help to maintain the high conductivity of fractures for a long time.
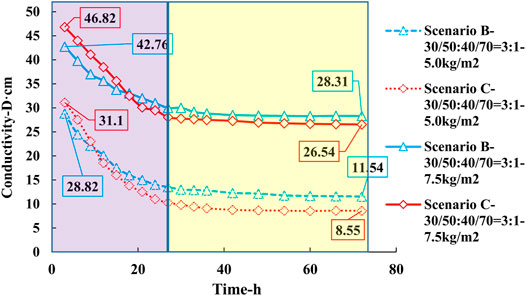
FIGURE 11. Long-term conductivity under different placement patterns and different concentrations.
Field Treatment and Effect Analysis
The GX1 well is an evaluation well of the thrust belt in the southern margin of the Junggar Basin. The reservoir lithology is mainly composed of gray silt-fine sandstone, fine sandstone, and conglomeratic with a burial depth of 5860 m. The reservoir’s effective thickness is around 6.0 m, the porosity is 8.3%, and the permeability is 0.258 mD. Based on the logging interpretation result, the predicted minimum horizontal stress is 139.2 MPa, and formation pressure is 134.47 MPa. The horizontal stress difference is 15–25 MPa.
Fracturing Job Design
Aiming at the optimal production of the GX1 well, the fracture conductivity and propped fracture length are optimized using Meyer software. The optimization results are displayed in Figure 12 and Figure 13. The optimal fracture conductivity is 22 D·cm and the propped fracture length is 180 m. The specific simulation parameter settings are shown in Table 2.
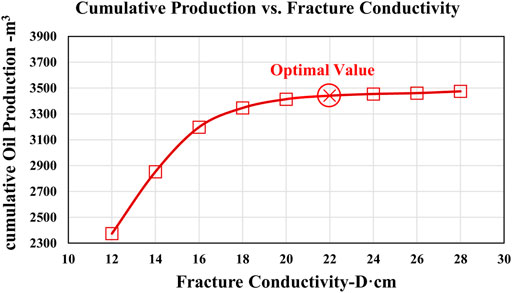
FIGURE 12. Diagram of the relationship between conductivity and cumulative oil production.
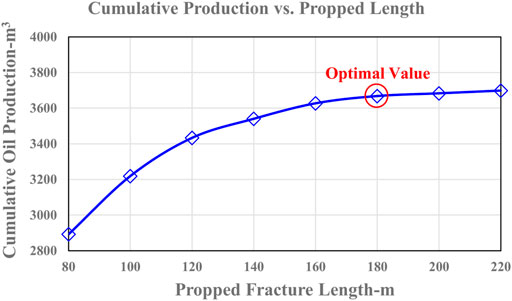
FIGURE 13. Diagram of the relationship between propped fracture length and cumulative oil production.
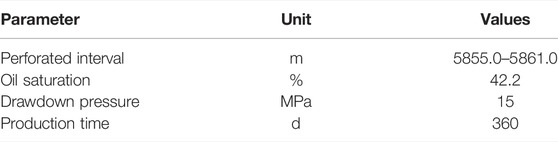
TABLE 2. Table of simulation parameter values.
The wellbore configuration and perforated interval are shown in Figure 14. The perforation mode is helix distributing perforation, and the shot density is 16 holes per meter. A conventional oil-pipe injection was used in the treatment.
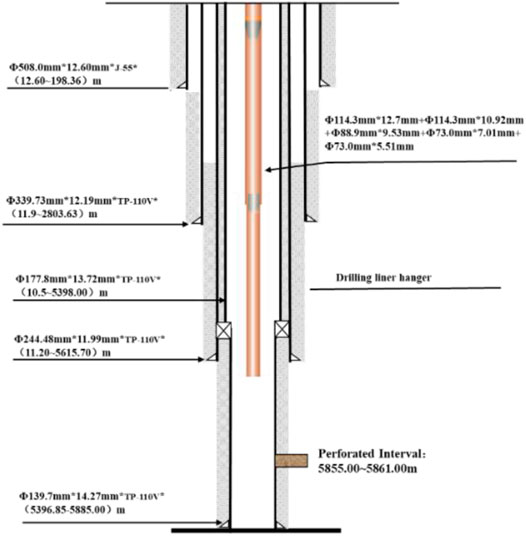
FIGURE 14. Wellbore configuration of the GX1 well.
The difficulty of high-temperature and high-pressure ultra-deep well stimulation is reducing pump pressure, pumping proppant smoothly, and making the hydraulic fracture propped effectively. The well uses the high-density (1.2 g/cm3) guanidine gum fracturing fluid (64.8 mPa·s) to reduce pumping pressure. Based on the experimental results (Results and Discussion Section), the Scenario B placement pattern was adopted to carry out field tests. The mixing ratio of 30/50 mesh proppant and 40/70 mesh proppant is 3:1. The 40/70 mesh proppant was first injected as a segment plug to reduce friction near the wellbore, followed by successive injections of 30/50 mesh proppant to obtain high conductivity. To achieve the optimal conductivity value, the proppant pack concentration is about 6 kg/m3.
Fracturing Operation
Figure 15 shows the GX1 well’s simulation curve. The total amount of fracturing fluid used in the well was 556.0 m3, adding 36.2 m3 of 40/70 mesh and 30/50 mesh ceramic, with an average sand ratio of 14.66%. The pump pressure is 100.0–116.0 MPa, the slurry rate is 3.0–4.5 m3/min, the breakdown pressure is 113.0 MPa, and the instantaneous shut-in pressure is 91.2 MPa, as shown in Figure 15. The overall pump pressure is stable during the treatment.
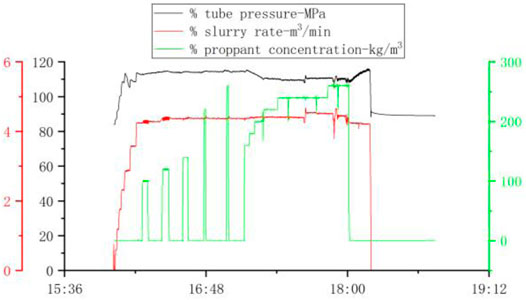
FIGURE 15. Field fracturing operation curve of the GX1 well.
Fracturing Effect Evaluation
The 4.0–5.0 mm choke was recommended and used in the GX1 well. During the 15 days of production, the oil pressure dropped from 33.27 to 17.60 MPa, daily average production of oil is 1.21 t, cumulative production of oil is 11.55 t, daily average production of water is 134.57 m3, and cumulative production of water is 2256.95 m3. The net pressure fitting of the GX1 well shows that the maximum net pressure is 8 MPa, the fracture height is 34 m, the fracture length is 196 m, and the proppant pack concentration is 5.9 kg/m3 as shown in Table 3 and Figure 16. The reservoir has been well stimulated. No proppant flowing back was detected, confirming that the proppant combination was a good match for the high-temperature and high-pressure reservoir.
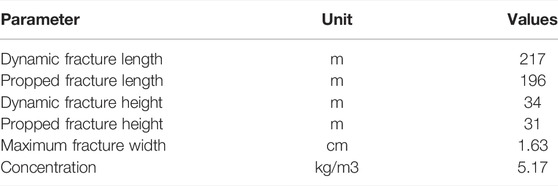
TABLE 3. Fracture parameters are retrieved by net pressure matching of the GX1 well.
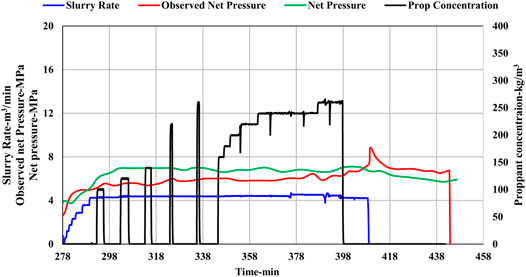
FIGURE 16. Net pressure matching curve of the GX1 well.
Conclusions
In this study, a series of experiments were studied to analyze the effects of the closure pressure, high temperature, and proppant placement patterns on the fracture conductivities. Finally, the field test was carried out. The results indicate the following conclusions:
1) Closure pressure and temperature have a great influence on the conductivity of the proppant. The proppant conductivity decreases by about 10% at high temperatures due to the fact that the crushing rate of proppant increases with increasing temperature. In addition, the closure pressure increased from 90 to 105 Mpa, and the conductivity decreased by 40–49%.
2) Under the condition of mixed particle size, the higher the proportion of 30/50 mesh proppant, the higher the conductivity. When the mixing ratio of 30/50 mesh and 40/70 mesh is 3:1, the conductivity is similar to that of the single-particle size (30/50 mesh). From the perspective of long-term conductivity, the Scenario B placement pattern performs best. Furthermore, appropriately increasing the placement concentration is conducive to the long-term conductivity of the fracture.
3) The Scenario B placement pattern was adopted to carry out the field test. The treatment pressure is within the safe pressure limit range, the pressure fluctuation is small, and the proppant is added smoothly. The post-fracture analysis shows that the stimulation is satisfactory and no proppant flowing back phenomenon occurs.
Data Availability Statement
The raw data supporting the conclusion of this article will be made available by the authors, without undue reservation.
Author Contributions
BW and FX are in charge of experimental design, MK and BW are in charge of experimental development and data analysis, and SZ is responsible for manuscript modification and overall coordination.
Funding
This work is supported by the Petrochina Strategic Cooperation Science and Technology Project (ZLZX 2020-02-07-03).
Conflict of Interest
BaW, MK, and BiW were employed by PetroChina Xinjiang Oilfield Company.
The remaining authors declare that the research was conducted in the absence of any commercial or financial relationships that could be construed as a potential conflict of interest.
The reviewer (HG) declared a shared affiliation with the authors (FX and SZ) to the handling editor at the time of review.
Publisher’s Note
All claims expressed in this article are solely those of the authors and do not necessarily represent those of their affiliated organizations, or those of the publisher, the editors, and the reviewers. Any product that may be evaluated in this article, or claim that may be made by its manufacturer, is not guaranteed or endorsed by the publisher.
References
Che, G., Wang, Y., Peng, J., and Yang, X. (2018). Sand Fracturing Technologies for Deep and Ultra-deep Fractured Tight Sandstone Gas Reservoirs: A Case Study of Dabei and Keshen Gas Reservoirs in the Tarim Basin [J]. Nat. Gas. Ind. 038 (008), 63–68.
Chen, J. (2019). The Accumulation of Natural Gas and Potential Exploration Regions in the Southern Margin of the Junggar Basin[J]. Acta Geol. Sin. 93 (5), 1002–1019.
Cipolla, C. L., Lolon, E., Mayerhofer, M. J., and Warpinski, N. R. (2019). Fracture Design Considerations in Horizontal Wells Drilled in Unconventional Gas reservoirs[C]. SPE119366.
Du, Z., Wu, Z., Li, X., Yang, X., and Guo, X. (2020). Condensate Analysis and Precipitation Mechanism Research in Production Pipe Column in GT 1 Well in the Southern Margin of Jungger Basin[J]. Liaoning Chem. Ind. 49 (02), 173–175.
Feng, J., Gao, Z., Cui, J., and Zhou, C. (2016). The Exploration Status and Research Advances of Deep and Ultra-deep Clastic Reservoirs[J]. Adv. Earth Sci. 31 (7), 718–736.
Gaoyuanp (2012). New Mathematical Models for Calculating the Proppant Embedment and Fracture Conductivity[J]. SPE155954.
Jiang, T., and Sun, X. (2018). Development of Keshen Ultra-deep and Ultra-high Pressure Gas Reservoirs in the Kuqu Foreland Basin, Tarim Basin: Understanding Points and Technical Countermeasures[J]. Nat. Gas. Ind. 038 (006), 1–9.
Jin, J., Wang, Y., Ren, J., Feng, W., Ma, W., and Li, S. (2019). Genesis of High-Yield Oil and Gas in Well Gaotan-1 and Characteristics of Source Rocks in Sikeshu Sag, Junggar Basin[J]. Xinjiang Pet. Geol. 40 (02), 145–151. doi:10.7657/XJPG20190203
Kindi, A., Shanfari, A. A., Chavez, J. F., Muffaraji, A., and Farsi, S. (2019). “Successful Field Trials on Linear-Gel Fracturing with High-Strength Proppants in Deep Ultra-tight Gas Wells in the Sultanate of Oman[C],” in SPE/AAPG/SEG Asia Pacific Unconventional Resources Technology Conference.
Kuang, J. (1991). The Structural Characteristics and Analysis of Oil and Gas Accumulation in the Southwestern Part of Junggar Basin. Petroleum Explor. Dev. 18 (6), 11–18.
LaFollette, R. F., and Carman, P. S. (2010). “Proppant Diagenesis: Results So Far,” in Presented at the SPE Unconventional Gas Conference, Pittsburgh, Pennsylvania, 23-25 February. SPE-131782-MS. doi:10.2118/131782-ms
Li, Q., Liu, Q., and Zeng, J. (2012). Optimization of Matching Fracturing Technology on High Fracture Pressure Reservoir in Western Sichuan Area[J]. Drill. Prod. Technol. 035 (003), 46–48.
Li, Y., Guo, J., and Zhao, J. (2007). Key and Countermeasure of Fracturing Technique in Ultradeep and Low Permeability Reservoir[J]. Drill. Prod. Technol. 2007 (02), 56–58.
Liu, H., Yi, Z., and Chen, D. (2012). Difficulty Analysis and Countermeasure of Reforming to Xujiahc Gas Reservoir of Deep Formation in Western Sichuan[J]. Well Test. 21 (01), 53-56–77-78.
Mao, X., Cao, Z., Chen, C., Hu, G., Feng, M., and Xian, Y. (2020). A New Thermal Fluid Coupling Temperature Inversion for the Formation Characteristics of High-Yield Wells[J]. Pet. Drill. Tech. 48 (04), 118–123. doi:10.11911/syztjs.2020062
Mi, Q., Yi, X., Luo, P., and Ren, L. (2015). Horizontal Well Staged Fracturing Technology of Tight Sandstone Reservoirs with Super Depth in Tazhong Area[J]. J. Southwest Petroleum Univ. Sci. Technol. Ed. 37 (02), 114–118.
Mittal, A. (2018). Experimental Investigation of Propped Fracture Conductivity. Master's Thesis. Norman, Oklahoma: The University of Oklahoma.
Ogier, K. S., Haddad, Z. A., Moreira, O. M. M., de Moraes, F. D., and Shipley, J. (2011). “The World's Deepest Frac-Pack Completions Utilizing a Single-Trip, Multi-Zone System: a Gulf of Mexico Case Study in the Lower Tertiary Formation[C],” in SPE Annual Technical Conference and Exhibition. Society of Petroleum Engineers.
Raysoni, N., and Weaver, J. (2013). Long-term Hydrothermal Proppant Performance. SPE Prod. Oper. 28 (4), 414–426. doi:10.2118/150669-pa
Tang, Y., Ranjinth, P. G., Perera, M., and Rathnaweera, T. D. (2018). Influences of Proppant Concentration and Fracturing Fluids on Proppant-Embedment Behavior for Inhomogeneous Rock Medium: An Experimental and Numerical Study[J]. SPE Prod. Operations.
Wang, J., Huang, Y., Zhou, F., and Liang, X. (2020). The Influence of Proppant Breakage, Embedding, and Particle Migration on Fracture Conductivity. J. Petroleum Sci. Eng. 193, 107385. doi:10.1016/j.petrol.2020.107385
Wang, X., Zhi, D., Wang, Y., Chen, J., Qin, Z., Liu, D., et al. (2013). Source Rocks and Hydrocarbon Geochemistry in Junggar Basin[M]. Beijing: Petroleum Industry Press.
Zhi, D. (2018). Typical Oil and Gas Reservoirs in Junggar Basin (South Margin)[M]. Beijing: Petroleum Industry Press.
Keywords: ultra-deep, high temperature and high pressure, size combination, proppant selection, Junggar Basin
Citation: Wu B, Xiao F, Kong M, Wang B and Zhang S (2022) Research on Proppant Optimization and Field Test of Ultra-Deep Tight Conglomerate Sandstone Reservoir. Front. Energy Res. 10:891063. doi: 10.3389/fenrg.2022.891063
Received: 07 March 2022; Accepted: 19 April 2022;
Published: 30 May 2022.
Edited by:
Xun Zhong, Yangtze University, ChinaReviewed by:
Hu Guo, China University of Petroleum, ChinaYunfeng Xu, Yangtze University, China
Hun Lin, Chongqing University of Science and Technology, China
Copyright © 2022 Wu, Xiao, Kong, Wang and Zhang. This is an open-access article distributed under the terms of the Creative Commons Attribution License (CC BY). The use, distribution or reproduction in other forums is permitted, provided the original author(s) and the copyright owner(s) are credited and that the original publication in this journal is cited, in accordance with accepted academic practice. No use, distribution or reproduction is permitted which does not comply with these terms.
*Correspondence: Fengchao Xiao, MTk0NTMyNTU0OUBxcS5jb20=; Shicheng Zhang, MTM2OTE1NTU2NjlAMTYzLmNvbQ==