 Chen Dai
 Xiang Qin
- School of Mechanical and Power Engineering, Zhengzhou University, Zhengzhou, China
As a natural refrigerant, CO2 can greatly improve the environmental protection of the heat pump system. Since there is no perfectly suitable heat transfer correlation for supercritical CO2 at present, the water outlet temperature of the transcritical CO2 heat pump system has not been predicted. To study the applications of transcritical CO2 heat pump systems in heating performance and hot water supply, a series of experiments are carried out by an air source transcritical CO2 heat pump test rig. The experimental results show that the main factors affecting outlet water temperature are the system COP, the discharge pressure, the compressor frequency, and the ambient temperature. Based on the experimental results, a dimensionless correlation equation on outlet water temperature is proposed by the Buckingham PI theorem. This equation can be used to calculate the outlet water temperature of the air source transcritical CO2 heat pump systems with different sizes, and the calculation accuracy can be maintained at 13% with experimental results. Finally, the influence factors of the gas cooler water outlet temperature are analyzed based on the novel calculation method. Therefore, this study provides a reference for the prediction of the water outlet temperature of the transcritical CO2 heat pump system.
1 Introduction
After human society entered the industrial age, the global temperature has increased by almost 1°C due to human activities. If the global temperature continues to rise at the current rate, the increment of the global temperature will probably reach 1.5°C between 2030 and 2052. The Intergovernmental Panel on Climate Change in the special report emphasizes that if the global temperature increases by another 0.5°C, it will cause disastrous consequences, which are beyond the scope of scientific expectations (IPCC, 2018).
An important reason for atmospheric damage and global warming is that chlorofluorocarbon (CFC) and hydrochlorofluorocarbon (HCFC) refrigerants are abused (Abas et al., 2018), so these refrigerants have been limited to being used in the world. As a natural refrigerant, carbon dioxide (CO2) is different from other refrigerants due to its excellent environmental protection. CO2 can be recycled from other industrial processes, which will reduce the CO2 emission to the environment (Santosa et al., 2017). In addition, CO2 has no ozone depression potential (ODP) and the effect of CO2 on the global warming potential (GWP) is very low (only 1) (Cicokov, 2018).
Compared with other natural refrigerants, CO2 has many unique physical properties. First, CO2 is non-flammable, non-toxic, and non-corrosive (Zhang et al., 2019). In addition, there is no carcinogenicity of CO2 and no dangerous products after combustion in the current knowledge, so the safety of CO2 is the basis of its development. The critical temperature of CO2 is only 31.1°C (Domanski et al., 2017), which is similar to the ambient temperature, so it is beneficial for the direct conversion of CO2 at both subcritical and supercritical levels. Also CO2 has acceptable fluidity and thermal conductivity, because the viscosity is close to gas and the density is close to liquid in the supercritical state. In addition, there is no phase change in the exothermic process of CO2, so the temperature slip of the refrigerant and the water can better match and produce hot water at higher temperatures. However, due to the extensively high critical pressure of CO2 (about 7370 kPa), the safety of transcritical CO2 equipment will be focused on. With the improvement in manufacturing technology, the safety issues of this equipment will be solved (Wang et al., 2019).
As a traditional refrigerant, the use of CO2 is over 100 years. In the 1860s, CO2 had been investigated as a refrigerant (Ma et al., 2013). CO2 was applied to the food refrigeration system in the ship and the air-conditioner of the crew in the 1890s (Austin and Sumathy, 2011), and CO2 soon became the preferred refrigerant. In the early 20th century, over 100 tons of food were transported to Britain, North America, and other regions by the ship CO2 refrigeration system every year (Yang et al., 2019). However, CO2 had been gradually replaced with the development of R22. In the 1960s, R22 almost replaced all refrigerants which are used on the sea and land. In the 1970s, many governments realized that CFCs and HCFCs can damage the ozone layer and thereafter formulated a schedule for eliminating CFCs and HCFCs (George and Briley, 2004). In recent years, CO2 has been ranked as one of the most potential refrigerants in the 21st century due to its unique environmental protection (Fartaj et al., 2004).
Lorentzen (Lorentzen and Pettersen, 1993) first proposed the application of the transcritical CO2 cycle systems in automotive air conditioning at the end of the 20th century. In recent years, many researchers have conducted theoretical and experimental studies on the optimal discharge pressure in a transcritical CO2 cycle system. Kauf et al. (1999) studied the COP of the transcritical CO2 refrigeration cycle under the ambient temperature of 35–50°C by simulation and fitted the correlation of optimal discharge pressure. Ge and Tassou, 2009) numerically investigated the medium-temperature food retailing refrigeration system and believed that the optimal discharge pressure is mainly determined by the ambient temperature. Aprea and Maiorino, 2009) studied the optimal operating conditions, using numerical and experimental methods, under different ambient temperatures and discharge pressures in the two-stage compressed transcritical CO2 air conditioning system. Also the optimal discharge pressure correlation of Liao et al. (2000) was optimized. (Wang et al. (2013) showed the changes in the system COP, the CO2 outlet temperature of the gas cooler, and the evaporation temperature with the increasing the ambient temperatures in the air source transcritical CO2 heat pump system and obtained the optimal discharge pressure correlation. Qi et al. (2013) further studied the transcritical CO2 heat pump system performance under different ambient temperatures and the water inlet temperature of the gas cooler. They obtained the optimal discharge pressure correlation about the CO2 outlet temperature of the gas cooler. Liu et al. (2017) developed a water source transcritical CO2 heat pump system. They found that the increment of the water source temperature of the evaporator can improve the system heating capacity, the gas cooler water outlet temperature (GCW), and the system COP.
Because the end product of the transcritical CO2 heat pump system is hot water, it is necessary to keep high system performance under the premise of meeting the GCW. Wang W. et al. (2021) presented a control strategy of air source transcritical CO2 heat pump water heater based on the model predictive control and simulation verified the operation system performance of this control strategy at the GCW from 60 to 80°C. Qin et al. (2021) proposed a performance evaluation for internal heat exchangers and studied the effect of the internal heat exchanger on GCW. Cui et al. (Qi et al., 2022) studied the effect of evaporating temperature and pinch point temperature on GCW based on the method for seeking the optimal discharge pressure and found that the GCW can be controlled at 95°C under the optimal discharge pressure. Chen et al. (2022) proposed a novel direct-expansion solar-assisted flash tank vapor injection heat pump for water heaters, which can effectively improve the system COP and the GCW. Qin et al. (2022) showed a new discharge pressure deviation calculation method, which can achieve the COP of 4.39, while maintaining the high GCW. Wang Y. et al. (2021) experimental studied a transcritical CO2 heat pump water heater with fin-and-tube and microchannel heat exchanger, and it can be found that the payback period of this system is only 0.616 years under the satisfy demand of GCW. Qin et al. (2019); Qin et al. (2020) concluded that the heating capacity is the main factor to determine the GCW. The GCW has a peak value in the variation range of the discharge pressure, but the GCW peak values of different compressor frequencies are corresponding to different discharge pressures. Therefore, the effects of compressor frequency should be considered during the choice of the GCW, but further study on the relationship between compressor frequency and the GCW is not conducted. Yang et al. (2019) proposed the concept of UTC to evaluate the relation between the increment of the GCW and the system COP, but the specific control method of GCW and variables is not put forward.
Based on the above discussions, it can be concluded that the analysis and prediction of the GCW are necessary. In this study, the system performance changes with operating variables are analyzed first, and then the main operating conditions that affect the GCW are proposed. After that, a dimensionless correlation of the GCW is derived by experimental results and the Buckingham PI method, and the GCW can be predicted by this correlation under other operating conditions. The correlation of predicting GCW can provide a basis for system design.
2 Experimental Equipment and Processes
2.1 Experimental Equipment
The main equipment of the transcritical CO2 heat pump system includes a compressor, gas cooler, internal heat exchanger, expansion device, and evaporator. To meet the frequency conversion requirements of the compressor, a high-performance open-loop vector converter from an inverter is used. The specific parameters of the apparatuses are shown inTable 1. The accuracy of the measurement devices is listed inTable 2. The experiment flow chart and the experimental facilities are shown in Figure 1 and Figure 2, respectively.
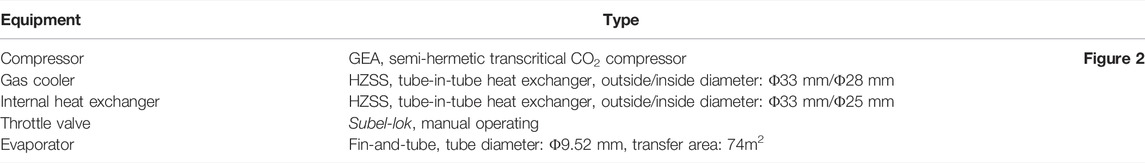
TABLE 1. Specific parameters of the apparatus.
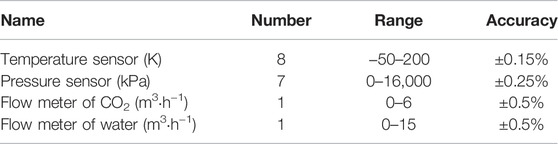
TABLE 2. Measurement devices.
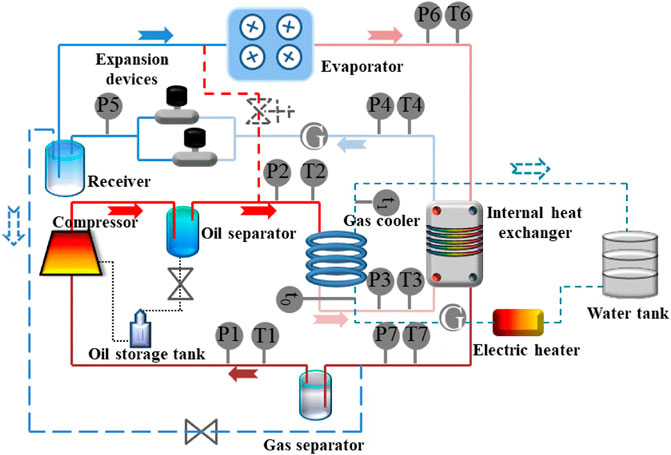
FIGURE 1. Schematics of a transcritical CO2 heat pump system.
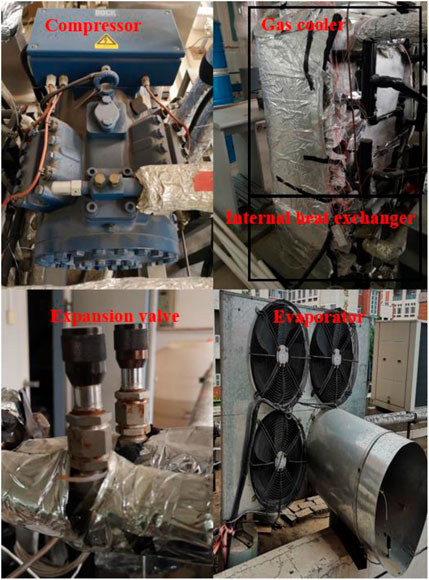
FIGURE 2. Experimental facilities.
2.2 System Operation Principle
Figure 3 presents the theoretical pressure-enthalpy diagram of the transcritical CO2 heat pump system. It can be seen from the figure that 1–2 is the compression process of CO2 in the compressor, and CO2 changes from the subcritical state to the supercritical state; 2–3 is the isobaric exothermic process of CO2 in the gas cooler, and water is heated; 3–4 is the re-exothermic process in the high-pressure side of the internal heat exchanger with constant pressure; 4–5 is the isoenthalpic expansion process in the expansion valve; 5–6 is the isobaric endothermic process in the evaporator, and the air is cooled; 6–1 is the re-endothermic process in the low-pressure side of the internal heat exchanger with constant pressure.

FIGURE 3. Pressure-enthalpy diagram of transcritical CO2 heat pump system.
2.3 Actual Operating Condition
The actual operating conditions can be controlled by the compressor frequency, the discharge pressure, and the ambient temperature. The compressor frequency is controlled by the frequency converter in the range of 20–40Hz. Through two parallel expansion devices, the discharge pressure adjustment is within 7000–11600kPa. The discharge pressure 7310kPa is the minimum pressure for the CO2 supercritical condition, and the discharge pressure 11600kPa is the top limit for system safety. Since the evaporator is installed outdoor, the experiments are carried out in different periods to meet the requirement of ambient temperature. The experiment is performed in November and December when the ambient temperature is 15±1°C; the experiment is performed in September when the ambient temperature is 30±1°C. In addition, the inlet water is at a temperature of 15°C and a flow rate of 0.5 m3/h. According to the test, the range of the outlet water temperature is 45–90°C when the ambient temperature is 15°C; the range of the outlet water temperature is 55–100°C when the ambient temperature is 30°C. The specific operating conditions are shown inTable 3.
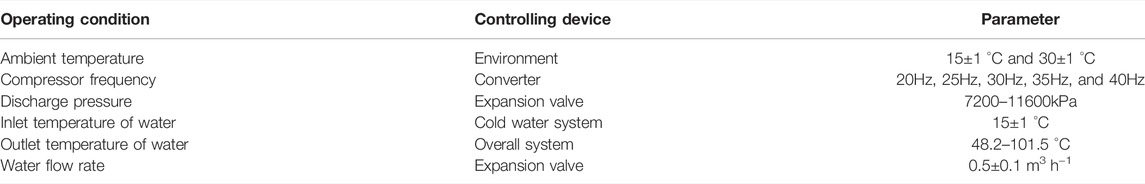
TABLE 3. Specific operating condition.
2.4 Calculation Method
Theoretical system COPth is defined as Eq. 1:
It also could be calculated with:
The heating capacity of water
The compressor work (
The physical parameters of CO2 are calculated using REFPROP.
According to the method proposed by Kline and McClintock (Kline, 1953), the uncertainty of the experimental results is calculated in this study. The calculation process of summing the square of errors is as follows:
Based on the accuracy of the measuring device and the experimental data, the maximum uncertainty of COP is 5.3487%.
3 Experimental Result of System Performance
3.1 Heating Coefficient of Performance (-) and the Maximum COP Under Different Compressor Frequencies
It can be seen from Figure 4 that the changing trends of COP are almost the same under the same ambient temperature and different compressor frequencies. All changing trends first rise rapidly and then decrease after reaching the peak value. The downward trend of COP gradually flattens with increase in the compressor frequency. The peak values of the COP move in the direction of the increase in discharge pressure with the increase of the ambient temperature. It is worth noting that, the peak value of the COP at the ambient temperature of 15°C is larger than that at the ambient temperature of 30°C except for 20 and 35Hz. The specific data of maximum COP is listed in Table 4.
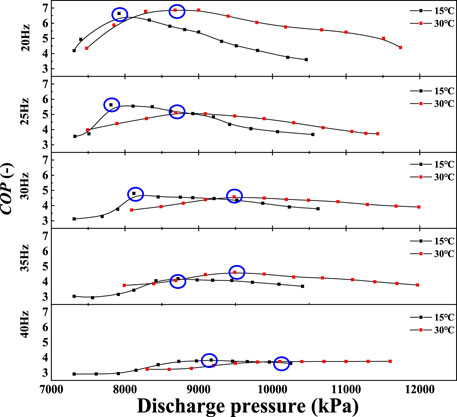
FIGURE 4. COP at different compressor frequencies and ambient temperatures.
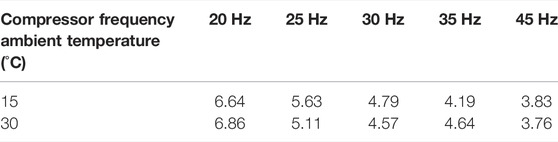
TABLE 4. Maximum COP for different compressor frequencies and ambient temperatures.
According to Eq. 2, the COPth is the ratio of the enthalpy difference between the gas cooler and the compressor.
To analyze the reason for the change of the system COP, the enthalpy difference variation trend of the compressor and the gas cooler at the compressor frequency of 20Hz is proposed.
It can be seen from Figure 5 that although the increase of compressor enthalpy difference is flat, however, the increase of gas cooler enthalpy difference is obvious when the discharge pressure is less than 7920kPa for an ambient temperature of 15°C. And this inflection point is 8680kPa for an ambient temperature of 30°C. The ratio of the enthalpy difference between the gas cooler and the compressor is the system COPth by Eq. 2, so the inflection points of the enthalpy difference ratio can reflect the variation trend of the system COP. Therefore, the reason for the variation trend of the gas cooler enthalpy difference can be analyzed to obtain the reason for the change of the system COP.

FIGURE 5. Enthalpy difference of gas cooler and compressor when the compressor frequency is 20 Hz.
Figure 6 shows the inlet and outlet enthalpy of the gas cooler under different compressor discharge pressure. It can be seen from the figure that the inlet enthalpy of the gas cooler has a little change as the discharge pressure increases. Whereas, the outlet enthalpy of the gas cooler decreases significantly as the discharge pressure increases before it reaches the inflection point, which is 7920kPa for ambient temperature of 15°C and 8680kPa for ambient temperature of 30°C. So, the rapid decline of the gas cooler outlet enthalpy is the reason for the rapid increase in system COP.
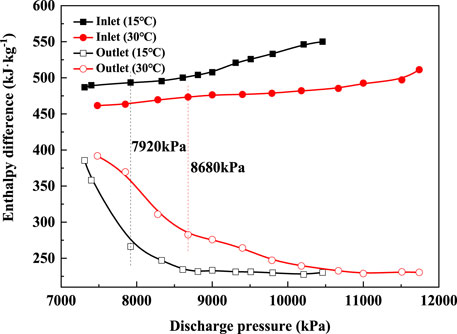
FIGURE 6. Enthalpy variation of the gas cooler inlet and outlet at the compressor frequency of 20 Hz.
Drawing the variation trend of the gas cooler outlet enthalpy in the P-h diagram. The conclusions can be extracted from Figure 7 that the gas cooler outlet temperature begins to drop as the discharge pressure increases. The gas cooler outlet temperature was maintained near 15 °C due to the influence of convective heat transfer and the inlet water temperature (15°C), so the variation trend of the gas cooler outlet temperature in the second half matches the variation trend of the 15°C-isothermal line. The inflection points of the ambient temperature of 15 and 30°C are 7920 and 8680kPa, respectively, so these discharge pressures are chosen as the demarcation point in the P-h diagram. Since the isotherm is above the critical point of CO2 (7310kPa, 31.1°C) is almost horizontal and the CO2 outlet temperature of the gas cooler drops slowly, it is almost the same as the isotherm variation trend. The change in the CO2 outlet temperature and the isotherm of the gas cooler lead to a rapid drop in the enthalpy of the CO2 gas cooler. As the discharge pressure increases, the temperature of the gas cooler outlet rapidly decreases, and the enthalpy value of the gas cooler outlet rapidly increased after the demarcation point. The change in the increased rate of the gas cooler outlet enthalpy is the main reason for the change in the system COP.
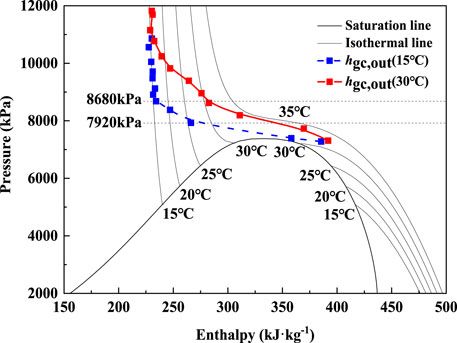
FIGURE 7. Variation trend of the gas cooler outlet enthalpy in the P-h diagram.
3.2 Heating Capacity and Outlet Water Temperatures
The heating capacity of water can be calculated by Eq. 3, and the water temperature difference of the gas cooler can be calculated by Eq. 4 Because the fluctuation of the
As shown in Figures 8A,B, the GCW, and the heating capacity have a similar variation trend. It can be seen that the GCW and the heating capacity, at other compressor frequencies except 40Hz, all increase to a peak value and then decrease with increasing pressure discharge. The heating capacity increases about 34.8%, 41.3%, 38.1%, and 47.3%, respectively, while the GCW increases about 15.3%, 19.5%, 28.3%, and 34.8%, respectively, when the ambient temperature is 15°C. In addition, the heating capacity increases about 47.5%, 58.7%, 49.1%, and 50.2%, respectively, while the GCW increases 39.1%, 37.9%, 35.2%, and 50.5%, respectively, when the ambient temperature is 30°C. Therefore, it can be concluded that the GCW is mainly affected by the heating capacity.
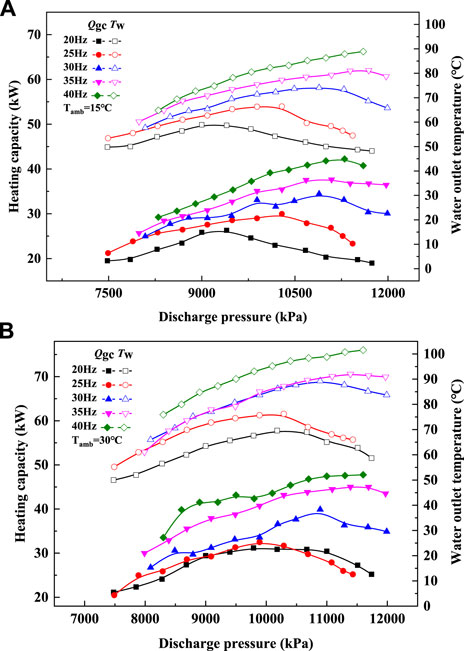
FIGURE 8. Corresponding heating capacity and the GCW under different discharge pressures. (A) Ambient temperature of 15°C. (B) Ambient temperature of 30°C.
It is worth noting that all parameters of 40Hz, except the heating capacity of 15°C, continue to rise within the experimental range, and there is no downward trend. The peak values of heating capacity and GCW with the discharge pressure at 15 and 30°C for all frequencies are shown in Figure 9. It can be seen from the figure that the corresponding discharge pressure increase with the compressor frequency, whether it is the heating capacity or the GCW. Hence, it can be inferred that the discharge pressure corresponding to the maximum heating capacity and GCW of 40Hz will be greater than that of 35Hz. However, the system will automatically stop when the discharge pressure rises to 11600kPa because this system has high-pressure protection. Therefore, the GCW (15 and 30°C) and the heating capacity (30°C) of 40Hz do not show the peak value within the experimental range.
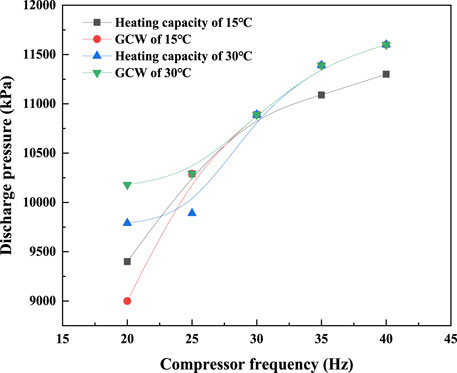
FIGURE 9. Discharge pressure corresponding to the maximum heating capacity and GCW with the increase in compressor frequency.
4 Calculation Method and Validation of Water Outlet Temperature of Gas Cooler (°C)
The different maximum GCWs can be obtained at different compressor frequencies, and the corresponding system COPs are different, too. Based on the discussion of maximum COP (Section 3.1), the lower the compressor frequency, the higher the system COP will be. Hence, it can get the highest system COP by selecting the appropriate compressor frequency under the conditions to meet the hot water temperature demand, so it is essential to predict the GCW. Through the Buckingham PI analysis method, a new dimensionless correlation of the GCW can be proposed, which can guide the system to operate under optimal conditions and meet the needs of GCW.
First, the variables used in the dimensionless correlation need to be analyzed. These variables, that affect the GCW in the transcritical CO2 heat pump system, are the water inlet temperature, the mass flow rate of water, the tube length of the gas cooler, the CO2 inlet temperature of the gas cooler, the speed of the compressor, the suction pressure of the compressor, and the discharge pressure of the compressor, respectively.
Second, based on theoretical analysis, the abovementioned variables are divided into fundamental variables and the main variables. Among them, the fundamental variables include the water inlet temperature (
Then, by analyzing the fundamental variables and the main variables, four dimensionless parameters PI groups are generated. These dimensionless parameters PI groups and their definition are shown inTable 5.
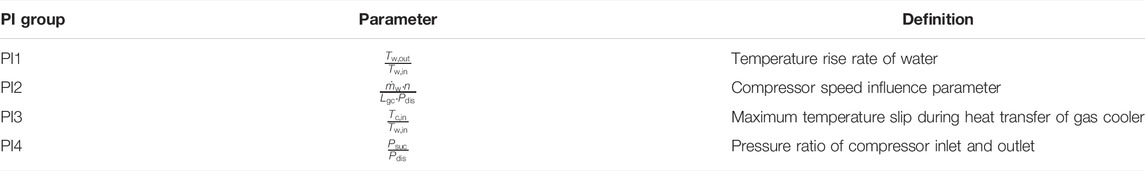
TABLE 5. Specific parameters of PI groups.
Suppose there is a relationship of the power index polynomial among the dimensionless parameters PI groups, as shown in Eq. 10. And through experimental data, every coefficient of Eq. 10 can be calculated. The specific results as shown in Eq. 11.
The absolute error between the calculation results of PI1 and the experimental results of PI1 are shown in Figure 10. Since the maximum absolute error reaches about 2.00, the maximum difference temperature between the calculation results of GCW and the experimental results of GCW is greater than 10°C. It cannot meet the predictable accuracy of GCW, so the problem of prediction accuracy can be solved by adding the correction factors to the prediction equation.
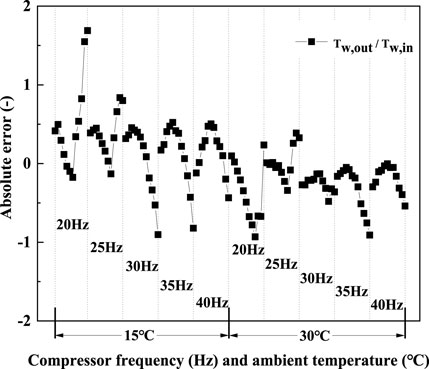
FIGURE 10. Absolute error of PI1.
Based on the absolute error of PI1, the equation of the correction factor is fitted by PI2 and PI4. The specific results are shown in Eq. 12.
The equation of the correction factor is added in the original prediction equation, and the GCW is calculated by the new prediction equation. Figure 11 shows the comparison of GCW between the experimental results and predicted results.
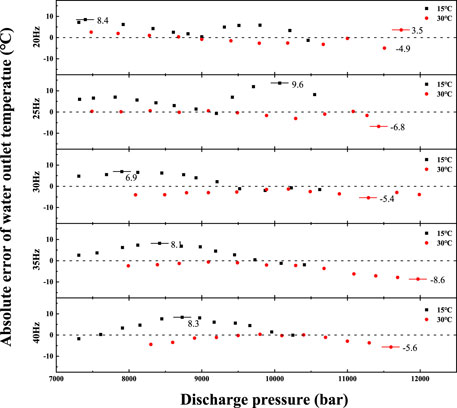
FIGURE 11. Relative error of GCW.
The calculated value of GCW at the ambient temperature of 15°C is slightly higher than the experimental results, but the calculated value of GCW when the ambient temperature is 30°C is lower than the experimental results. In light of this situation, the effect of the ambient temperature should be considered. After the equation of the correction factor about the ambient temperature (Eq. 13) is added, the relative error between the newly calculated results and the experimental results is within ±13%. The specific results are shown in Figure 12.
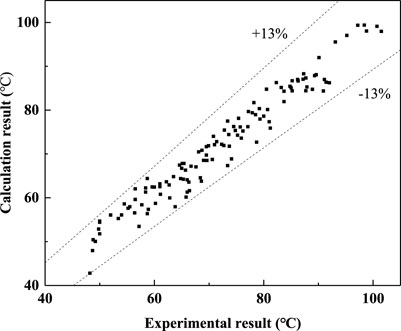
FIGURE 12. Comparison of the experimental GCWs with those predicted.
The final dimensionless correlation of GCW is shown in Eq.14.
5 Influence Analysis of Water Outlet Temperature of Gas Cooler (°C)
5.1 Effect of Different Ambient Temperatures on Water Outlet Temperature of Gas Cooler (°C)
The GCW at different ambient temperatures can be calculated by Eq. 14. The input dynamic parameters of different ambient temperature are shown inTable 6. The input fixed parameters are
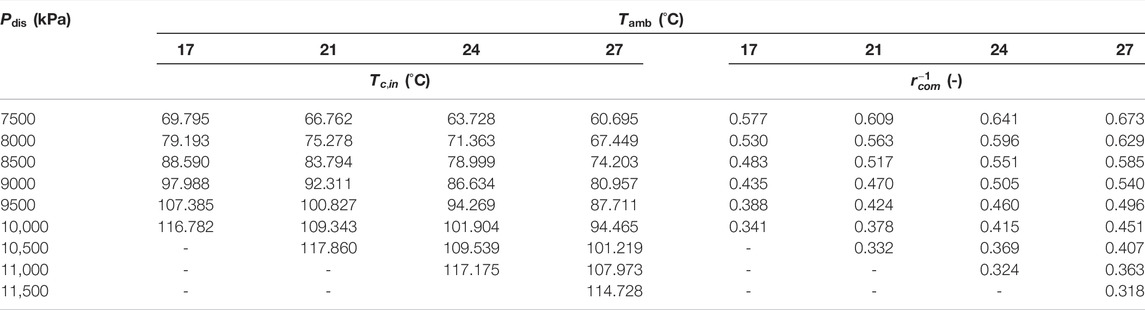
TABLE 6. Input variable parameters at compressor frequency of 20Hz.
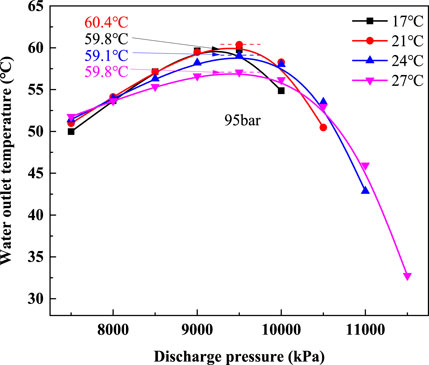
FIGURE 13. Changes of GCW with discharge pressure at different ambient temperatures and the compressor frequency of 20 Hz.
It can be seen from Figure 13 that the maximum GCWs for all ambient temperatures occur at the discharge pressure of about 9800kPa. Although increasing ambient temperature can result in a slightly increased system COP, it does not mean that the GCW increases with ambient temperature. For example, the maximum GCW is 60.4°C in this figure and occurs at the ambient temperature of 21°C. The other main variation trend is that the decreasing rates of GCW decrease as the ambient temperature increases. After the discharge pressure increases to 10500kPa, the GCW at an ambient temperature of 27°C is higher than that of the other ambient temperatures in the same discharge pressure.
5.2 Effect of Different Compressor Frequencies on Water Outlet Temperature of Gas Cooler (°C)
At an ambient temperature of 20°C, the GCWs of different compressor frequencies can be calculated by Eq. 14 to determine the effect of compressor frequency on GCW and the accuracy of the prediction model. The input variable parameters of the CO2 inlet temperature and compressor pressure ratio at the ambient temperature of 20°C and different compressor frequencies are shown inTable 7. The input fixed parameters maintain unchanged. The calculation results of GCW are shown in Figure 14.
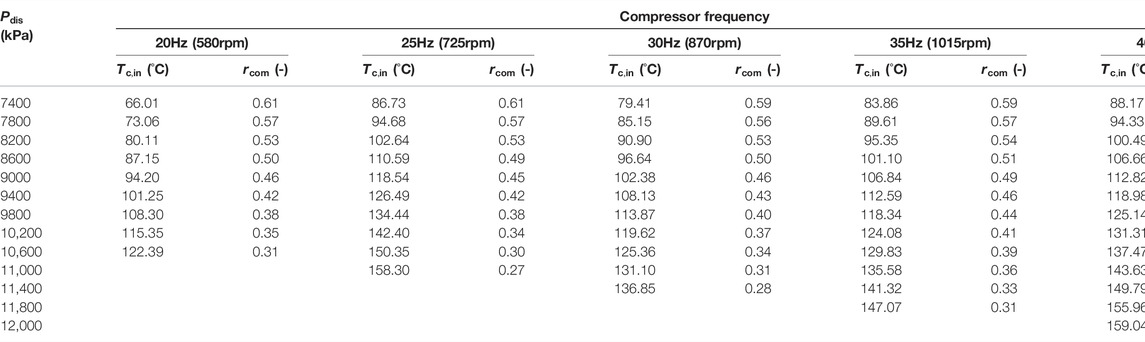
TABLE 7. Input variable parameters at ambient temperature of 20°C.
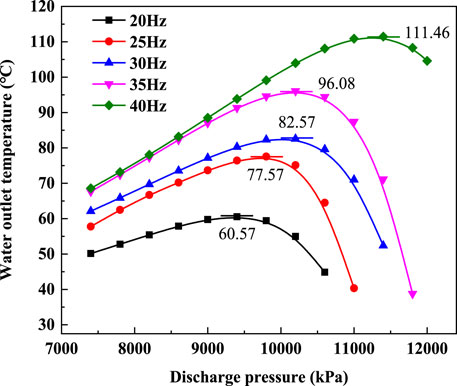
FIGURE 14. Changes of GCW with discharge pressure at different compressor frequencies and ambient temperature of 20°C.
It can be seen from Figure 14 that the GCW variation trends of different discharge pressures at an ambient temperature of 20°C are almost the same as the experimental results at ambient temperatures of 15 and 30°C. These three sets of GCWs at different ambient temperatures rise first and then decrease with the increase of compressor frequency. In addition, the peak points of GCW shift in the direction of the high discharge pressure with an increase in the compressor frequency. Compared to Figure 15, the curve at an ambient temperature of 20°C is smoother than the curves at ambient temperatures of 10 and 30°C, because the curve at the ambient temperature of 20°C is generated by the calculated results. The maximum GCWs and the discharge pressures corresponding to three ambient temperatures at different compressor frequencies are shown in Figure 15.
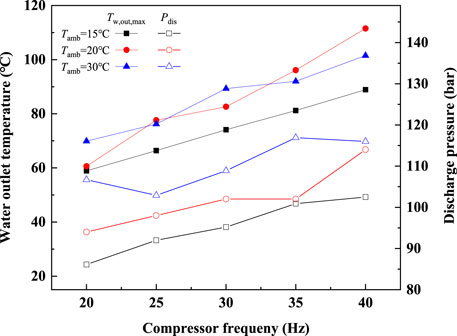
FIGURE 15. Maximum GCW and the corresponding discharge pressure at different compressor frequencies and ambient temperatures.
The figure shows that at the same compressor frequency, the increase in the ambient temperature does not mean that the GCW is improved. When the compressor frequencies are 25Hz, 35Hz, and 40Hz, the GCWs at an ambient temperature of 20°C are all higher than that at the ambient temperature of 30°C. This result is the same as the result discussed above. But the variation trends of the discharge pressure at the maximum GCW display some regularity. Regardless of the compressor frequency, the discharge pressure at the maximum GCW increases as the ambient temperature increases. Based on the abovementioned conclusion, it can be determined that the ambient temperature is not the main factor affecting the GCW.
5.3 System COP of the Same Water Outlet Temperature of Gas Cooler (°C) at Different Compressor Frequencies
The system COP of the ambient temperature of 20°C at different compressor frequencies can be calculated by the correlations, which are presented by Qin et al. (Wang W. et al., 2021). The calculation process of the system COP and
At first, the CO2 mass flow rate can be calculated by the volumetric efficiency. And then, the rate of work done on the refrigerant can be calculated by the isentropic efficiency. In addition, the rate of work into the compressor can be calculated by mechanical efficiency. At last, the system COP corresponds to the same GCW at different compressor frequencies and the ambient temperature of 20°C can be obtained. The specific calculation results as shown in Figure 16.
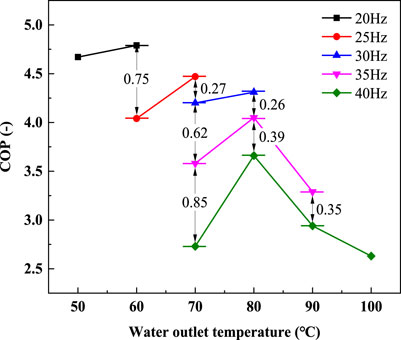
FIGURE 16. GCW and the corresponding COP at different compressor frequencies.
The figure shows the system COP at the same GCW decreases as increase of compressor frequency. The system COP of 40Hz decreases most significantly, and the maximum decrease value reaches 0.85. As illustrated in Figure 13, the variation range of the GCW is extended by increasing the compressor frequency. For example, the variation range of 20Hz is from 44.87 to 60.57°C, but the variation range of 40Hz is extended to 111.46°C from 68.59°C. Based on the abovementioned discussion, it can be concluded that when all compressor frequencies can meet the requirements of GCW at the same ambient temperature and water inlet condition, a lower compressor frequency is a better choice for the system operation.
6 Conclusion
In this study, the system performance and the GCW of the transcritical CO2 heat pump system are studied. Some main conclusions obtained from the experimental results and theoretical analysis are summarized as follows:
It is concluded that the main reason for the peaks in system COP is the enthalpy variation trend of the gas cooler CO2 outlet through experimental results and theoretical analysis. Since the inlet water temperature is fixed, the gas cooler CO2 outlet temperature is close to the inlet water temperature. This leads to a slight change in the gas cooler outlet CO2 enthalpy, which is also the main cause for the high system COP in the experiment.
According to the experimental results and dimensionless analysis, a novel calculation method of the GCW is proposed. After correcting the maximum temperature slip, the pressure ratio, and the ambient temperature, the final calculation correlation for GCW is obtained. It is concluded that the relative error of the GCW predicted results is within ±13% to compare the experimental results at different ambient temperatures.
It is found that the effect of compressor frequency on GCW is greater than that of ambient temperature.
Data Availability Statement
The original contributions presented in the study are included in the article/Supplementary Material, further inquiries can be directed to the corresponding author.
Author Contributions
CD: conceptualization, writing—original. XQ: supervision, validation, and project administration.
Funding
This research is supported by the Key Science Research Project of University in Henan (Grants No. 22A470008).
Conflict of Interest
The authors declare that the research was conducted in the absence of any commercial or financial relationships that could be construed as a potential conflict of interest.
Publisher’s Note
All claims expressed in this article are solely those of the authors and do not necessarily represent those of their affiliated organizations, or those of the publisher, the editors, and the reviewers. Any product that may be evaluated in this article, or claim that may be made by its manufacturer, is not guaranteed or endorsed by the publisher.
References
Abas, N., Kalair, A. R., Khan, N., Haider, A., Saleem, Z., and Saleem, M. S. (2018). Natural and Synthetic Refrigerants, Global Warming: A Review. Renew. Sustainable Energ. Rev. 90, 557–569. doi:10.1016/j.rser.2018.03.099
Aprea, C., and Maiorino, A. (2009). Heat Rejection Pressure Optimization for a Carbon Dioxide Split System: An Experimental Study. Appl. Energ. 86, 2373–2380. doi:10.1016/j.apenergy.2009.03.006
Austin, B., and Sumathy, K. (2011). Transcritical Carbon Dioxide Heat Pump Systems: A Review. Renew. Sustainable Energ. Rev. 15, 4013–4029. doi:10.1016/j.rser.2011.07.021
Chen, J., Zhang, Z., Zhang, G., and Wang, D. (2022). Energy, Exergy, Economic and Environmental Analysis of a Novel Direct-Expansion Solar-Assisted Flash Tank Vapor Injection Heat Pump for Water Heater. Energ. Convers. Management 254, 115239. doi:10.1016/j.enconman.2022.115239
Cicokov, R. (2018). Refrigerants: There Is Still No Vision for Sustainable Solutions. Int. J. Refrigeration 86, 441–448. doi:10.1016/j.ijrefrig.2017.12.006
Domanski, P. A., Brignoli, R., Brown, J. S., Kazakov, A. F., and McLinden, M. O. (2017). Low-GWP Refrigerants for Medium and High-Pressure Applications. Int. J. Refrigeration 84, 198–209. doi:10.1016/j.ijrefrig.2017.08.019
Fartaj, A., Ting, D., and Yang, W. (2004). Second Law Analysis of the Transcritical CO2, Refrigeration Cycle. Energ. Convers. Management 13, 2269–2281. doi:10.1016/j.enconman.2003.07.001
Ge, Y., and Tassou, S. (2009). Control Optimization of CO2 Cycles for Medium Temperature Retail Food Refrigeration Systems. Int. J. Refrigeration 32, 1376–1388. doi:10.1016/j.ijrefrig.2009.01.004
George, C., and Briley, P. (2004). A History of Refrigeration. ASHRAE J., S31–S34. doi:10.1002/tal.256
Kauf, F. (1999). Determination of the Optimum High Pressure for Transcritical CO2 Refrigeration Cycles. Int. J. Therm. Sci. 38, 325–330. doi:10.1016/s1290-0729(99)80098-2
Kline, S. (1953). Describing Uncertainties in Single-Sample experiment. Mech. Eng. 75 (1), 3–17. doi:10.1016/0894-1777(88)90043-X
Liao, S., Zhao, T., and Jakobsen, A. (2000). A Correlation of Optimal Heat Rejection Pressures in Transcritical Carbon Dioxide Cycles. Appl. Therm. Eng. 20, 831–841. doi:10.1016/s1359-4311(99)00070-8
Liu, X., Liu, C., Zhang, Z., Chen, L., and Hou, Y. (2017). Experimental Study on the Performance of Water Source Trans-critical CO2 Heat Pump Water Heater. Energies 10, 810. doi:10.3390/en10060810
Lorentzen, G., and Pettersen, J. (1993). A New Efficient and Environmentally Benign System for Car Air-Conditioning. Int. J. Refrigeration 6, 4–12. doi:10.1016/0140-7007(93)90014-y
Ma, Y., Liu, Z., and Tian, H. (2013). A Review of Transcritical Carbon Dioxide Heat Pump and Refrigeration Cycles. Energy 55, 156–172. doi:10.1016/j.energy.2013.03.030
Qi, C., Wang, C., Gao, E., and Zhang, X. (2022). Pinch point Characteristics and Performance Evaluation of CO2 Heat Pump Water Heater under Variable Working Conditions. Appl. Therm. Eng. 2022 (207), 118208. doi:10.1016/j.applthermaleng.2022.118208
Qi, P., He, Y., Wang, X., and Meng, X.-Z. (2013). Experimental Investigation of the Optimal Heat Rejection Pressure for a Transcritical CO2 Heat Pump Water Heater. Appl. Therm. Eng. 56, 120–125. doi:10.1016/j.applthermaleng.2013.03.045
Qin, X., Liu, H., Meng, X., Wei, X., Zhao, L., and Yang, L. (2019). A Study on the Compressor Frequency and Optimal Discharge Pressure of the Transcritical CO2 Heat Pump System. Int. J. Refrigeration 99, 101–113. doi:10.1016/j.ijrefrig.2018.12.028
Qin, X., Wang, D., Jin, Z., Wang, J., Zhang, G., and Li, H. (2021). A Comprehensive Investigation on the Effect of Internal Heat Exchanger Based on a Novel Evaluation Method in the Transcritical CO2 Heat Pump System. Renew. Energ. 178, 574–586. doi:10.1016/j.renene.2021.06.082
Qin, X., Zhang, D., Zhang, F., Gao, Z., and Wei, X. (2020). Experimental and Numerical Study on Heat Transfer of Gas Cooler under the Optimal Discharge Pressure. Int. J. Refrigeration 112, 229–239. doi:10.1016/j.ijrefrig.2019.12.026
Qin, X., Zhang, F., Zhang, D., Gao, Z., and Tang, S. (2022). Experimental and Theoretical Analysis of the Optimal High Pressure and Peak Performance Coefficient in Transcritical CO2 Heat Pump. Appl. Therm. Eng. 210, 118372. doi:10.1016/j.applthermaleng.2022.118372
Santosa, I. M. C., Gowreesunker, B. L., Tassou, S. A., Tsamos, K. M., and Ge, Y. (2017). Investigations into Air and Refrigerant Side Heat Transfer Coefficients of Finned-Tube CO2 Gas Coolers. Int. J. Heat Mass Transfer 107, 168–180. doi:10.1016/j.ijheatmasstransfer.2016.11.011
Wang, J., Tang, L., Zhao, L., and Zhang, Z. (2019). Efficiency Investigation on Energy Harvesting from Airflows in HVAC System Based on Galloping of Isosceles triangle Sectioned bluff Bodies. Energy 172, 1066–1078. doi:10.1016/j.energy.2019.02.002
Wang, S., Tuo, H., Cao, F., and Xing, Z. (2013). Experimental Investigation on Air-Source Transcritical CO2 Heat Pump Water Heater System at a Fixed Water Inlet Temperature. Int. J. Refrigeration 36, 701–716. doi:10.1016/j.ijrefrig.2012.10.011
Wang, W., Zhao, Z., Zhou, Q., Qiao, Y., and Cao, F. (2021). Model Predictive Control for the Operation of a Transcritical CO2 Air Source Heat Pump Water Heater. Appl. Energ. 2021 (300), 117339. doi:10.1016/j.apenergy.2021.117339
Wang, Y., Zong, S., Song, Y., Cao, F., He, Y., and Gao, Q. (2021). Experimental and Techno-Economic Analysis of Transcritical CO2 Heat Pump Water Heater with Fin-And-Tube and Microchannel Heat Exchanger. Appl. Therm. Eng. 2021 (199), 117606. doi:10.1016/j.applthermaleng.2021.117606
Yang, L.-X., Wei, X.-L., Zhao, L.-H., Qin, X., and Zhang, D.-W. (2019). Experimental Study on the Effect of Compressor Frequency on the Performance of Transcritical CO2 Heat Pump System with Regenerator. Appl. Therm. Eng. 150, 1216–1223. doi:10.1016/j.applthermaleng.2019.01.091
Zhang, G., Wang, F., Wang, D., Wu, T., Qin, X., and Jin, Z. (2019). Numerical Study of the Dehumidification Structure Optimization Based on the Modified Model. Energ. Convers. Management 181, 159–177. doi:10.1016/j.enconman.2018.12.001
Nomenclature
CFCs chlorofluorocarbons (-)
COP heating coefficient of performance (-)
CC correction coefficient (-)
f compressor frequency (Hz)
GWP global warming potential (-)
GCW water outlet temperature of gas cooler (°C)
h enthalpy (kJ·kg−1)
HCFCs hydrochlorofluorocarbons (-)
L length (m)
n compressor speed (rpm)
ODP ozone depression potential (-)
P pressure (kPa)
T temperature (°C)
UTC unit temperature-lift cost (-)
V swept volume (m3·h−1)
Greek symbols
chlorofluorocarbons (-) subscript
amb ambient
corr correlation
c CO2
com compressor
dis discharge
gc gas cooler
is isentropic
in inlet
max maximum
m mechanical
opt optimal
out outlet
R relative
suc suction
v volumetric
w water
1 compressor inlet
2 compressor outlet
3 gas cooler outlet
Keywords: transcritical cycle, carbon dioxide, compressor frequency, ambient temperature, gas cooler water outlet temperature
Citation: Dai C and Qin X (2022) Experimental Study on Heating Performance and a Novel Calculation Method of Water Outlet Temperature Based on Air Source Transcritical CO2 Heat Pump System. Front. Energy Res. 10:888562. doi: 10.3389/fenrg.2022.888562
Received: 03 March 2022; Accepted: 07 April 2022;
Published: 03 May 2022.
Edited by:
Baomin Dai, Tianjin University of Commerce, ChinaCopyright © 2022 Dai and Qin. This is an open-access article distributed under the terms of the Creative Commons Attribution License (CC BY). The use, distribution or reproduction in other forums is permitted, provided the original author(s) and the copyright owner(s) are credited and that the original publication in this journal is cited, in accordance with accepted academic practice. No use, distribution or reproduction is permitted which does not comply with these terms.
*Correspondence: Xiang Qin, eHFpbkB6enUuZWR1LmNu