- Department of Aerospace Science and Technology, Space Engineering University, Beijing, China
The spray characteristics of a gas-centered shear coaxial injector under different conditions and recess ratios (RR) were studied through experiments and numerical simulations. The numerical study was carried out based on the coupled level set and volume-of-fluid (CLSVOF) method and the adaptive mesh refinement (AMR) method. The results indicated that without recess, the spray angle first stayed almost constant and then dropped linearly with an increase in the gas mass flow rate
1 Introduction
Liquid rocket engines are the heart of liquid propellant rockets and are highly valued in many countries. The interaction between gases and liquids significantly enhances the atomization performance of gas–liquid coaxial injectors; therefore, these injectors are widely used in bipropellant liquid rocket engines (Kang et al., 2018).
In an experimental study of liquid-centered shear coaxial injectors, Hardalupas and Whitelaw (1994) found that atomization could be enhanced by reducing the diameter of the liquid injector. Yang and Fu (2012) found that recession could confine the airflow to limited space and enhance the gas–liquid interaction and thus could significantly improve the atomization performance. Hautman et al. (1993) conducted an experimental study on liquid-centered swirl coaxial injectors and found that the spray angle decreased with
Despite the numerous advantages of a gas-liquid coaxial injector, it can generate self-pulsation under certain structures and conditions, and the accompanying periodic pulsations of spray flow and pressure (Bazarov and Yang, 1998; Eberhart et al., 2012) may cause combustion instability in the thrust chamber, which could further result in combustion instability in liquid rocket engines. Nunome et al. (2007) and (Nunome et al., 2009) experimentally investigated the change in the liquid-centered shear coaxial injector spray from the stable to self-pulsation state and concluded that the recess of the inner injector was the key parameter to inducing injector self-pulsation. They found that there was a critical parameter Fcr, at which, when Rel/(Reg)0.5 < Fcr, self-pulsation could occur. Tsohas and Heister (2011) studied the internal flow of a recessed chamber during injector self-pulsation using two-dimensional simulation. They found that vortex shedding at the injector, the acoustic instability of the liquid injector, and vortex shedding at the injector outlet could result in self-pulsation. (Kim and Heister (2004) and Kim et al. (2005) conducted a three-dimensional simulation study of the flow inside the injector recess chamber and found that the pulsation frequency and amplitude could be increased by increasing the gas-liquid density and velocity ratios; the amplitude could also be increased by decreasing the jet diameter and increasing the recess length. Kelvin–Helmholtz (K-H) instability on the jet surface was assumed to cause self-pulsation of the injector. Self-pulsation of liquid-centered swirl coaxial injectors was first studied experimentally and theoretically by Bazarov et al. (1995), Bazarov (1998), and Bazarov and Yang (1998). It was concluded that self-pulsation was caused by the time-lag feedback between the rotating liquid sheet and the annular airflow and that self-pulsation can enhance the effect of atomization and mixing to a certain extent. The most important parameter affecting self-pulsation was the recess length. Eberhart et al. (2013) and Eberhart and Frederick (2017) found that the unstable frequency and wave velocity measured at a steady spray were consistent with those measured at self-pulsation in an analysis of proper orthogonal decomposition. Therefore, it was speculated that the occurrence of self-pulsation could be attributed to K-H instability. Chu et al. (2021) investigated the effect of backpressure on the self-pulsation of an injector using three-dimensional numerical simulation and found that: 1) with an increase in the backpressure, the mass flow rate distribution in the radial direction changed from a double peak to a single peak and 2) the central mass flow rate was increased by backpressure and
In recent decades, the study of the gas-liquid coaxial injector spray and self-pulsation characteristics has gradually intensified. The influences of injector structural parameters, injection conditions, back pressure, and other factors on the spray angle, breakage length, droplet SMD, and other spray characteristics were studied using theoretical, experimental, and simulated methods. However, few studies have been published that report on the spray and self-pulsation characteristics of gas-centered shear coaxial injectors. Therefore, in this study, the spray characteristics and self-pulsation of gas-centered shear coaxial injectors under different conditions and recess ratios were investigated by experiments and numerical simulations based on CLSVOF and AMR. Due to the limitation of experimental equipment, the SMD of droplets in this study was not measured. The latest results of particle measurement by Huang et al. (2022) and Wu et al. (2022) provide a reference for the follow-up work.
2 Experimental Methods
2.1 Experimental System
The experimental system was composed of four parts: 1) a propellant feed system, 2) a measurement and control system, 3) an image acquisition system, and 4) a bench system, as shown in Figure 1A. The propellant feed system was composed of a high-pressure gas source, gas conduit, liquid conduit, propellant tank, and other components. To achieve a smooth flow supply to the liquid injector, the propellant (water) storage tank was pressurized with compressed air. Meanwhile, the air was delivered by a high-pressure gas source to the gas injector through the conduit via the pressure-reducing valve. The pressure of the liquid and gas manifolds was measured and recorded using a pressure sensor: OHR-M2G-2-L-C-0-1.6 MPa with an accuracy of 0.5% FS. The mass flow rates of the water and pressurized air were measured and recorded using an LWGY turbine flowmeter and a Coriolis mass flowmeter (MFC608), with an accuracy of 0.5% FS, respectively. The in-line image acquisition system was composed of a high-speed camera, shading plate, and rectangular LED background light source (HLS-30, power: 250 W). The distance of each component could be adjusted to ensure a fine spray transient image. During the experiments, the recording rate of the camera was set as 31,862 fps, the exposure time was 1/95,586 s, and the resolution of the transient image was 800 × 600 pixels.
2.2 Geometries of the Injector and Experimental Operating Conditions
A gas-centered shear coaxial injector was studied in the experiment, as shown in Figure 1B, in which the outer injector was a coaxial annular aperture, and the inner injector was a central circular hole. The liquid fuel entered the injector through the coaxial annular aperture, and the gaseous oxidizer was fed through the central hole. They interacted with each other after spraying out from the injector. For the recessed injector, the gaseous oxidizer was ejected from the inner injector and expanded to compress the liquid fuel; thus, the oxidizer and fuel were initially mixed inside the recess chamber. The liquid fuel was jetted from the outer injector to form a liquid sheet near the injector outlet and then was broken into liquid blocks and droplets after a certain distance (breakup length) downstream. Recess is an important parameter which determines propellants’ mixing efficiency and even flame stability (Xu, 2016). Three injectors with different recess lengths were applied in the experiment. The recess length was the distance from the outlet section of the inner injector to the outlet section of the outer injector (Chu et al., 2021), as shown in Figure 1. The key geometrical parameters of the injector are listed in Table 1, and the RR is defined as follows:
In this study, the spray characteristics and self-pulsation of the gas-centered shear coaxial injector under different working conditions and recess ratios were mainly explored. To ensure the comprehensiveness of the experimental study, the operating conditions in the present experiments were denser, as shown in Table 2, whereas the errors of the gas and liquid mass flow rates were less than 4.2 and 6.7%, respectively. The
2.3 Image Processing
To obtain the spray angle, self-pulsation frequency, and other information, 2000 images were taken for each working condition and processed by the in-home code.
2.3.1 Acquisition of the Spray Angle
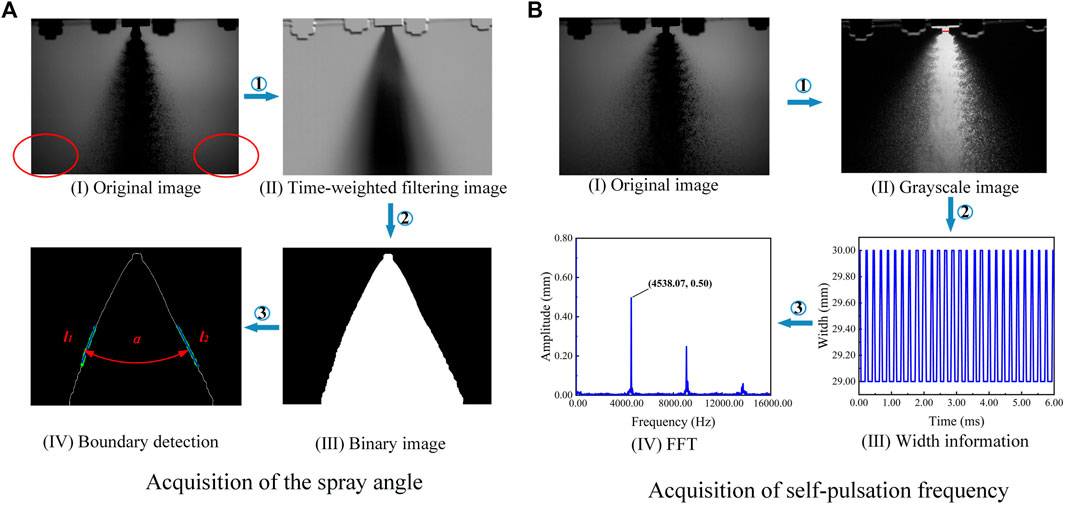
The extraction of the spray angle was performed using the clustering method. First, all the spray images were processed to obtain the time-averaged image; second, the weighted image was obtained by the background, and a time-averaged image was multiplied with the weighted image to eliminate the effect of uneven illumination; third, the time-weighted filtering image was obtained by Gaussian filtering, which was followed by the calculation of the average grayness of each class based on the K-means segmentation algorithm (Arthur and Vassilvitskii, 2007) to obtain the background image classification, and moreover, the background binary image was obtained by morphological filtering. The boundary coordinates were found to extract the spray boundaries, calculating the left and right boundaries of the spray to fit the straight lines l1 and l2. Due to the spray being completely broken and unfolded only in the downstream direction and to avoid the interference of the background (as marked by the red circle in Figure 2A), the fitted straight line was taken in the 50–75% interval downstream of the spray. Finally, the included angle between the two fitting lines was calculated by the program formula to obtain the spray angle, as shown in the following equation:
2.3.2 Acquisition of the Self-Pulsation Frequency
The self-pulsation frequency was obtained by first subtracting the background to obtain the grayscale image after background removal, followed by the binarization of the image after background removal, which was then processed to obtain the binarized image. At a certain distance from the injector outlet, a measurement line was selected (which is 2 mm below the injector for this study), and the spray width information reflected by the white area on the measurement line was extracted to obtain the spray width of each image. Finally, the frequency involved in the self-pulsation of the spray was obtained by the time series of the spray width subjected to a fast Fourier transform (FFT) (Xu, 2016), as shown in Figure 2B.
3 Theory and Model of Numerical Simulation
3.1 Governing Equations
The governing equations include the mass, momentum, and energy conservation equations, which are described by the governing equations of fluid motion. Incompressible fluid treatment should be conducted if the flow velocity of the liquid is low. Moreover, the incompressible gas treatment should be conducted when the flow velocity of the gas is lower. However, the density change can no longer be neglected if the flow velocity of the gas is larger (Ma > 0.15) (Luo, 2017). In that case, it should be treated as a compressible fluid, that is, the energy equation should be considered.
Conservation of mass equation:
Conservation of momentum equation:
Conservation of energy equation:
3.2 Turbulence Model and the Gas–Liquid Interface Capturing Method
The realizable k-ε model was chosen as the turbulence model, for which the constraint on the Reynolds stress was satisfied. Therefore, it can be kept consistent with the real turbulent flow in terms of the Reynolds stress. One of the advantages of this feature in the calculation is that the diffusion velocity of planar and circular jets can be simulated more accurately. Meanwhile, the calculated results could be more consistent with the real situation in problems such as the calculation of rotating flow, calculation of the boundary layer with a directional pressure gradient, and separation flow calculation.
The volume-of-fluid (VOF) method can 1) easily calculate complex phase interface change processes, 2) capture the particularly sharp phase interfaces, and 3) have good volume conservation and other advantages. Its disadvantages are that it may have difficulty in accurately calculating the curvature and physical quantities related to curvature, which results in an increase in the use of computational cost to capture the phase interface location in detail if the encryption of the grid at the phase interface becomes necessary. The level set method has the following advantages: 1) it can accurately calculate the curvature and curvature-related physical quantities, which does not need to reconstruct the interface; 2) it has stronger topological description ability, and 3) the phase interface calculated based on the level set method is smoother than that using the VOF method. Its disadvantage is that it faces difficulty in accurately simulating sharp interfaces with relatively poor volume conservation. CLSVOF combined the VOF method with the level set method, which has the advantages of those two methods. CLSVOF has an excellent capture of the phase interface in two-phase flow simulations (Wang et al., 2016).
The realizable k-ε model and the controlling equations of the CLSVOF are described in detail in the literature (Chu et al., 2020).
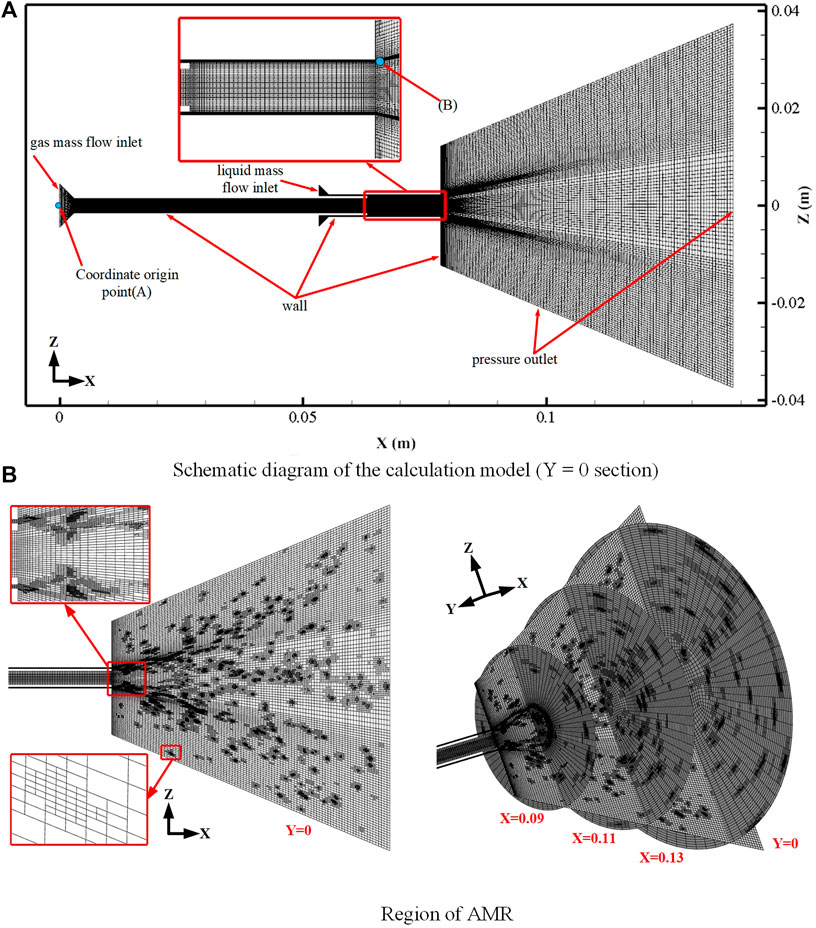
Owing to the multiscale characteristics of the atomization phenomenon, to fully collect the motion and breakage details of the liquid film and reduce the numerical errors in the numerical solution, the AMR method, which was based on the gradient of the liquid volume fraction (α), was used in this study to encrypt the mesh to accurately track the gas–liquid interface (Wang et al., 2021), as shown in Figure 3B. Refinement is realized when the following conditions are satisfied:
where h is the grid scale, and
3.3 Computational Model
A schematic representation of the calculation model is illustrated in Figure 3A. It has a gas injector bore diameter of 3 mm and a liquid injector bore diameter of 4.5 mm, among which the vertically downward direction was the positive X-axis, the coordinate origin was located at the center A (0, 0, 0) of the gas injector inlet, and the pressure monitoring point was located at Point B (80.2, 2.25, 0).
The inlet boundary condition of the mass flow rate was applied to the inlet of the gas and liquid, the outlet boundary was set as the pressure outlet boundary, and the wall surface was a non-slip wall boundary. The gas was simulated using air, and the liquid was simulated using water. The pressure discretization method (PRESTO) and the pressure-velocity coupling method (PISO) were applied. Furthermore, the second-order upwind scheme discretization was applied in the momentum and other equations, and the phase interface reconstruction technique (Geo-Reconstruct) was used. Moreover, the simulation accuracy of the wall part was improved by non-equilibrium wall functions. At the initial moment, all the fluid in the calculation region was air. The compressibility of air was considered, and its viscosity was calculated using the Sutherland method, as shown in the following equation:
where B ≈ 110.4 K. The equation is applicable to air over a fairly large range
For the acquisition of the self-pulsation frequency in the simulation, first, the pressure pulsation curve of monitoring point B (Case 0-80-5) was monitored, and then, its frequency was obtained through FFT (Chu et al., 2021), as shown in Figure 4A.
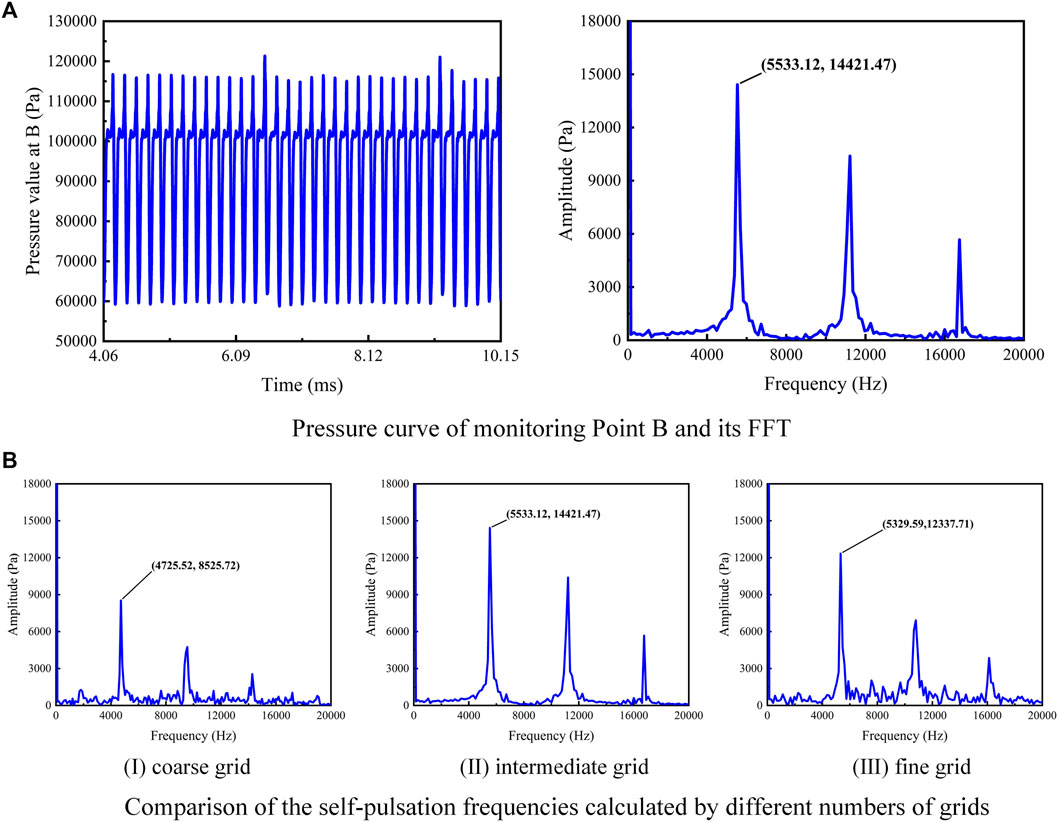
FIGURE 4. Pressure curve of the monitoring point B and its FFT and comparison of the self-pulsation frequencies calculated by different grids.
3.4 Simulation Working Condition
The effects of different recess ratios and gas-liquid mass flow rates on the spray characteristics were studied. The simulation working conditions are listed in Table 3.
3.5 Grid Independence
Case 0-80-5 was selected for the grid independence study. Three different grids, which initially (before AMR) contain 330,000 (coarse), 630,000 (intermediate), and 930,000 (fine) grids, respectively, were utilized to check the dependence of the grid size. The pressure pulsation frequency at the monitoring point B on basis of those three grids is plotted in Figure 4B. Compared with the self-pulsation frequency based on experimental data (5,286 Hz), the frequency errors obtained from the coarse grid calculation (10.6%) were greater than those obtained from the intermediate (4.7%) and fine grid calculations (0.8%). To reduce the calculation cost and ensure its accuracy, an intermediate grid was used for the calculation in this study.
4 Results and Discussion
4.1 Spray Angle
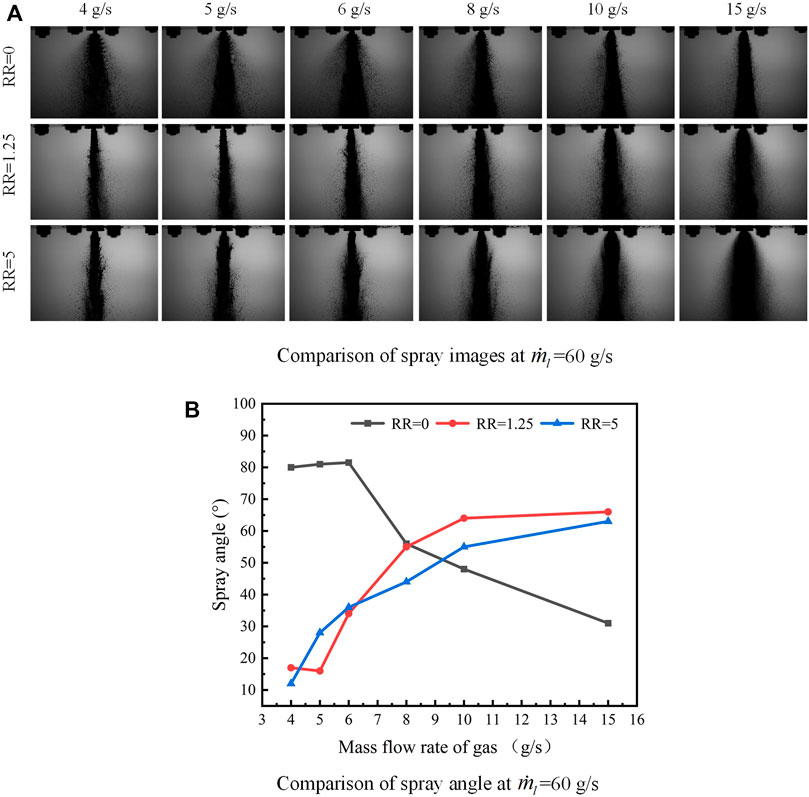
For injector without recess, the spray angle first stayed almost constant with the variation of
For an injector without recess, self-pulsation occurred at a low GLR (the details of self-pulsation are described in section 4.2). The spray pulsations in the radial direction led to an increase in the radial distribution of the droplets, resulting in an enlarged spray angle. The self-pulsation phenomenon of the spray was enhanced with the increasing GLR (0.07 ≤ GLR≤0.10). However, because the spray pulsations were very intense, the increase in the spray angle was not particularly significant. In other words, the spray angles stayed almost constant. When the GLR continued to increase, the axial velocity of the central airflow increased sharply, and the strong ejecting effects of the central airflow made the liquid film outlet completely broken. At the same time, the strong ejecting effects made the liquid converge toward the axis, which resulted in the spray angle dropping linearly. Even though there were still self-pulsations in the first working conditions (0.10 < GLR≤0.17), the promotion effect of spray pulsation on the spray angle was inferior to the weakening effect of ejecting effects on the spray angle. Meanwhile, the promotion effect of the expansion of the central airflow outlet on the spray angle was inferior to the weakening effect of ejecting effects on the spray angle. A larger GLR led to a stronger ejecting effect of the central airflow and hence minimizes the spray angle.
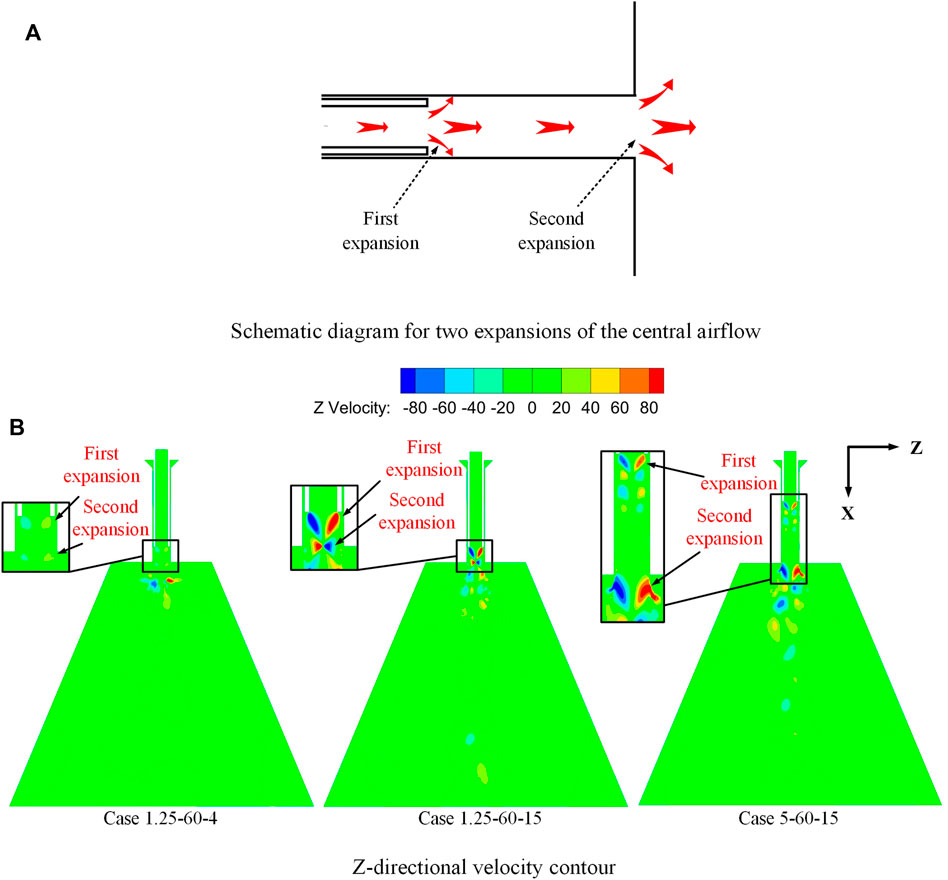
In the current study, the Mach numbers at the outlet of the gas injector were greater than 0.15. In other words, the gas could not be treated as an incompressible flow. The gas expanded at the injector outlet, and the liquid sheet was directly affected by the gas flow. For the injector with recess, the center gas experienced two expansions, as shown in Figure 6A. The first expansion occurred in the recess chamber after the center gas flowed out of the inner injector. Thereafter, the gas got expanded once more downstream of the outlet of the outer injector. However, for the injector without recess, the center gas flow experienced only one expansion at the outlet of the inner injector.
Under conditions with a low GLR (0.07 ≤ GLR<0.13), spray self-pulsation was found for injectors with recess. However, spray angles for those injectors were relatively smaller than those for injectors without recess. It was concluded that the radial diffusion of the liquid film is limited by the recess chamber wall. At the same time, recess can lead to a strong gas–liquid interaction. In other words, the central airflow has strong momentum transfer to the liquid film in the recess chamber. These reduced the radial velocity of the liquid film at the injector outlet, which resulted in a reduction in the spray angle. With the increase in RR, the recess chamber wall limited the radial diffusion of the liquid film for a longer time, and the acting time of the central airflow with the liquid sheet was longer. The radial velocity of the liquid sheet was reduced more significantly, thus further reducing the spray angle. However, with an increase in the GLR, the secondary expansion of the central airflow at the outlet of the outer injector became more and more significant. The expansion gas transferred a greater radial velocity to the liquid sheet, which resulted in an increase in the radial velocity of the liquid sheet and a subsequent increase in the spray angle. However, under a low GLR, the secondary expansion of the central airflow was insignificant and contributed little to the radial velocity of the liquid sheet. Moreover, the above-mentioned observations were confirmed through simulation. The Z-directional velocity contours for case 1.25-60–4, case 1.25-60–15, and case 5-60–15 are shown in Figure 6B. The two airflow expansions related to case 1.25-60-4 were minimal, whereas the two airflow expansions related to case 1.25-60-15 and case 5-60-15 were significant.
4.2 Self-Pulsation Phenomenon Without Recess
When conducting the experiment under specific working conditions, the injector produced a self-pulsation phenomenon, accompanied by a loud scream, and the self-pulsation frequency increased with
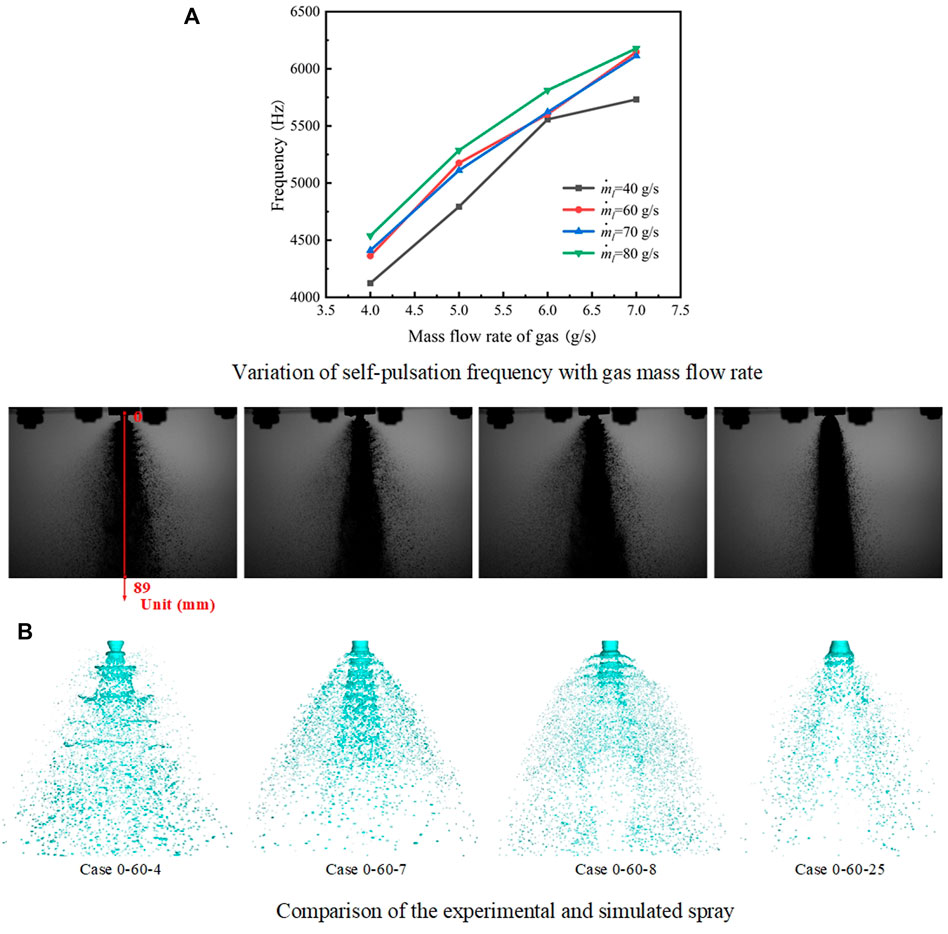
FIGURE 7. Variation of the self-pulsation frequency with
Similar results were obtained from the simulation calculations. As shown in Figure 7B, under
When
Meanwhile, a consistent pattern was observed in the experimental and simulation results; the frequency of self-pulsation increased with
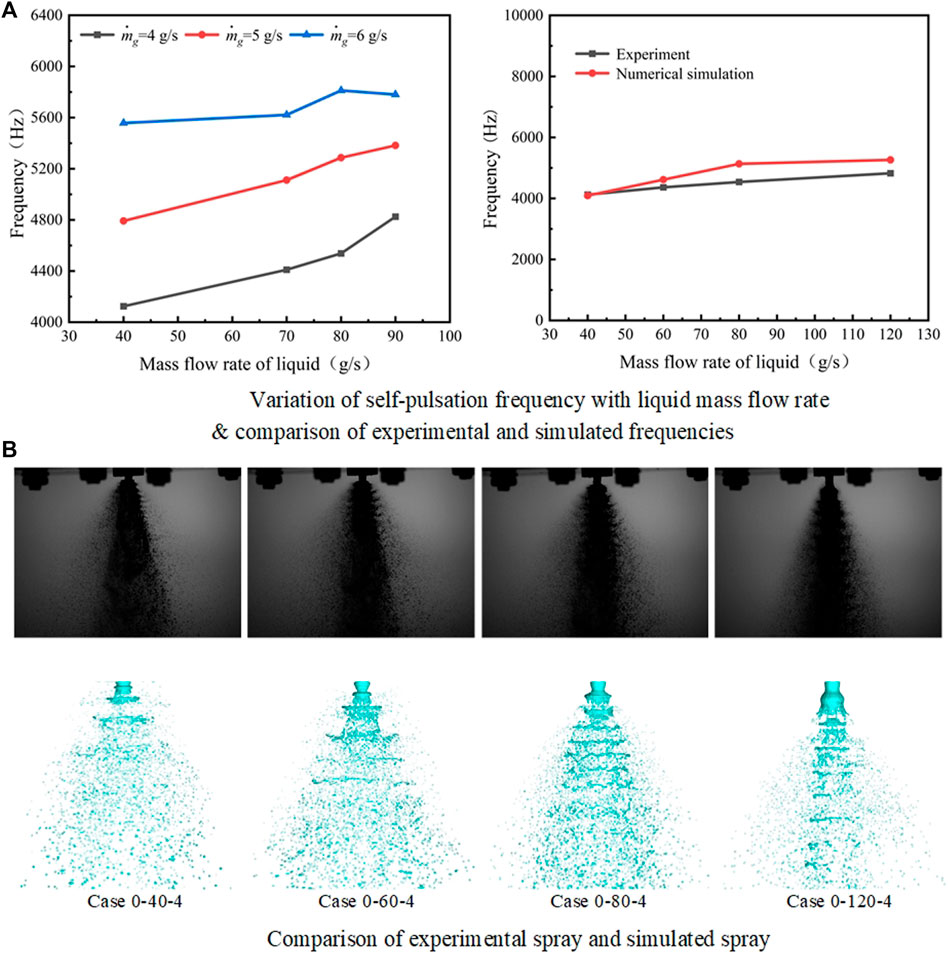
FIGURE 8. Variation of the self-pulsation frequency with
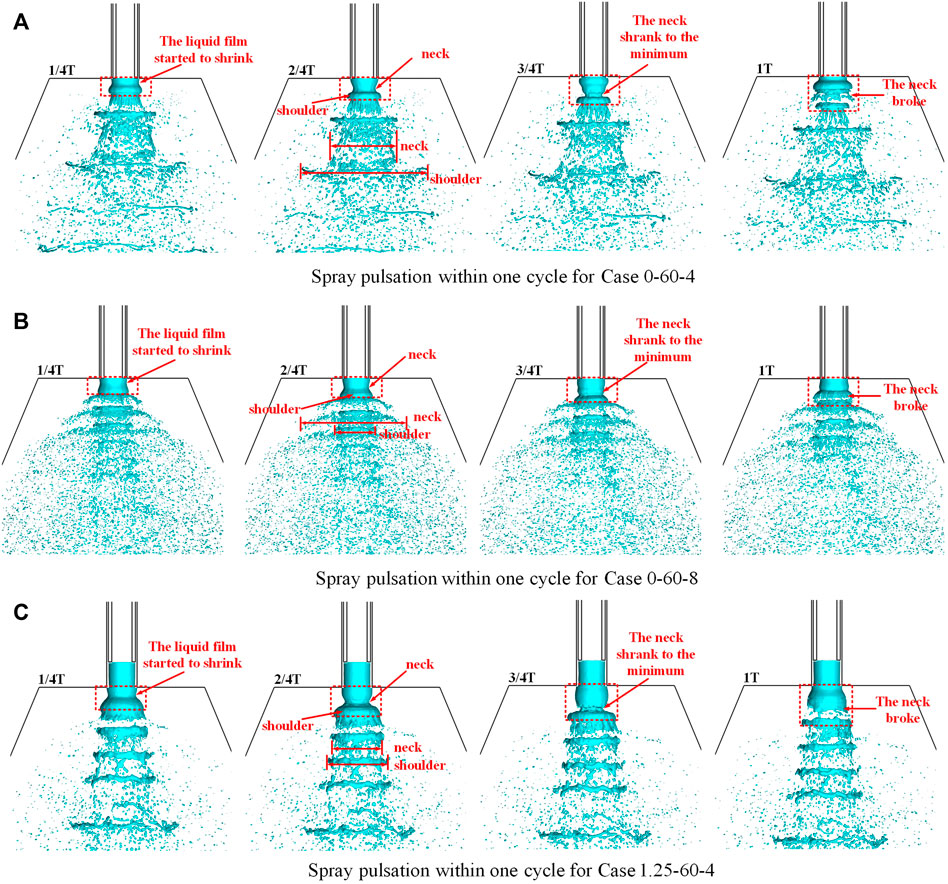
Analysis suggests that the injector self-pulsation resulted from the combined action of the pressure difference between the inside and outside of the liquid sheet, the surface tension of the liquid sheet, and the impact extrusion of the central airflow. For example, in case 0-60-4, the liquid sheet flowed out from the outer annular aperture injector outlet at 1/4T. The airflow in the center of the annular liquid film was fast, while the airflow outside the annular liquid film was approximately in a static state, as shown in Figure 9A. In accordance with the Bernoulli equation, the outer pressure of the liquid sheet was demonstrably higher than the inner pressure. Owing to the action of the pressure difference between the inside and outside of the liquid sheet, the liquid film of the annular aperture injector tended to shrink toward the central axis shortly after it flowed out of the injector outlet. As the liquid sheet underwent contraction, the “neck” and “shoulder” sections of the spray formed gradually at 2/4T. As the “neck” section blocked the central gas channel, gas accumulation occurred in the inner side of the annular liquid film and caused the pressure inside the annular liquid film to rise. The pressure difference between the inside and outside of the liquid film began to reverse. When the “neck” section shrank to its minimum size, the pressure difference between the inside and outside of the liquid sheet attained the maximum value (as shown in Figure 10B at 3/4T). Concurrently, the effect of surface tension of the liquid film during contraction caused the downstream liquid film of the “neck” section to become weak. Subsequently, under the combined action of the pressure difference and the impact extrusion of the central gas flow, the “neck” broke, and the gas channel opened (the process was also caused by the combined action of the K-H instability and R-T instability). Then, the spray entered the next pulsation cycle. Substantial momentum was transferred at the “neck” fracture owing to the “breaking out of the liquid film” of the central airflow (as shown in Figure 9A at 1T) such that the droplet and liquid block gained a large radial velocity, thus increasing the spray angle. The self-pulsation spray was formed in the shape of a “Christmas tree”. The droplet clusters were periodically produced and moved downstream with the spray.
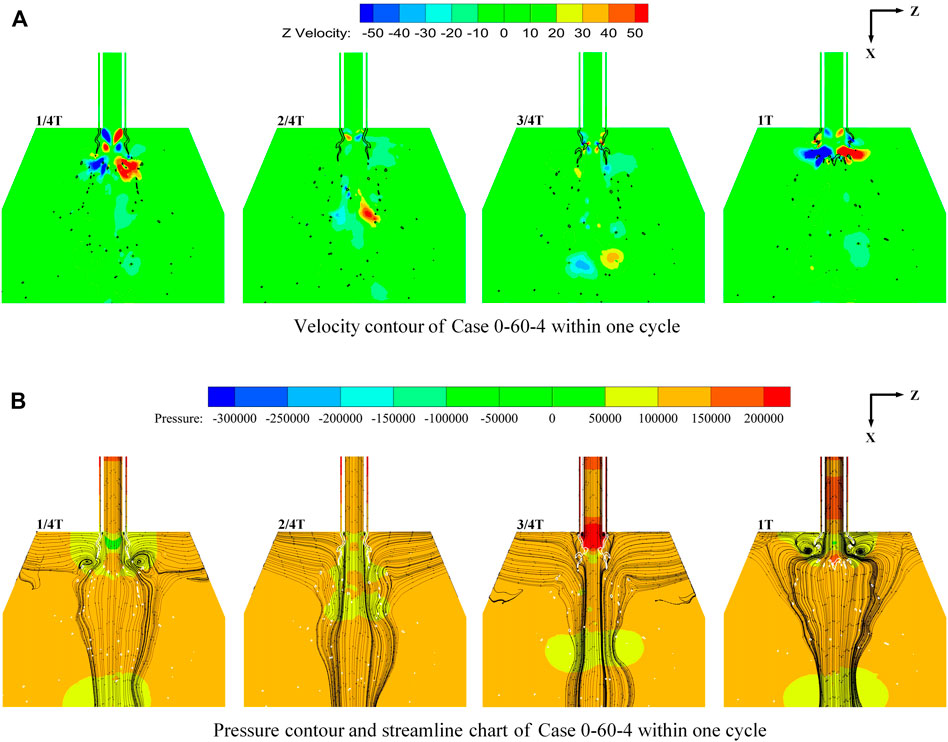
FIGURE 10. Velocity contour, pressure contour, and streamlines of case 0-60-4 within one cycle (the thick solid line indicates the isoline of the liquid phase volume fraction of 0.25).
Meanwhile, the flow characteristics during the cycle were evident, as shown in Figure 10, which shows the velocity contour, pressure contour, and streamline chart during one cycle of case 0-60-4. As the liquid sheet began to contract, the gas channel at the contraction narrowed at 1/4T, which resulted in an increase in the velocity of the airflow. However, the velocity of the central airflow and the inner part of the liquid film of the annular aperture was reduced by shearing. This resulted in the formation of two counter-swirl reflux zones at the gas injector outlet, with two vortices in opposite directions. The “neck” formation began at 2/4T, and the increasing length of the shearing effect between the central airflow and the inner side of the annular aperture liquid sheet resulted in an increase in the counter-swirl reflux zones. Thus, the two opposite vortices formed between the outlet of the gas injector and the inside of the liquid film increased, and this growth was apparent at 3/4T. Finally, when the “neck” section broke at 1T, the central airflow “broke out of the liquid film” with the opened gas channel. The two vortices in opposite directions formed in the inner part of the “neck” section dissipated rapidly. At the same time, two larger opposing vortices at the “broken” section owing to gas-liquid entrainment and some small and complex vortex systems were generated simultaneously.
When the
4.3 Self-Pulsation Phenomenon With Recess
The experimental results revealed similar changes in behavior for the injector with and without recess. In other words, when
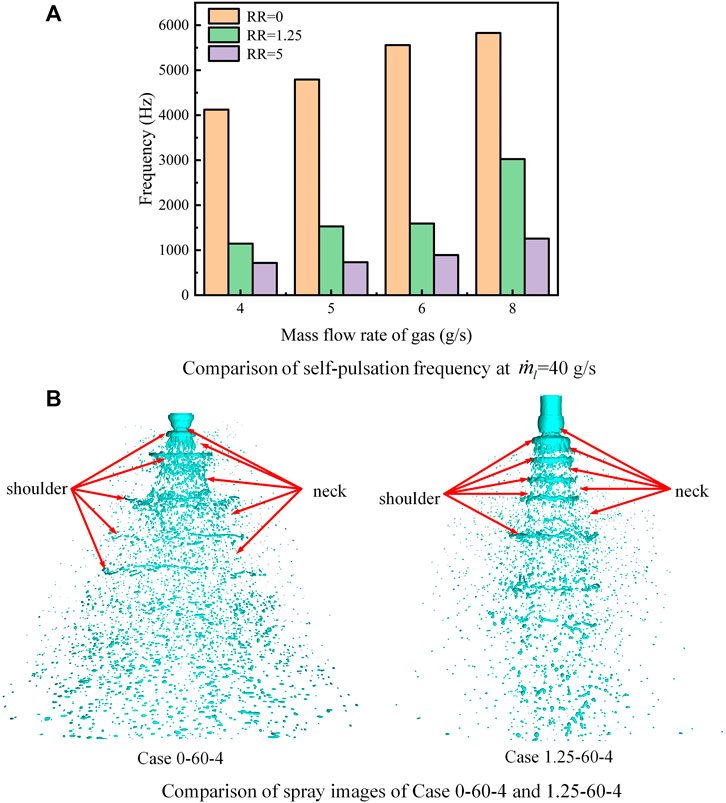
FIGURE 11. Comparison of the self-pulsation frequency at
The central gas flow in the recess chamber was assumed to have produced the entrainment and ejection functions on the annular aperture liquid sheet. On the one hand, the friction between the gas and liquid hindered the flow of the liquid sheet, which prolonged the period of liquid sheet pulsation, that is, the frequency of self-pulsation decreased. On the other hand, the wall limited the radial velocity of the liquid sheet, which reduced the amplitude of radial pulsation downstream of the outlet, that is, the intensity of self-pulsation decreased. When RR increased, the friction between the gas and liquid further hindered the flow of the liquid sheet. Therefore, the frequency of self-pulsation was further reduced.
Numerical simulations of the injector with recession showed that it also underwent a similar self-pulsation cycle as the injector without a recession, as shown in Figure 11B, for the comparison of the spray images of cases 0-60-4 and 1.25-60-4. However, as mentioned earlier, as the recess chamber wall also limited the radial velocity of the liquid sheet, the radial pulsations downstream of the exit amplitude were reduced. This demonstrated that the width difference between the “shoulder” and “neck” of the spray decreased, that is, the spray angle decreased. The spray pulsation process in one cycle of the working condition (frequency of 4,354 Hz obtained from the simulation) is depicted in Figure 9C. In this period, the spray pattern was more distinguishable as a “string” shape than a “Christmas tree” shape.
5 Conclusion
In this study, the spray characteristics of gas-centered shear coaxial injectors under different operating conditions and RRs were investigated through experiments and numerical simulation methods based on CLSVOF and AMR. The results demonstrated the following.
1) In the case of a constant
2) The experimental results revealed that under certain conditions, the injector without recess produced a self-pulsation phenomenon accompanied by a loud scream, and the self-pulsation frequency increased with
3) The changes of self-pulsation in the injector with recession exhibited a pattern similar to that without recess. However, the self-pulsation frequency for an injector with recess was significantly lower than that without recess. It can be concluded from the analysis results that the friction between the gas and liquid inside the recess chamber hindered the flow of the liquid sheet, which extended the liquid sheet pulsation period, that is, the frequency of self-pulsation decreased. Meanwhile, the radial velocity of the liquid sheet would be restricted by the wall such that its radial pulsations downstream of the outlet amplitude would decrease, that is, the intensity of self-pulsation would be weakened.
4) The self-pulsation mechanism was initially explored through the numerical simulation. The self-pulsation of the injector was possibly the result of the combined action of the pressure difference between the inside and outside of the liquid sheet, the surface tension of the liquid sheet, and the impact extrusion of the central airflow. The self-pulsation spray was shaped like a “Christmas tree” for the injector without recess, whereas the spray was shaped like a “string” for the injector with recess. It was caused by the recess chamber wall to limit the radial velocity of the liquid sheet, and then, the width difference between the “shoulder” and “neck” of the spray and the radial pulsations downstream of the exit amplitude could be further reduced.
Data Availability Statement
The original contributions presented in the study are included in the article/Supplementary Material; further inquiries can be directed to the corresponding authors.
Author Contributions
GY mainly contributed to experiments, data processing, and writing; CW and XY were the main contributors to the experiment; JC and XB contributed primarily to data processing; Su and Tong provided financial support for the experiment.
Funding
The study was supported by the National Natural Science Foundation of China (No. 12002386).
Conflict of Interest
The authors declare that the research was conducted in the absence of any commercial or financial relationships that could be construed as a potential conflict of interest.
Publisher’s Note
All claims expressed in this article are solely those of the authors and do not necessarily represent those of their affiliated organizations, or those of the publisher, the editors, and the reviewers. Any product that may be evaluated in this article, or claim that may be made by its manufacturer, is not guaranteed or endorsed by the publisher.
Acknowledgments
The authors would like to express their sincere acknowledgment for support from the National Natural Science Foundation of China (No. 12002386).
References
Arthur, D., and Vassilvitskii, S. (2007). “K-means++: The Advantages of Careful Seeding, SODA '07,” in Proceedings of the Eighteenth Annual ACM-SIAM Symposium on Discrete Algorithms (Philadelphia, PA: Society for Industrial and Applied Mathematics).
Bazarov, V. G., and Yang, V. (1998). Liquid-propellant Rocket Engine Injector Dynamics. J. Propuls. Power 14, 797–806. doi:10.2514/2.5343
Bazarov, V. (1998). “Non-linear Interactions in Liquid-Propellant Rocket Engine Injectors,” in 34th AIAA/ASME/SAE/ASEE Joint Propulsion Conference and Exhibit (Cleveland, OH: AIAA).
Bazarov, V. (1995). “Self-pulsations in Coaxial Injectors with Central Swirl Liquid Stage,” in 31st AIAA/ASME/SAE/ASEE Joint Propulsion Conference and Exhibit (San Diego, CA: AIAA).
Chu, W., Li, X., Tong, Y., and Ren, Y. (2020). Numerical Investigation of the Effects of Gas-Liquid Ratio on the Spray Characteristics of Liquid-Centered Swirl Coaxial Injectors. Acta Astronaut. 175, 204–215. doi:10.1016/j.actaastro.2020.05.050
Chu, W., Ren, Y., Tong, Y., Li, X., Jiang, C., and Lin, W. (2021). Numerical Study of Effects of Backpressure on Self-Pulsation of a Liquid-Centred Swirl Coaxial Injector. Int. J. Multiph. Flow 139, 103626. doi:10.1016/j.ijmultiphaseflow.2021.103626
Eberhart, C. J., and Frederick, R. A. (2017). Details on the Mechanism of High-Frequency Swirl Coaxial Self-Pulsation. J. Propuls. Power 33, 1418–1427. doi:10.2514/1.b36216
Eberhart, C. J., Lineberry, D. M., and Jr Frederick, R. A. (2013). “Detailing the Stability Boundary of Self-Pulsations for a Swirl-Coaxial Injector Element,” in 49th AIAA/ASME/SAE/ASEE Joint Propulsion Conference (San Jose, CA: AIAA).
Eberhart, C., Lineberry, D., and Frederick, R. (2012). “Propellant Throttling Effects on Self-Pulsation of Liquid Rocket Swirl-Coaxial Injection,” in 48th AIAA/ASME/SAE/ASEE Joint Propulsion Conference & Exhibit (Atlanta: AIAA). doi:10.2514/6.2012-4204
Hardalupas, Y., and Whitelaw, J. H. (1994). Characteristics of Sprays Produced by Coaxial Airblast Atomizers. J. Propuls. Power 10, 453–460. doi:10.2514/3.23795
Hautman, D. J. (1993). Spray Characterization of Liquid/gas Coaxial Injectors with the Center Liquid Swirled. At. Spr. 3, 373–387. doi:10.1615/atomizspr.v3.i4.20
Huang, J., Cai, W., Wu, Y., and Wu, X. (2022). Recent Advances and Applications of Digital Holography in Multiphase Reactive/nonreactive Flows: a Review. Meas. Sci. Technol. 33, 022001. doi:10.1088/1361-6501/ac32ea
Kang, Z. T., Li, X. D., Mao, X. B., and Li, Q. L. (2018). Review on Gas Liquid Shear Coaxial Injector in Liquid Rocket Engine. Acta Aeronautica Astronautica Sinica 39, 6–25. doi:10.7527/S1000-6893.2018.22221
Kim, B.-D., Heister, S. D., and Collicott, S. H. (2005). Three-dimensional Flow Simulations in the Recessed Region of a Coaxial Injector. J. Propuls. Power 21, 728–742. doi:10.2514/1.12651
Kim, B.-D., and Heister, S. D. (2004). Two-phase Modeling of Hydrodynamic Instabilities in Coaxial Injectors. J. Propuls. Power 20, 468–479. doi:10.2514/1.10378
Kulkarni, V., Sivakumar, D., Oommen, C., and Tharakan, T. J. (2010). Liquid Sheet Breakup in Gas-Centered Swirl Coaxial Atomizers. J. Fluids Eng. 132, 011303. doi:10.1115/1.4000737
Li, J. N., Lei, F. P., Zhou, L. X., and Yang, A. L. (2019). Effects of Misaligned Impingement on Atomization Characteristics of Impinging Jet Injector. J. Aerosp. Power 34, 2280–2293.
Nunome, Y., Sakamoto, H., Tamura, H., Kumakawa, A., Amagasaki, S., and Inamura, T. (2007). “An Experimental Study of Super-pulsating Flow on a Shear Coaxial Injector with a Recessed Inner Post,” in 43rd AIAA/ASME/SAE/ASEE Joint Propulsion Conference & Exhibit (Cincinnati, OH: AIAA).
Nunome, Y., Tamura, H., Onodera, T., Sakamoto, H., and Inamura, T. (2009). “Effect of Liquid Disintegration on Flow Instability in a Recessed Region of a Shear Coaxial Injector,” in 45th AIAA/ASME/SAE/ASEE Joint Propulsion Conference & Exhibit (Denver, CO: AIAA).
Siddharth, K. S., Panchagnula, M. V., and Tharakan, T. J. (2017). Effect of Gas Swirl on the Performance of a Gas-centered Swirl Co-axial Injector. At. Spr. 27, 741–757. doi:10.1615/atomizspr.2017019923
Tsohas, J., and Heister, S. D. (2011). Numerical Simulations of Liquid Rocket Coaxial Injector Hydrodynamics. J. Propuls. Power 27, 793–810. doi:10.2514/1.47761
Wang, K., Yang, G. H., Li, P. F., Zhang, M. Q., and Zhou, L. X. (2016). Numerical Simulation of Internal Flow Process in Pressure Swirl Injector. J. Rocket Propuls. 42, 14–20. doi:10.3969/j.issn.1672-9374.2016.04.003
Wang, L., Fang, B., and Wang, G. C. (2021). Process of Pressure Swirl Injector Atomization Based on Large Eddy Simulation. J. Propuls. Technol. 42, 1855–1864. doi:10.13675/j.cnki.tjjs.190392
Wu, Y. C., Zhao, X. X., Zhang, H. Y., Lin, X. D., and Wu, X. C. (2022). Discrimination and Measurement of Droplet and Ice Crystal by Combining Digital Inline Holography with Interferometric Particle Imaging with Single Color Camera. IEEE Trans. Instrum. Meas., 0018–9456. doi:10.1109/tim.2022.3147333
Xu, S. (2016). Experimental Study on Spray Characteristic of Gas-Liquid Centred Coaxial Swirling Injectors. Changsha: National University of Defense Technology.
Yang, L.-J., and Fu, Q.-F. (2012). Stability of Confined Gas-Liquid Shear Flows in Recessed Shear Coaxial Injectors. J. Propuls. Power 28, 1413–1424. doi:10.2514/1.b34560
Yang, L. J., Ge, M. H., Zhang, M. Z., Fu, Q. F., and Cai, G. B. (2006). Spray Characteristics of Recessed Gas-Liquid Coaxial Swirl Injector. J. Propuls. Power 2, 1332–1339. doi:10.13675/j.cnki.tjjs.2006.04.001
Nomenclature
do inner diameter of the outer injector (unit: mm)
dg inner diameter of the inner injector (unit: mm)
dt outer diameter of the inner injector (unit: mm)
Lr recessed length (unit: mm)
RR recess ratio
μ viscosity coefficient (unit: Pa·s)
p pressure (unit: Pa)
ρ density (unit: Kg/m3)
g gravitational acceleration vector (unit: m/s2) gas
F additional volume force vector (unit: N)
U velocity vector (unit: m/s)
TL temperature (unit: K)
T symbol of period
keff effective heat transfer coefficient (unit: W/m·K)
I unit tensor
Jj diffusive flow of the component j
Sh volumetric heat source term
hj enthalpy of the component j (unit: J)
TL0 reference temperature (unit: K)
μ0 reference viscosity coefficient (unit: Pa·s)
Subscripts
g gas
l liquid
Keywords: gas-centered shear coaxial injector, self-pulsation, frequency, recess ratio, spray angle, numerical simulation
Citation: Yuchao G, Wei C, Yuan X, Chuanjin J, Boqi X, Lingyu S and Yiheng T (2022) Investigations on Spray Characteristics and Self-Pulsation of a Gas-Centered Shear Coaxial Injector. Front. Energy Res. 10:887368. doi: 10.3389/fenrg.2022.887368
Received: 01 March 2022; Accepted: 19 April 2022;
Published: 30 May 2022.
Edited by:
Xiao Liu, Harbin Engineering University, ChinaReviewed by:
Wu Yi, Beijing Institute of Technology, ChinaYingchun Wu, Zhejiang University, China
Jiaqi Zhang, National University of Defense Technology, China
Copyright © 2022 Yuchao, Wei, Yuan, Chuanjin, Boqi, Lingyu and Yiheng. This is an open-access article distributed under the terms of the Creative Commons Attribution License (CC BY). The use, distribution or reproduction in other forums is permitted, provided the original author(s) and the copyright owner(s) are credited and that the original publication in this journal is cited, in accordance with accepted academic practice. No use, distribution or reproduction is permitted which does not comply with these terms.
*Correspondence: Su Lingyu, c3VsaW5neXU3N0AxNjMuY29t; Tong Yiheng, eWloZW5nX3RvbmdAc2luYS5jb20=
 Gao Yuchao
 Chu Wei
 Xie Yuan
 Jiang Chuanjin
 Xu Boqi
 Tong Yiheng


