 Filippo Campagnolo
 Francesco Castellani
 Francesco Natili2
 Davide Astolfi
 Franz Mühle
- 1Wind Energy Institute, Technical University of Munich, Garching bei München, Germany
- 2Department of Engineering, University of Perugia, Perugia, Italy
The yaw control of horizontal-axis wind turbines is the key point for wake redirection, which is expected to provide an improvement in the balance between wind farm production and loads. For multi-MW upwind wind turbines, there are substantially two possibilities for obtaining a desired demanded yaw angle: using yaw actuators or Individual Pitch Control (IPC). A detailed balance of the pros and cons of both approaches requires in-depth studies. On these grounds, this work is a comprehensive experimental characterization of the yaw by individual pitch control (yaw-by-IPC). The experiments are conducted at the R. Balli wind tunnel of the University of Perugia on a fully instrumented wind turbine scaled model, named G1, developed by the Technical University of Munich. The objective of the study is twofold: assessment of the performance of the yaw-by-IPC in terms of yaw tracking capabilities and impact on power, loads, and actuators usage; analysis of its impact on the shed wake. The wake has been characterized on a plane parallel to the rotor at a distance of 1.82 diameters by imposing several steady yaw references, while wind intensity measurements have been performed through a traversing system hosting a hot wire anemometer. Each target of the analysis has been characterized for the yaw-by-IPC and for the control based on yaw actuation, in order to perform a comparison. With laminar inflow, it results that the yaw-by-IPC follows very well the demanded reference, even with a slight improvement in the case of dynamic yaw reference, and no power losses are visible. Concerning the wake shed by a yawed G1 with yaw-by-IPC, a higher flow speed is observed immediately behind the windward side of the rotor than with geared yaw actuation. It results, therefore, that yaw-by-IPC applied to a yawed wind turbine may increase the available wind power at a downstream machine.
1 Introduction
The scientific comprehension of wake interactions (Sorensen and Shen, 2002; Sørensen et al., 2015) between nearby wind turbines have gradually directed the perspective of the wind energy community toward the development of cooperative wind farm control strategies (Andersen et al., 2020).
In a nutshell, it can be stated that when it comes to wind farm control, there are two conflicting targets to address in the most intelligent way: maximizing the energy yield and minimizing fatigue loads (Soleimanzadeh et al., 2012). In order to reliably address the wind farm control design, it is therefore fundamental to have an in-depth knowledge about the impact of wake interactions on wind turbine loads and wind farm power output, and how these are affected by the adopted control strategy.
Among the most promising cooperative control strategies there is wake steering (Fleming et al., 2014; Fleming et al., 2016; Fleming et al., 2017), which consists in steering by yawing the wake shed by upstream wind turbines, with the aim of improving the overall wind farm power capture. For example, in Bastankhah and Porté-Agel, (2019), wind tunnel analysis are performed, with the objective of exclusively assessing the power outputs (and not the loads) for a row of wind turbines; in that study, it is argued that the most profitable configuration is obtained using relatively large yaw angles (order of about ten degrees) for several layers of the row. In Bastankhah and Porté-Agel, (2016), wind tunnel and theoretical analysis are conducted in order to characterize the properties of the wakes of yawed wind turbines; the objective of that study is gathering knowledge, in order to formulate a reliable analytical model for the wake of a yawed wind turbine, which is of course immensely computational cost saving with respect to CFD simulations. Nevertheless, it is evident that yaw misalignment may increase the loading on the rotor disk (Zalkind and Pao, 2016). In van Dijk et al. (2016) and van Dijk et al. (2017), for example, an optimization computational tool, simulating a wind farm of NREL 5 MW wind turbines, has been developed. The objective is modeling yaw misalignment, wake interactions and partial wake overlap with the result that partial wake overlap increases the flapwise and edgewise bending moments, compared to fully symmetrical wake overlap. It should be noticed that, recently, first wake steering experiments applied to real-world industrial wind farms have been performed (Fleming et al., 2019; Fleming et al., 2020; Doekemeijer et al., 2021; Simley et al., 2021) and the general outcome is that the advantages of wake steering are clear, but the assessment of performance and loads at a wind farm level is complex.
For these reasons, there is a flourishing literature about wind turbine wakes redirection through yaw control and a stimulating line of research regards the analysis of the most appropriate way of controlling yaw. Two alternatives are conceivable: the use of yaw motors and the application of Individual Pitch Control (IPC) (Navalkar et al., 2014).
A critical point regarding the active yawing for wake redirection is the yaw actuator duty cycle, as investigated in Kanev, (2020). Actually, the yaw of the upstream wind turbines in the practice is misaligned based on predictions provided by static wake models, but the wind fluctuations require a dynamic balance between maximizing the energy production and minimizing the loads caused by the yaw system motion. It should be noticed as well that the optimization of yaw duty cycle (even without wake steering) at the wind farm level has been recently attracting an increasing amount of attention (Bossanyi, 2019).
On the other side, the yaw control through IPC (yaw-by-IPC), achieved by including a once-per revolution (1P) blade pitching component, can contribute in strongly reducing the yaw system usage and some structure loads. When yaw-by-IPC is employed, indeed, yawing moments on the nacelle are transferred to a very small extent to the tower through yaw bearing friction, significantly reducing the tower torsional loads. These observations are argued in Navalkar et al. (2014) on the grounds of aero-elastic simulations of a multi-MW wind turbine.
Basing on the above literature survey, it clearly arises that further in-depth experimental analysis about wind turbine controls for wake redirection is particularly useful, and the present study aims at furnishing a contribution to this issue. As wake steering is supposed to be mainly applied while the turbines operate in region II, i.e., for wind speeds lower than rated (Fleming et al., 2019), the objective of the present study is therefore a characterization of the effectiveness of yaw-by-IPC under these conditions. Specifically, we investigated the capability of yaw-by-IPC in tracking the required yaw reference, as well as its impact on the performance, loads and wake shed by the controlled rotor. The study, performed through a collaboration between the Technical University of Munich (TUM) and the University of Perugia, is based on experimental wind tunnel testing applied to a fully actuated, and extensively sensorized, wind turbine scaled model, named G1 (Bottasso and Campagnolo, 2021). The experimental tests have been conducted at the R. Balli wind tunnel of the University of Perugia. A traversing system, hosting a hot wire anemometer, has been employed to characterize the behavior of the wake of the G1 wind turbine.
The objective of the conducted experimental analysis is substantially twofold:
1. Assess the performance of yaw-by-IPC in terms of yaw tracking capabilities and impact on power, loads and actuators usage. This analysis has been performed by requesting both steady and dynamically varying yaw set-points. The latter type of request is particularly important to analyze, as it reflects typical applications in realistic time-varying inflow conditions (Campagnolo et al., 2020).
2. Analyze the impact of yaw-by-IPC on the shed wake. In this regard, the wake as been characterized, by imposing several steady yaw references, on a vertical plane located 1.82 diameters downstream of the rotor.
The behavior of the G1 wind turbine, and of its wake, has been characterized by comparing the IPC-based yaw control against the standard yaw control based on geared actuation.
The tests have been conducted in an environment characterized by an extremely low turbulence intensity. This provides the advantage that the effects of the investigated control strategies on the quantity of interests are better highlighted, as they are not smeared by turbulence. In the perspective of real-world applications, however, the observed results may be not be directly applicable, as wind turbines normally operate in turbulent inflow conditions. In order to at least partially compensate for this mismatch, some tests with a controlled unsteadiness have been also realized in the form of harmonically oscillating wind speed waves. Moreover, the measured data have been compared to those gathered while testing the G1 in a boundary layer wind tunnel (Göçmen et al., 2022). As will be discussed in detail in the following, the results collected in the present study are promising for the perspective of yaw-by-IPC application to wake steering.
The structure of the manuscript is the following. Section 2 is devoted to materials and methods: the G1 wind turbine is described, with a particular attention to the functioning of the yaw control via geared actuation or via IPC, and information about the wind tunnel and the experimental set up is provided. The results are collected and discussed in Section 3; finally, conclusions are outlined in Section 4.
2 Materials and Methods
2.1 Yaw by Individual Pitch Control: Formulation
Modern IPC strategies are realized by providing individual reference pitch signals to the controllers of the electrical or hydraulic pitch actuators. In most applications, IPC is employed for reducing fatigue loads on various machine components (Bossanyi, 2003; Bossanyi, 2005). For this purpose, the so-called Multi-Blade Coordinate (MBC) transformation is used, which transforms load signals, measured at the blade root, from the rotating reference frame into a fixed reference frame. Alternatively, the implementation of IPC for loads reduction can be based on fixed-frame loads (Petrović and Campagnolo, 2013), obtained by transforming rotating-frame measurements provided by strain gauges installed on the main shaft of the machine.
In this work, however, IPC has been used for controlling the nacelle orientation, thus using the so called yaw-by-IPC approach described in Navalkar et al. (2014). This control strategy exploits the yaw moment induced by an appropriate pitch control of each blade to rotate the entire rotor-nacelle assembly around the tower axis. Specifically, the yaw error Δγ between the demanded γDem and measured γMeas nacelle orientation is first low-pass filtered, so as to avoid the control system reacting to very fast fluctuations of the yaw error. The resulting signal Δγfilt is successively fed to the following proportional-integral controller
where KP,q and TI,q are the proportional and integral coefficients, while βq is the resulting cyclic pitch in the q coordinate system. Finally, the inverse Coleman transformation is used to obtain the blade pitch angles from the q frame (Bossanyi, 2003):
where ψi is the azimuth angle of each blade, which increases clockwise when looking downstream, and its null when the blade points vertically up. The total pitch angle of each blade is
where βc is the collective pitch angle computed by the power controller, and βIPC,i the individual pitch of the ith blade. Although it is possible to combine yaw-by-IPC with IPC for loads reduction (Navalkar et al., 2014), the conducted experiments focused on the verification of the effectiveness of the sole yaw-by-IPC.
2.2 The G1 Wind Turbine: Main Features, Control and Supporting Numerical Model
The machine used to perform the experiments described in this paper is the G1 scaled wind turbine, which is a three-bladed clockwise-rotating wind turbine with a rotor diameter D of 1.1 m, a rated rotor speed and power of 850 rpm and 46 W, respectively. The G1, whose internal and external layout is shown in Figure 1, has been designed so as to feature a energy conversion process and wake behavior which resemble the ones of a full-scale wind turbine (Wang et al., 2021). Moreover, the G1 has been conceived with the aim of testing modern control strategies at the turbine and farm levels (Campagnolo et al., 2016; Campagnolo et al., 2020). In this regard, the machine is equipped with individual pitch, torque and yaw actuators. Moreover, three full-bridge strain gages are installed on the rotating shaft to measure the torsional load and the two out-of-plane bending moments. Two additional full-bridge strain gages are also assembled at the tower base, so as to measure fore-aft and side-side bending moments. The main features of the G1 control system are shortly summarized in the following. For further details, the reader is referred to Bottasso and Campagnolo (2021).
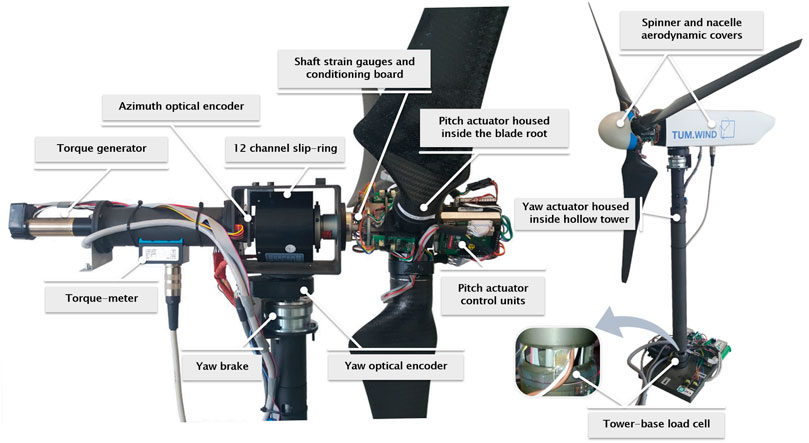
FIGURE 1. G1 internal and external layout.
2.2.1 General Features of the Control System
The wind turbine model is controlled by its own dedicated real-time modular Bachmann M1 system, implementing supervisory control functions, pitch-torque-yaw control algorithms, and all necessary safety, calibration and data logging functions. Demanded values (e.g., pitch or yaw angle references) are computed by the control algorithms and then sent to the actuators control boards, where low level control functions are performed and executed. Measurements from the sensors and commands to the actuators are transmitted via analogue and digital (mostly through CAN) communication. The Bachmann M1 system is capable of acquiring data with a sample rate of 2.5 kHz, which is used for acquiring aerodynamic torque, shaft bending moments and rotor azimuth position. All other measurements are acquired with a sample rate of 250 Hz.
The Bachmann M1 system executes the control algorithms with a sampling time of 4 ms and implements a standard power controller based on Bossanyi (2000), with two distinct control regions. Below rated wind speed, the collective blade pitch is kept constant, while the torque reference is scheduled as function of rotor speed in order to maximize power extraction. Above rated wind speed, the torque reference is kept constant, while a proportional-integral (PI) controller is used to collectively pitch the rotor blades in order to keep the generated power at the desired level. In order to accurately track the reference torque, the closed-loop torque controller based on Bottasso et al. (2014) is implemented. This torque controller computes the necessary generator current by using measurements of the shaft torsional load TS as feed-back. In this way, it is possible to guarantee that the torque at the rotor shaft matches the desired reference value, even in case of friction-induced mechanical losses caused by the nacelle bearings and the slip-ring.
Besides collective pitch control, the model is also capable of individually pitching each blade, enabling additional control actions for influencing loading and/or wakes (Campagnolo et al., 2016), or for implementing yaw-by-IPC. These control goals often come at the cost of a slight power loss below rated wind speed, depending on the pitch amplitude (Bossanyi, 2005).
On board the G1, two yaw control strategies have been been implemented to achieve a desired orientation γDem of the wind turbine rotor, which is defined positive for a counterclockwise rotation viewed from the top, and null when the turbine is perfectly aligned with the wind tunnel inflow.
Both yaw control strategies use, as feedback, measurements of the nacelle orientation provided by an optical incremental encoder (Ne = 10,000 count per revolution). Moreover, both strategies can be employed to operate the G1 either aligned or misaligned with respect to the incoming wind vector, as well as to track steady or dynamically varying yaw references. Since the wind direction in the wind tunnel is constant, a rotation of the nacelle corresponds to a misalignment of the same magnitude with respect to the incoming wind vector.
2.2.2 Yaw Control via Yaw Actuator
The first control strategy makes use of the yaw actuator located within the hollow tower of the G1. The actuator, which consists of a brushed motor coupled to a gear head with reduction ratio 246, allows to rotate the entire rotor-nacelle assembly with a maximum yaw rate
2.2.3 Yaw Control via Yaw by Individual Pitch Control
The yaw-by-IPC exploits the yaw moment induced by an appropriate pitch control of each blades. In this regard, it is important to consider the eventual cross-coupling between the fixed-frame axes due to the blade and pitch actuator dynamics (Mulders et al., 2019). As the blades of the G1 are fairly stiff, it is solely necessary to account for the effects of the eventual lag between demanded and realized pitch (Bossanyi and Witcher, 2009; Houtzager et al., 2013). Dedicated tests were therefore performed on a single G1 blade by prescribing a sinusoidal pitch reference
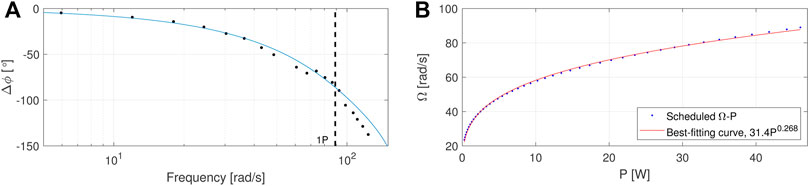
FIGURE 2. Experimental and identified response delay of the G1 pitch actuator; the dashed-black line indicates the rated rotational speed (A). Control-prescribed relationship between the rotational speed and the mechanical power at the rotor shaft, together with its best-fitting curve (B).
When the G1 operates at rated rotational speed (marked with a dashed-black line in the plot) and the pitch actuator is required to track a sinusoidal reference at 1P, the lag is significantly large (approx. 85°). To overcome this issue, an azimuth offset equal to the expected phase lag can be applied to the inverse Coleman transformation (Bossanyi and Witcher, 2009; Mulders et al., 2019), which corresponds in transforming the control-computed pitch βq,c as follow:
with Δϕ the phase lag of the best fitting TF, scheduled as function of the measured rotor speed Ω, and βq and βd the pitch inputs to the inverse Coleman transformation. The resulting individual pitch of the ith blade is the following:
Even though it would be possible to coordinate the yaw-by-IPC with the brake engagement and disengagement, the yaw brake has been always kept disengaged. This approach has been preferred in spite of the fact that it requires a continuous pitch action, even when this could be avoided if the yaw reference was constant and, therefore, engaging the brake was an option. The reason lies in the desire to test the control in more severe conditions than those expected in a real application, as well as to maximize the amount of data recorded with active yaw-by-IPC. Finally, concerning the maximum achievable yaw rate, it is limited by the maximum allowed pitch input in the d-q coordinate system, set equal to ±3°.
2.2.4 2-DOF Numerical Model
The G1 is supported by a 2-DOFs numerical model implemented in Simulink (Documentation, 2020), whose flow chart is shown in Figure 3.
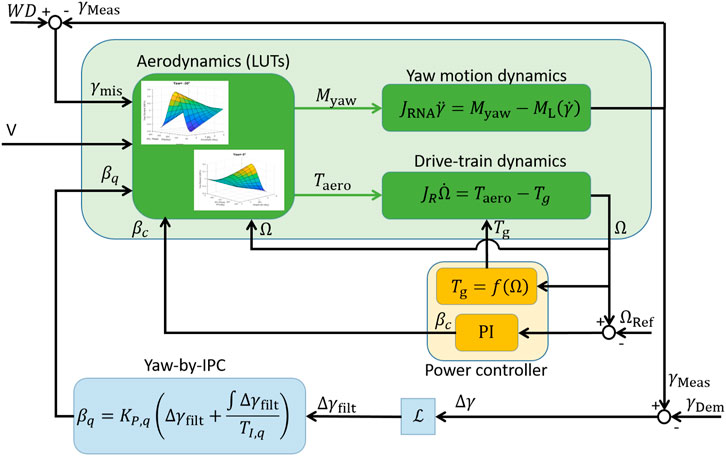
FIGURE 3. 2-DOFs numerical model of the G1 implemented in Simulink.
As the blades and tower of the G1 are fairly stiff, the numerical model neglects the impact of their flexibility, and thus solely solves the following simplified drive train dynamics
with JR the rotor inertia with respect to the rotor axis, Taero and Tg the aerodynamic and generator torque, respectively. The model also solves the following dynamics of the free-yaw motion of the rotor-nacelle assembly around the tower axis (Wanke et al., 2019)
where JRNA is the inertia of the rotor-nacelle assembly with respect to the tower axis, Myaw is the aerodynamic yaw moment around the tower axis, while ML is the frictional moment caused by the yaw bearings. As the G1 rotor is neither tilted or coned, the yaw moment only accounts for the effects of the induction variation due to the skewed inflow, of the azimuth-dependent projection of the wind speed with the yaw angle, as well as of the cyclic pitch in the q coordinate system. To simplify the model, the aerodynamic damping induced by the yawing motion was neglected.
Both aerodynamic torque and yaw moment were computed using Blade Element Momentum (BEM) theory, as implemented in Fast v8 (Jonkman and Jonkman, 2016), making use of airfoil polars that have been properly tailored in order to have a good match between experimental and numerical performance for un-yawed operations (Wang et al., 2020b). Specifically, Fast v8 simulations were carried out for several combinations of wind speed V, yaw misalignment γmis, rotor speed Ω, collective blade pitch βc and cyclic blade pitch in the q coordinate βq. The predicted aerodynamic torque and yaw moment have been stored in 5-D Lookup tables (LUTs), which are then interpolated within Simulink during the model execution. Finally, the 2-DOFs numerical model also implements the power controller described in Section 2.2.1, as well the yaw-by-IPC described in Section 2.1.
2.2.5 Rotor-Effective Wind Speed Estimation Under Yawed Conditions
The model described in Section 2.2.4 is used to compute the aerodynamic power coefficients CP for a reference air density ρref, and as a function of the wind speed, blade pitch and rotor speed. Following the approach of Schreiber et al. (2020), this relationship can be inverted, so as to derive LUTs (named
According to several studies, as those by Gebraad et al. (2016) and Gao and Hong, (2021), the steady-state power of a yawed turbine can be derived as follows
with Pγ=0 the power output that the turbine would produce if operated aligned, and PP the cosine exponent that describes the power loss due to yaw misalignment. Regardless of whether the machine operates aligned or not, the relationship between rotational speed and mechanical power at the rotor shaft, equal to P = ΩTS, is governed by the scheduled dependency between torque reference and rotor speed tracked by the power controller. Figure 2B depicts the relationship between rotational speed and mechanical power at the rotor shaft for the G1, together with the best-fitting curve based on the following equation
By combining Eqs 8, 9, it is possible to derive the following relationship
between the rotational speed of a yawed turbine and the rotational speed Ωγ=0 at which the turbine would rotate if operated aligned. Given that the relationship between torque and mechanical power at the rotor shaft is
it similarly derives that
with TS,γ=0 the expected torque at the rotor shaft if the turbine was operated aligned. The rotor effective wind speed can then be estimated as
with Taero,γ=0 the expected aerodynamic torque if the turbine was operated aligned, computed accounting for the rotor inertia JR as following
For the G1, values equal to 2.174 (Campagnolo et al., 2020) and 0.268 (see Figure 2B) were used for PP and n, respectively. Finally, this formulation allows for the estimation of the rotor-effective wind speed when the machine operates in region II. An extension of the method is also possible above rated, but has not been implemented.
2.3 The Wind Tunnel: Instrumentation and Performed Experiments
The experimental tests have been conducted at the R. Balli wind tunnel facility of the University of Perugia, where several activities regarding small horizontal-axis wind turbines have been performed in the recent years (Castellani et al., 2018). The wind tunnel layout consists of a closed loop circuit with an open test chamber; the inlet duct is 2.2 × 2.2 m, while the recovery section is 2.7 × 2.7 m. The air can reach the maximum wind speed of 48 m/s thanks to a 375 kW electric fan. An ad-hoc honeycomb grid, located just before the inlet section, mitigates the turbulence intensity of the flow, equal to 0.4%.
Figure 4 illustrates the experimental setup within the open test chamber of the wind tunnel, thus showing the wind turbine installation and the traversing system. The latter is equipped with two perpendicular sliding axes, actuated by controlled electric motors, and by a support for the hot wire anemometer. This setup allows to measure the wind speed at an user-defined grid of points and, therefore, to map the wake field downstream of the turbine, in accordance with the reference frame depicted in Figure 4B. The used single-sensor hot wire probe is managed by a Dantec streamline 90N10 Frame, while a Dantec Hotwire Calibrator, also shown in the picture, was used for the calibration of the CTA (Constant Temperature Anemometry) system. In order to improve the reliability of the measurement chain, calibrations were performed before and after each test session. Moreover, the hot wire data have been corrected for the effects of a varying temperature; to this aim, measurements provided by a thermocouple, also located on the traversing system, were used. Finally, a pitot tube, located on the right wall of the inlet duct, was used to measure the reference speed.
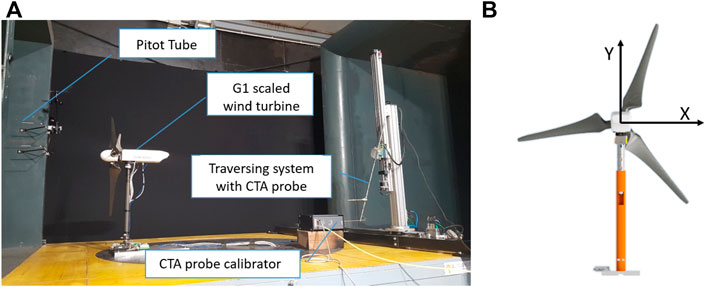
FIGURE 4. Wind tunnel setup (A); reference frame adopted for the wake measurements (B).
The blockage ratio of the experimental setup, based on the inlet duct size, is equal to approximately 13%, which would require to correct the measurements from the effects of wall blockage, especially if a reliable estimation of the power performance was needed. Despite the effects of wall blockage are not as strong as for a closed test section with similar geometry (Eltayesh et al., 2019), some of the measured quantities (e.g., loads and wake measurements) have been normalized using the rotor effective wind speed, so as to correct the data for the effects of wall blockage. For some other quantities (e.g., power and rotor speed) it was instead decided not to correct for the effects of wall blockage, as its impact is expected to be similar regardless of the tested yaw controller.
As introduced in Section 1, two types of analysis have been conducted trough wind tunnel testing:
• Performance analysis: the produced power, the yaw error, the fatigue loads and the pitch actuators usage have been measured for different steady and dynamically-varying yaw angles, as well as for steady/unsteady wind speed. This was done by first tracking a steady yaw reference (γ = ±30°, ±15°, 0°) under static or sinusoidal-varying wind speed. Second, tests were performed by demanding an unsteady yaw reference; this last test has been executed only with steady wind.
• Wake analysis: the CTA system was used to measure the flow 1.82D downstream the wind turbine, and at around 160 different points. For each point, 20 seconds of speed data were recorded. These tests have been conducted with static wind and three different steady yaw angles (γ = ±30°, 0°); this allowed studying the impact of both the considered yaw controllers on the main wake features.
3 Results
3.1 Tuning of Yaw by Individual Pitch Control
The yaw-by-IPC algorithm described in Section 2.1 requires a proper tune of the proportional and integral coefficients, as well as of the filtering to be applied to the yaw tracking error. The 2-DOFs model described in Section 2.2.4 was used for this purpose. Specifically, simulations were performed at constant wind speed and direction, but with a 10° step-wise variation of the demanded nacelle orientation. The tuning of the controller coefficients and of the filter was carried out through an optimization process based on the 2-DOFs numerical model. The optimization aimed at achieving the fastest possible response while limiting the overshoot to less then 10% of the step-wise demanded variation of the nacelle orientation.
The identified optimal values for the PI controller are KP,q = 0.25 and TI,q = 0.45 s, while a first order low-pass filter with time constant τ of 0.1 s was found to provide the best performance. The effectiveness of the resulting control strategy was finally numerically validated using, as input, time-varying demanded nacelle orientation. The simulated yaw dynamics, shown in Figure 5, confirmed that the controller parameters were properly tuned.
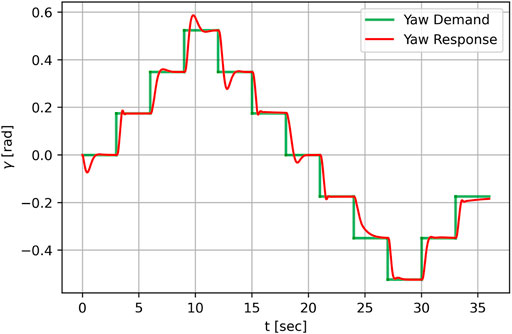
FIGURE 5. Simulated time series of the demanded and measured yaw angle with yaw-by-IPC.
3.2 Impact on the Wind Turbine Performance
Initially, we looked at the impact of the control on the machine performance, both in terms of power output, fatigue loads and actuator usage. This analysis was conducted first requiring the controller to track stationary yaw references in the range ±30°, and then providing dynamically varying yaw reference, still in the range ±30°.
3.2.1 Steady Yaw Reference
For the tests performed with steady yaw reference, experiments were conducted at both static wind speed and variable wind speed.
3.2.1.1 Static Wind Speed
Figure 6 shows several key metrics plotted as a function of the required yaw reference. Specifically, Figures 6A,B depict the mean of the measured yaw angle γMeas (a) and the standard deviation of the difference Δγ between reference and measured nacelle orientation (b), recorded while realizing the control via yaw-by-IPC. Figures 6C,D, instead, compare the average of the produced power (c) and of the rotational speed (d) recorded with the two implemented yaw controllers, with Yaw-by-Motor referring to the control realized via the yaw actuator.
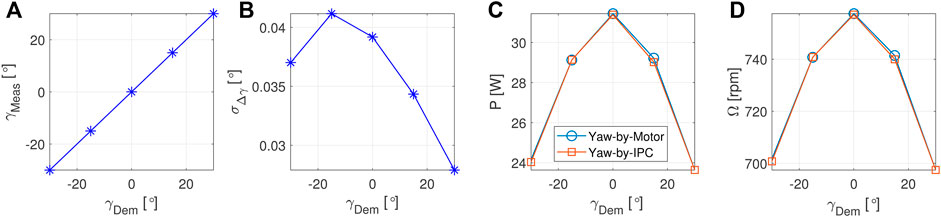
FIGURE 6. Static wind speed and yaw reference: comparison between measured and demanded yaw with yaw-by-IPC (A); standard deviation of the tracking error Δγ with yaw-by-IPC (B); power production (C) and rotor speed (D) with and without yaw-by-IPC.
From the analysis of the graphs, it is possible to appreciate how the implemented yaw-by-IPC allows the reference to be tracked with great accuracy. In fact, on average the nacelle is precisely aligned with the required direction, as well as the oscillations around the reference values are minimal. Regarding the impact on the produced power and on the rotational speed, as expected there is a clear reduction when the turbine operates misaligned with respect to the incoming wind direction. On the other side, it appears that controlling the yaw via IPC does not lead to appreciable changes.
Figure 7 shows the impact of both yaw control strategies on those fatigue loads for which measurements were available. Specifically, bending moments measured on the rotating shaft and at tower base were first filtered and corrected of the effects of minor rotor imbalances [inertial and aerodynamic, Campagnolo et al. (2020)], and later used to compute Damage Equivalent Loads (DELs). Moreover, DELs were also evaluated for the nacelle loads, derived by projecting the shaft rotating loads into a fixed axis system.
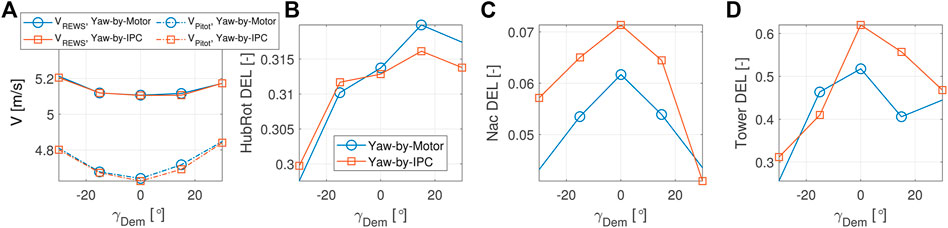
FIGURE 7. Static wind speed and yaw reference: pitot wind speed VPitot and torque-based estimation of VREWS (A); non-dimensional rotating-hub (B), nacelle (C) and tower (D) DELs with and without yaw-by-IPC.
The DELs of the combined rotating shaft (HubRot), nacelle (Nac) and tower bending moments, obtained by projecting the corresponding two orthogonal bending moments on the direction associated to the maximum DEL, are reported in Figures 7B–D. The figures depict normalized DEL, obtained dividing the DELs by
Returning to the loads, it can be seen that misaligned operations have a significant impact, especially on the DELs for non-rotating structures. In agreement with the general findings of Damiani et al. (2018), the tower fatigue loads diminish as the misalignment increases. Only for the loads on the rotating shaft, there is a modest increase for positive yaw misalignment. Concerning the impact of yaw-by-IPC, it seems to generate a non-negligible relative increase of the fatigue loads on the non-rotating structures, while a slight decrease is observed, with positive misalignment, for the fatigue loads at the rotating shaft. However, it is important to remark that the tests were conducted at very low turbulence. In this situation, the fluctuation of the aerodynamic loads due to the blade pitching has a greater impact than what could be expected if the tests were performed in a boundary layer wind tunnel. In such a case, indeed, the fatigue loads induced by turbulence and shear would be far more significant, in absolute terms, than those measured in low-turbulence conditions. The increase in damage due to blade pitching could therefore have a rather milder relative impact than the one reported in Figures 7C,D.
Figure 8 presents key metrics concerning the pitch activity recorded while testing with yaw-by-IPC. Specifically, Figure 8A compares the pitch of the three blades measured during the test conducted with γ = 30 [°]. The figure shows how the three blades pitch are offset by 120°, as expected. Figure 8B instead presents, as function of the yaw reference, the mean of the measured pitch in the d-q coordinates. The bars added to each point show the range of values within two standard deviations from the mean. As expected, βd is close to null, with the minor observed pitch action for γ = ±15° that can be attributed to the small deviations between the actual and modelled actuator dynamics (see Figure 2). On the other side, positive and negative βq are observed for negative and positive yaw misalignment, respectively. This phenomenon has an aerodynamic explanation. When the turbine is yawed by γ = 30°, the left side (ψ = 270°) of the rotor moves upstream, while the right side (ψ = 90°) moves downstream. This tends to increase the angle of attack, and thus the aerodynamic loads, of the left side of the rotor, due to the blade moving into the higher-speed induction zone of the rotor (see Burton et al., 2011, chap 4). The opposite, instead, happens for the right side of the rotor. This results in a restoring moment, which is compensated by increasing the pitch on the left side and by decreasing the pitch on the right side, thus resulting in a negative value of βq. The analysis is similar for the other yaw direction (γ = −30°), and it results in a positive value of βq. Interestingly, similar observations have been derived by Wang et al. (2020a) while testing individual pitch control algorithms for load reductions.
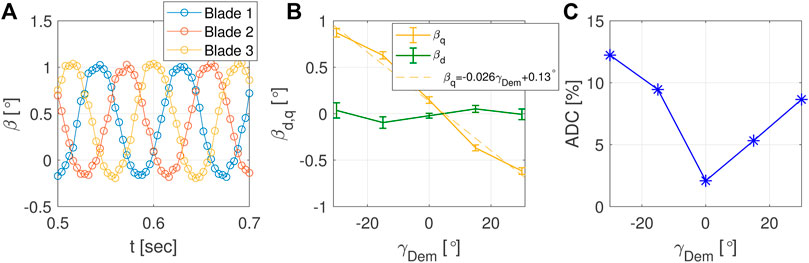
FIGURE 8. Static wind speed and yaw reference: blade pitch with yaw-by-IPC and γ = 30 [°] (A); mean, and range of values within two standard deviations, of the pitch inputs in the d-q coordinate system (B); blade pitch actuator duty cycle with yaw-by-IPC (C).
Concerning the zero yaw case, the small non-zero βq can be caused by the presence of a modest horizontal wind shear, which can be attributed to the asymmetric effects of the wind tunnel wall blockage (Eltayesh et al., 2019). Once corrected the data for this non-zero βq, there is a fairly symmetric trend, as shown by the best-fitting dashed-line included in the plot. Small deviations from the linear trend are only visible for γ = ±15°, which, similarly to what observed for βd, can be attributed to the minor inconsistencies associated with the modeling of the actuator dynamics. Finally, the deviations of both βd and βq from the mean value is quite small.
Figure 8C, finally, reports the variation of the pitch actuators duty cycle (ADC) (Bottasso et al., 2013) as function of the yaw reference, with
and
Tests were subsequently carried out imposing a sinusoidal variation on the wind speed in the wind tunnel. Specifically, the rotational speed of the fan was controlled so as to get a wind speed fluctuating at a frequency of 0.1 Hz, and of about 0.5 m/s around the average value of 4.82 m/s. Although these tests are not representative of the fast turbulence-induced fluctuations in wind speed and direction that occur in the field, they provide a first indication of the robustness of the control in unsteady wind conditions.
Figure 9 shows again, plotted as a function of the required yaw reference, many of the key metrics already discussed in the previous Section 3.2.1. Overall, the conclusions that can be derived from the analysis of the various plots are similar. Once again, the yaw control performed by yaw-by-IPC allows to properly track the reference with modest oscillations. However, the oscillations turn out to be twice as high as observed during the tests conducted with steady wind speed. It is reasonable to assume that this increase, qualitatively expected, can be significantly greater in turbulent conditions, as highlighted by Navalkar et al. (2014). Moreover, no effect of yaw-by-IPC on the power output is found, indicating that the moderate sinusoidal variation of the pitch angles has modest effects on the aerodynamic efficiency of the rotor. As for the loads, the trends are again quite similar to those shown with steady wind speed, especially for the fatigue loads on the rotating hub. Concerning the loads on the non-rotating structures, there is a greater relative impact of yaw-by-IPC on nacelle loads, while the impact on tower loads is less homogeneous, although there is a tendency towards an increase. Finally, the recorded pitch action well resembles the one observed with steady wind, both in terms of actuator usage and measured pitch in the d-q coordinates. This last aspect is particularly relevant, since it shows that the cyclic pitch remains nearly constant as the wind speed varies. For wind speeds lower than rated, in fact, the rotor kinematics remain unchanged, from which derives also an invariability of the cyclic pitch necessary to keep the rotor misaligned of the desired amount.
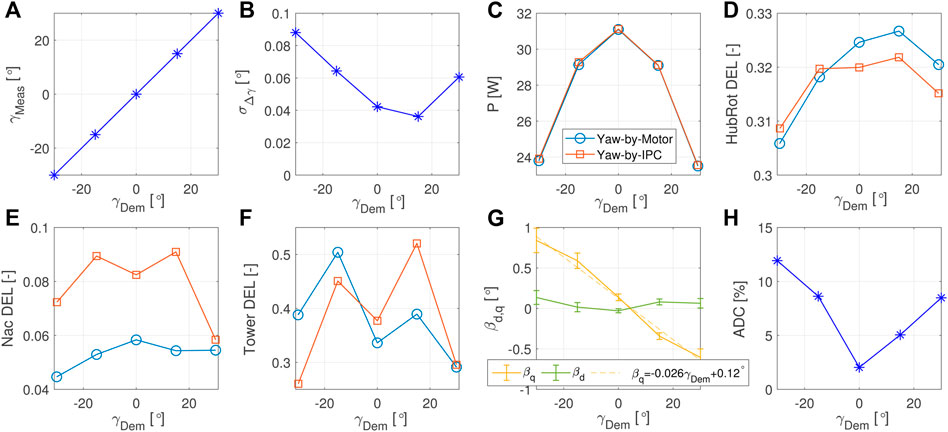
FIGURE 9. Sinusoidal-varying wind speed with steady yaw reference: comparison between measured and demanded reference with yaw-by-IPC (A) and standard deviation of the tracking error Δγ (B); power production (C), non-dimensional rotating-hub (D), nacelle (E) and tower (F) DELs with and without yaw-by-IPC; mean, and range of values within two standard deviations, of the pitch inputs in the d-q coordinate system (G); blade pitch actuator duty cycle with yaw-by-IPC (H).
3.2.2 Dynamically Varying Yaw Reference
Once analyzed the performance of the control with steady yaw references, the next step aimed at assessing the response of the control with quickly varying references. Such a situation can arise, for example, when wake steering by yawing is used to boost the power produced by a wind farm exposed to unsteady inflow conditions. Under these conditions, indeed, quick variations of the wind direction may induce a rapid change of the demanded yaw offset, whose tracking would require an equally fast modification of the nacelle orientation. It was therefore decided to track, as a reference, the signal shown in Figure 10A, which comes from a recent experiment, conducted in a boundary layer wind tunnel described in Campagnolo et al. (2020). This experiment aimed at assessing the effectiveness of wake steering by yawing under realistic dynamic wind direction changes. As a consequence, also the reference yaw signal can be considered as a realistic implementation of the typical yaw settings that a full-scale wind turbine could be required to track.
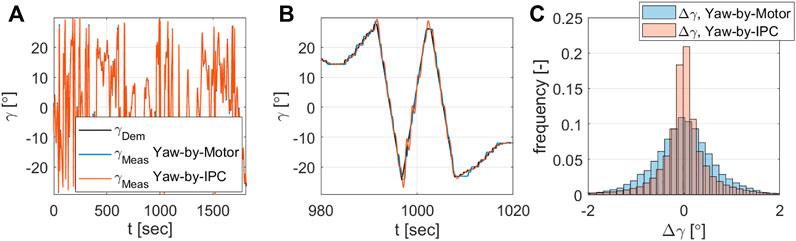
FIGURE 10. Dynamically varying yaw reference: overall (A) and zoomed-in (B) time histories of the demanded yaw reference, and of the measured yaw with and without yaw-by-IPC; distribution of the tracking error Δγ with and without yaw-by-IPC (C).
The test duration was 30 min, which corresponds to 40 h once scaled back at full-scale (Campagnolo et al., 2020). Figure 10B shows a zoomed-in comparison of the reference signal and the measured yaw. As one might note, both controls allow the reference to be tracked with very good precision. Although this result is largely expected when the control is performed with the yaw actuator, the performance of yaw-by-IPC is remarkable. Indeed, the latter is able to track the reference even slightly better, as shown by the comparison of the tracking error distributions, illustrated in Figure 10C. The tracking error for yaw-by-IPC, indeed, is more frequently closer to 0° than with the control performed with the yaw actuator. This could be due to the limitation imposed on the yaw rate, applied to the control realized with the yaw actuator but not to the yaw-by-IPC, rather than to the backlash of the yaw actuator gear, which deteriorates the reference tracking. Yet overall, for both control strategies the tracking error very seldom exceeded 2°.
In order to further highlight the performance of yaw-by-IPC, Figure 11A shows the zoomed-in time histories of the yaw reference and of βq. It may be noted that the pitch varies oppositely to the reference. To a negative value of the required yaw, in fact, tends to correspond a positive value of βq. This is evident also in Figure 11B, which shows the mean of the pitch in d-q coordinates as a function of the demanded yaw, as well as the range of values within two standard deviations from the mean. To reduce noise, the plot depicts average values according to yaw reference bins with a width of 5°. Overall, the trend is almost similar to the one observed for the experiments performed with stationary yaw reference (see Figures 8B, 9G), but with some differences. In fact, the pitch action in the q-coordinate is slightly increased, as indicated by the higher slope of the interpolating line. This seems to indicate that an higher amount of cyclic pitch is required, on average, to keep the turbine yawed to the desired position. This could be related to the aerodynamic damping associated to yawing maneuver, which counteracts the yaw motion (Wanke et al., 2019), or even to other dynamic effects which should be further investigated. Moreover, the deviations of βq from its mean values are far more significant that what observed for steady yaw references. This is definitely expected, as additional moment must be produced to accelerate and decelerate the entire rotor-nacelle assembly. On average, it appears that a cyclic pitch βq approximately equal to half degree is the maximum amount of pitch actuation that is needed for this purpose, independently of the required yaw reference.
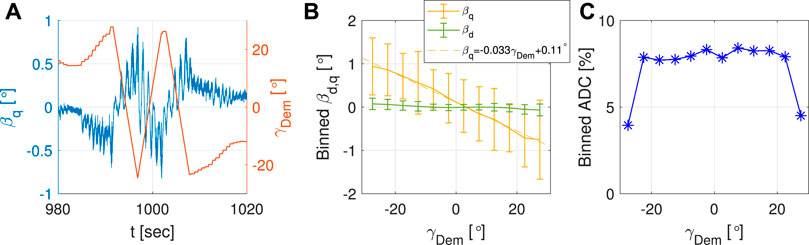
FIGURE 11. Dynamically varying yaw reference: zoomed-in time histories of the cyclic pitch βq and of the measured yaw with yaw-by-IPC (A); mean, and range of values within two standard deviations, of the pitch inputs in the d-q coordinate system, binned as function of the demanded yaw reference (B); blade pitch actuator duty cycle with yaw-by-IPC, binned as function of the demanded yaw reference (C).
Finally, Figure 11C depicts the average values of the pitch actuator duty cycle, binned according to yaw reference bins. Differently that what observed for the steady yaw reference cases, the usage of the pitch actuator is more uniform. This can be attributed to the extra pitch demand necessary for accelerating and decelerating the entire rotor-nacelle assembly which, as discussed before, does appear to be independent from the demanded yaw reference.
3.3 Impact on the Shed Wake
Once assessed the impact of yaw-by-IPC on the performance, the wake 1.82D downstream of the rotor was measured with a hot-wire probe, with the aim of understanding the effect of yaw-by-IPC on the shed wake. Specifically, the wake was mapped, while realizing the yaw control both with the yaw actuator and yaw-by-IPC, for three different yaw misalignments (γ = −30°, 0°, and 30°). In total, wake measurements were then performed for six different operating conditions.
3.3.1 Wake Measurements
The wake has been sampled at several points distributed along 18 uniformly-spaced radial lines. In order to correct the measured data from the effects of wall blockage, normalized wake velocities
Figure 12 shows the resulting wake mappings, derived by interpolating biharmonic splines to the normalized velocities measured at the locations marked by the black squares. The lower and upper plots show the mappings for the yaw control realized using the yaw actuator and yaw-by-IPC, respectively. Unfortunately, due to the limitations imposed by the traversing system, the wakes were not fully mapped, specially for the γ = 30° cases. However, it was deemed that the collected data were sufficient to conduct the analyses discussed in the next sections.
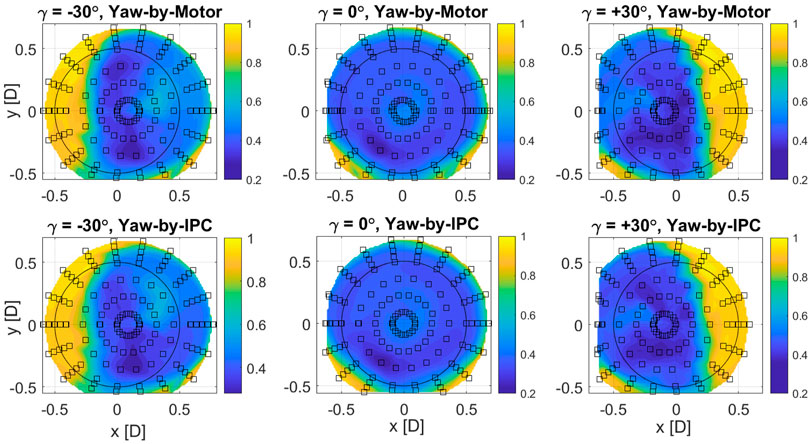
FIGURE 12. Non dimensional wake speed
3.3.2 Wake Comparisons
Figure 13 reports, for the −30° (left plot), 0° (middle plot) and 30° (right plot) yaw misalignment cases, the comparison between the wake velocity profiles at hub height without (IPC off) and with (IPC on) yaw-by-IPC. The error bars within the plot show the measurement uncertainty, estimated as in Section 3.3.1. Looking at the yawed cases, it is possible to appreciate the induced wake deflection. The wake, indeed, is shifted toward right or left (when looking upstream) if the turbine is negatively or positively misaligned, respectively.
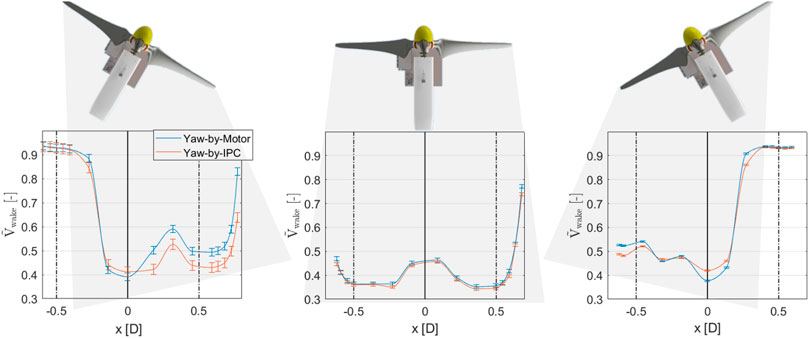
FIGURE 13. Comparison between the non dimensional wake speed
Looking at the profiles for γ = 30°, it appears that yaw-by-IPC decelerates the flow in the wake area located downstream of the leeward side of the rotor. On the contrary, a slight acceleration of the flow is noticed downstream of the windward side. This effect is proportional to the pitch amplitudes βq, and can be explained as follows. Without yaw-by-IPC, the leeward side of the rotor experiences lower angle of attacks, and thus lower loads, than the windward side. When the yaw-by-IPC is activated, the pitch on the leeward side decreases, as explained in Section 3.2.1, hence the wake section immediately behind decelerates as a result of the higher axial induction. This effect is partially visible also in the γ = −30° case. In fact, a slight acceleration of the flow can be seen in the area immediately behind the windward side of the rotor, while only a trace of deceleration is visible when looking at leeward side. The incomplete mapping of the left side of the wake, in fact, does not permit to fully compare the wake profiles in this area. As for γ = 0°, the observed differences are only marginal and within the range of the measurement uncertainty. In this case, in fact, the cyclic pitch required by yaw-by-IPC is rather low (just a little more than 0.1°), resulting in a very limited effect on the wake. Once more, similar observations have been also noticed by Wang et al. (2020a) while testing IPC for load reductions applied to a yawed G1.
3.3.3 Impact on the Available Wind Power
Figure 14 shows the difference in the normalized wake speed between yaw-by-IPC and yaw by geared actuation. As shown before, yaw-by-IPC generates an acceleration close to the windward side of the rotor and a deceleration close to its leeward side. As the wake, during its propagation, swirls clockwise when looking upstream, the acceleration and deceleration regions are convected clockwise around the wake center. Such an effect is highlighted by the high-speed (blue-purple) bubbles present in the γ = ±30° plots, which indeed result clockwise rotated from the leeward side of the rotor.
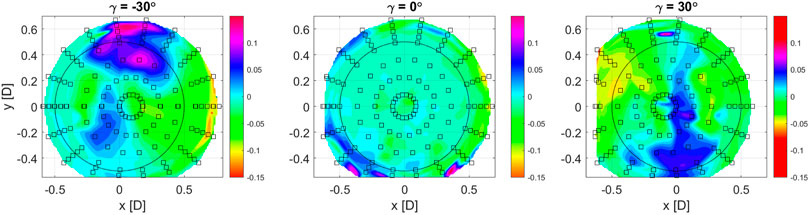
FIGURE 14. Difference
The differences between the velocity fields with and without yaw-by-IPC produce changes in the available wind power at a downstream turbine. In this regard, the available wind power was calculated by assuming that another G1, aligned with the upstream machine, was placed at the location where the wake measurements were taken. The resulting variation of the available power is +0.85%, −0.5% and +1.34% for the −30°, 0° and 30° yaw cases, respectively. Based on these results, the use of yaw-by-IPC on the upstream turbine is expected to have a positive effect on the power of the downstream turbine for γ = ±30°, while it should have a negative effect for γ = 0°.
It is important to stress that these results apply to the specific environmental conditions of the tests, i.e., very low turbulence, and with the assumption of a second rotor placed only 1.82D downstream from the upper one. However, similar results were observed by Wang et al. (2020a) while testing IPC for loads reduction applied to a yawed G1 under turbulence conditions typical of offshore environments, and with a longitudinal spacing between the turbines of 5D.
3.4 Expected Impact of Inflow Turbulence on Yaw by Individual Pitch Control Performance
One of the main limitations of the experiment presented in this paper is the fact that tests were conducted in an environment characterized by almost zero turbulence. This condition, indeed, is not realistic. In order to provide an estimate of the performance of the yaw-by-IPC under turbulent inflow conditions, the data obtained during test campaigns carried out with two G1s in a boundary layer wind tunnel were analyzed.
First, an attempt was made to estimate, using the experimental data measured at zero turbulence, the aerodynamic moment generated by the cyclic pitch βq. Figure 15A depicts the relationship between the average yawing moment Myaw, normalized with
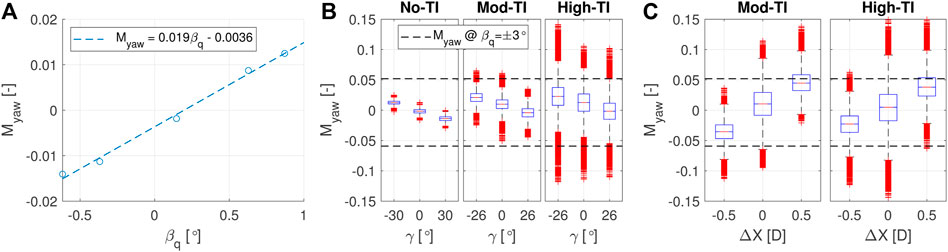
FIGURE 15. Relationship between the normalized average of the nacelle yawing moment and the cyclic pitch βq (A). Summary statistic of the normalized nacelle yawing moment for a G1 operating in free-stream conditions and with laminar (No-TI), moderately turbulent (Mod-TI) and highly turbulent (High-TI) inflows (B). Summary statistic of the normalized nacelle yawing moment for a G1 operating in waked conditions and with moderately turbulent (Mod-TI) and highly turbulent (High-TI) inflows (C).
Figure 15B, instead, shows the statistics of Myaw, evaluated using the boxplot function of Matlab (MATLAB, 2020). For each box, the central mark indicates the median, while the bottom and top edges the 25th and 75th percentiles, respectively. Moreover, the whisker extension defines 99.3% of the data, and the remaining outliers are marked with red crosses. The figure reports data measured by a G1 operating in free-stream and at three different values of yaw misalignment, with the three subplots corresponding to different inflow conditions characterized by wind speed lower than rated. Specifically, the figure depicts data gathered in the wind tunnel of the University of Perugia with zero turbulence (No-TI), as well as data measured in the wind tunnel of the Politecnico di Milano by simulating two different atmospheric boundary layers (Göçmen et al., 2022): one characterized by a turbulence of 6% and a vertical shear best-fitted by a power law with exponent α = 0.14 (Mod-TI), and a second one with turbulence 13% and α = 0.21 (High-TI). Finally, the figure also depicts the yaw moments that can be achieved with a cyclic pitch of ±3°, i.e., the maximum allowed cyclic pitch input for the G1 (see Section 2.2.3). These moments were estimated using the linear approximation of Figure 15A.
An in-depth analysis of the figure reveals several aspects of interest. First, it is again noted that the moment changes linearly with yaw misalignment, regardless of the level of turbulence in the upstream flow. However, it can be seen that, under null misalignment conditions, the moment increases with vertical shear (Myaw is defined positive in agreement with the reference frame of Figure 4B). The presence of a vertical speed gradient caused by the shear, indeed, implies that blade section conditions are different for the top and bottom parts of the rotor, resulting in different sectional aerodynamic forces. Specifically, the distribution of the sectional in-plane propulsive force is non-symmetric with respect to the vertical axis, which has the effect of generating a small non-zero net lateral force resultant. In addition, it can be seen that the moment fluctuations increase with turbulence. A more turbulent flow, in fact, leads to a higher probability of having a remarkable, despite instantaneous, horizontal shear on the rotor, which in turn results in a marked asymmetry of the out-of-plane aerodynamic forces between the left and right side of the rotor. Under turbulent conditions, therefore, keeping the nacelle aligned along the desired direction will require the yaw-by-IPC to compensate for a larger aerodynamic yaw moment than under laminar flow conditions. In the case of flow characterized by 6% turbulence (typical of offshore environments) and wind speed lower than rated, it appears that a cyclic pitch of ±3° is sufficient to compensate, at least in 99.3% of cases, for the aerodynamic yaw moment, and therefore yaw-by-IPC should have sufficient control authority to keep the machine well aligned along the desired direction, as also shown by Eguinoa et al. (2017). Particularly, a quite low average cyclic pitch should be necessary to keep the turbine 30° misaligned, as indicated by the corresponding average value of Myaw, which is indeed close to zero. For larger inflow turbulence, typical of onshore environments, the yaw-by-IPC appears to be capable of generating the necessary moment only for positive yaw misalignment, and thus may not be the most suitable approach in this environment.
Finally, Figure 15C shows the statistics of Myaw measured by a G1 operating with null yaw misalignment, but in waked conditions. Specifically, the figure depicts data gathered again in the wind tunnel of the Politecnico di Milano with a tandem of two G1s placed 5D apart along the longitudinal directions. Moreover, the downstream G1 was located in line with the upstream machine (ΔX = 0), as well as laterally shifted of ±0.5D (ΔX = 0 is defined positive in agreement with the reference frame of Figure 4B). It can be appreciated that operating in partial wake conditions (ΔX = ±0.5D) implies having the rotor immersed in a highly spatially in-homogeneous flow, thus resulting in particularly strong average yawing moments. It can be noted, again, that the fluctuations in full or partial wake conditions are greater than those observed in free-stream. This effect is due to the greater turbulence of the flow within the wake, as well as to the effects of wake meandering. Overall, it is evident that a cyclic pitch of ±3° would not be able to yield sufficient moment to offset the aerodynamic loads, thereby making the yaw-by-IPC unsuitable for handling the yaw of waked machines.
4 Conclusion
The objective of the present study has been an in depth experimental characterization of the yaw by Individual Pitch Control. The general motivation of this study is that the active yaw control is the keystone for implementing wake steering, in order to optimize the balance between wind farm power production and loads. In this context, the yaw-by-IPC can constitute a valid alternative to the use of yaw actuators, so as to decrease their usage.
On these grounds, this study has been organized as an experimental comprehensive comparison between yaw-by-IPC and yaw by geared actuation. The experiments have been performed at the R. Balli wind tunnel of the University of Perugia on a fully instrumented wind turbine scaled model, named G1, which has been developed for research purposes by the Technical University of Munich. The operation behavior of the G1 has been characterized in terms of yaw tracking capabilities and impact on power, fatigue loads and actuators usage. The wake has been characterized at 1.82 rotor diameters downstream by measuring the wind flow through a hot wire traversing system.
As wake steering is conceived for being mainly applied at wind speed lower than rated, the tests have been conducted accordingly. The general conclusions of this study, performed under laminar inflow conditions, are summarized in the following:
• Using yaw-by-IPC does not lead to additional power losses with respect to yaw control via geared actuation. Therefore, yaw-by-IPC appears promising for wake steering, as the power production is not further affected.
• The fatigue loads induced by yaw-by-IPC on the considered sub-components are close to the ones observed with the classic yaw control. However, moderately higher fatigue is observed for the fixed-frame loads.
• Yaw-by-IPC comes at a price of an increased pitch activity. This last, however, is moderate, since the resulting actuator duty cycle (ADC) does not exceed 10–12%.
• Using yaw-by-IPC allows to follow very well the demanded yaw reference, even with a slight improvement in the case of dynamically-varying yaw set point.
• In order to induce a stabilizing yawing moment, the yaw-by-IPC slightly increases the pitch of the windward side of a yawed rotor, thus resulting in a lower local axial induction. The opposite is observed for the leeward side. This locally affects the speed in the wake, as indicated by the flow measurements performed 1.82 diameter downstream of the rotor. A small reduction of the wake losses for large requested yaw misalignment (±30°) is indeed observed, which could lead to an increase of the power produced by a downstream machine. For null yaw misalignment, instead, the wake losses are slightly higher with yaw-by-IPC.
In order to provide indications on the expected behavior of yaw-by-IPC under more realistic inflow conditions, the experimental data obtained with laminar inflow have been compared with those obtained by testing a cluster of two G1s in a boundary layer wind tunnel. It turns out that yaw-by-IPC should enable an accurate tracking of the desired nacelle direction if the machine operates in free-stream and in moderately turbulent inflow conditions, e.g., those typical of offshore environments. On the contrary, the use of yaw-by-IPC is not suitable to control a machine operating in waked or, in general, highly turbulent inflow conditions. In both cases, in fact, the high spatial and temporal non-uniformity of the inflow induces an aerodynamic yaw moment, around the tower axis, that cannot be compensated by a limited cyclic pitch action of ±3°.
The results collected in this work therefore indicate the yaw-by-IPC as a valid alternative to standard yaw actuation, which could profitably be integrated in active wind farm controls depending substantially on the requested yaw reference and the local inflow conditions. This should motivate further studies on the subject, including both the development and testing of more advanced control algorithms, which could enable even a better tracking of the yaw reference, as well as the testing of yaw-by-IPC on full-scale industrial wind turbines and in real-world complex environments. In general, it should be noticed that the behavior of the blade pitch is a critical aspect of horizontal-axis wind turbines, which affects non-negligibly the performance (Castellani et al., 2021); therefore, the research on this multi-faceted topic should be encouraged.
Data Availability Statement
The raw data supporting the conclusion of this article will be made available, upon requests and without undue reservation, by the authors.
Author Contributions
FiC and FrC conceived and managed the research, performed the experimental tests, analyzed and interpreted the results, wrote the manuscript; FN contributed to the experimental tests; DA wrote the manuscript. FM co-implemented the yaw-by-IPC onboard the G1 control system and contributed to the analysis of the experimental results. All authors provided important input to this research work through discussions and feedback, as well as by improving the manuscript.
Conflict of Interest
The authors declare that the research was conducted in the absence of any commercial or financial relationships that could be construed as a potential conflict of interest.
Publisher’s Note
All claims expressed in this article are solely those of the authors and do not necessarily represent those of their affiliated organizations, or those of the publisher, the editors and the reviewers. Any product that may be evaluated in this article, or claim that may be made by its manufacturer, is not guaranteed or endorsed by the publisher.
Acknowledgments
The authors thank Dr. Matteo Becchetti, Mattia Belfico, and Ylenia Ollargiu for the technical support.
References
Andersen, S. J., Breton, S.-P., Witha, B., Ivanell, S., and Sørensen, J. N. (2020). Global Trends in the Performance of Large Wind Farms Based on High-Fidelity Simulations. Wind Energy Sci. 5, 1689–1703. doi:10.5194/wes-5-1689-2020
Bak, C., Zahle, F., Bitsche, R., Kim, T., Yde, A., Henriksen, L. C., et al. (2013). “The Dtu 10-mw Reference Wind Turbine,” in Danish Wind Power Research 2013.
Bastankhah, M., and Porté-Agel, F. (2016). Experimental and Theoretical Study of Wind Turbine Wakes in Yawed Conditions. J. Fluid Mech. 806, 506–541. doi:10.1017/jfm.2016.595
Bastankhah, M., and Porté-Agel, F. (2019). Wind Farm Power Optimization via Yaw Angle Control: A Wind Tunnel Study. J. Renew. Sustain. Energy 11, 023301. doi:10.1063/1.5077038
Bossanyi, E. A. (2000). The Design of Closed Loop Controllers for Wind Turbines. Wind Energy 3, 149–163. doi:10.1002/we.34
Bossanyi, E. A. (2003). Individual Blade Pitch Control for Load Reduction. Wind Energy 6, 119–128. doi:10.1002/we.76
Bossanyi, E. A. (2005). Further Load Reductions with Individual Pitch Control. Wind Energy 8, 481–485. doi:10.1002/we.166
Bossanyi, E. (2019). Optimising Yaw Control at Wind Farm Level. J. Phys. Conf. Ser. 1222, 012023. doi:10.1088/1742-6596/1222/1/012023
Bossanyi, E., and Witcher, D. (2009). Controller for 5mw Reference Turbine. Brussels: European Upwind Project Report.
Bottasso, C. L., Campagnolo, F., Croce, A., and Tibaldi, C. (2013). Optimization-based Study of Bend–Twist Coupled Rotor Blades for Passive and Integrated Passive/active Load Alleviation. Wind Energy 16, 1149–1166. doi:10.1002/we.1543
Bottasso, C. L., and Campagnolo, F. (2021). Handb. Of Wind Energy Aerodyn. Cham: Springer. chap. Wind Tunnel Testing of Wind Turbines and Farms.
Bottasso, C. L., Campagnolo, F., and Petrović, V. (2014). Wind Tunnel Testing of Scaled Wind Turbine Models: Beyond Aerodynamics. J. wind Eng. industrial aerodynamics 127, 11–28. doi:10.1016/j.jweia.2014.01.009
Burton, T., Jenkins, N., Sharpe, D., and Bossanyi, E. (2011). The Wind Energy Handbook. Chichester, United Kingdom: John Wiley & Sons. doi:10.1002/9781119992714
Campagnolo, F., Petrović, V., Bottasso, C. L., and Croce, A. (2016). “Wind Tunnel Testing of Wake Control Strategies,” in American Control Conference (ACC), 2016 (IEEE), 513. doi:10.1109/acc.2016.7524965
Campagnolo, F., Weber, R., Schreiber, J., and Bottasso, C. L. (2020). Wind Tunnel Testing of Wake Steering with Dynamic Wind Direction Changes. Wind Energy Sci. 5, 1273–1295. doi:10.5194/wes-5-1273-2020
Castellani, F., Astolfi, D., Becchetti, M., Berno, F., Cianetti, F., and Cetrini, A. (2018). Experimental and Numerical Vibrational Analysis of a Horizontal-axis Micro-wind Turbine. Energies 11, 456. doi:10.3390/en11020456
Castellani, F., Eltayesh, A., Becchetti, M., and Segalini, A. (2021). Aerodynamic Analysis of a Wind-Turbine Rotor Affected by Pitch Unbalance. Energies 14, 745. doi:10.3390/en14030745
Damiani, R., Dana, S., Annoni, J., Fleming, P., Roadman, J., van Dam, J., et al. (2018). Assessment of Wind Turbine Component Loads under Yaw-Offset Conditions. Wind Energy Sci. 3, 173–189. doi:10.5194/wes-3-173-2018
[Dataset] Documentation, S. (2020). Simulation and Model-Based Design. Portola Valley, CA: MathWorks Inc company. Available at: https://www.mathworks.com/help/simulink/
Doekemeijer, B. M., Kern, S., Maturu, S., Kanev, S., Salbert, B., Schreiber, J., et al. (2021). Field Experiment for Open-Loop Yaw-Based Wake Steering at a Commercial Onshore Wind Farm in italy. Wind Energy Sci. 6, 159–176. doi:10.5194/wes-6-159-2021
[Dataset] Eguinoa, I., Astràin, D., Bossanyi, E., Mulders, S., van Wingerden, J.-W., Kanev, S., et al. (2017). Minimal Loading Wind Turbine De-rating Strategy and Active Yaw Controllers, cl-windcon deliverable d2.1. Available at: http://www.clwindcon.eu/wp-content/uploads/2017/03/CL-Windcon-D2.1-Wind-turbine-controllers.pdf,CL-Windcon
Eltayesh, A., Hanna, M. B., Castellani, F., Huzayyin, A. S., El-Batsh, H. M., Burlando, M., et al. (2019). Effect of Wind Tunnel Blockage on the Performance of a Horizontal axis Wind Turbine with Different Blade Number. Energies 12, 1988. doi:10.3390/en12101988
Fleming, P., Annoni, J., Shah, J. J., Wang, L., Ananthan, S., Zhang, Z., et al. (2017). Field Test of Wake Steering at an Offshore Wind Farm. Wind Energy Sci. 2, 229–239. doi:10.5194/wes-2-229-2017
Fleming, P. A., Scholbrock, A. K., Jehu, A., Davoust, S., Osler, E., Wright, A. D., et al. (2014). Field-test Results Using a Nacelle-Mounted Lidar for Improving Wind Turbine Power Capture by Reducing Yaw Misalignment. J. Phys. Conf. Ser. 524, 012002. doi:10.1088/1742-6596/524/1/012002
Fleming, P., Churchfield, M., Scholbrock, A., Clifton, A., Schreck, S., Johnson, K., et al. (2016). Detailed Field Test of Yaw-Based Wake Steering. J. Phys. Conf. Ser. 753, 052003. doi:10.1088/1742-6596/753/5/052003
Fleming, P., King, J., Dykes, K., Simley, E., Roadman, J., Scholbrock, A., et al. (2019). Initial Results from a Field Campaign of Wake Steering Applied at a Commercial Wind Farm - Part 1. Wind Energy Sci. 4, 273–285. doi:10.5194/wes-4-273-2019
Fleming, P., King, J., Simley, E., Roadman, J., Scholbrock, A., Murphy, P., et al. (2020). Continued Results from a Field Campaign of Wake Steering Applied at a Commercial Wind Farm - Part 2. Wind Energy Sci. 5, 945–958. doi:10.5194/wes-5-945-2020
Gao, L., and Hong, J. (2021). Data-driven Yaw Misalignment Correction for Utility-Scale Wind Turbines. J. Renew. Sustain. Energy 13, 063302. doi:10.1063/5.0056671
Gebraad, P. M., Fleming, P. A., and van Wingerden, J.-W. (2015). “Comparison of Actuation Methods for Wake Control in Wind Plants,” in 2015 American Control Conference (ACC) (IEEE), 1695–1701. doi:10.1109/acc.2015.7170977
Gebraad, P. M. O., Teeuwisse, F. W., Van Wingerden, J. W., Fleming, P. A., Ruben, S. D., Marden, J. R., et al. (2016). Wind Plant Power Optimization through Yaw Control Using a Parametric Model for Wake Effects-A CFD Simulation Study. Wind Energy 19, 95–114. doi:10.1002/we.1822
Göçmen, T., Campagnolo, F., Duc, T., Eguinoa, I., Andersen, S. J., Petrović, V., et al. (2022). Farmconners Wind Farm Flow Control Benchmark: Blind Test Results. Wind Energy Sci. Discuss. 2022, 1–69. doi:10.5194/wes-2022-5
Houtzager, I., van Wingerden, J. W., and Verhaegen, M. (2013). Wind Turbine Load Reduction by Rejecting the Periodic Load Disturbances. Wind Energy 16, 235–256. doi:10.1002/we.547
Jonkman, B., and Jonkman, J. (2016). Fast V8. 16.00 A-Bjj. Golden, CO: National Renewable Energy Laboratory.
Jonkman, J., Butterfield, S., Musial, W., and Scott, G. (2009). Definition of a 5-MW Reference Wind Turbine for Offshore System Development. Tech. Rep. Golden, CO (United States): National Renewable Energy Lab.NREL.
Kanev, S. (2020). Dynamic Wake Steering and its Impact on Wind Farm Power Production and Yaw Actuator Duty. Renew. Energy 146, 9–15. doi:10.1016/j.renene.2019.06.122
Levy, E. C. (1959). Complex-curve Fitting. IRE Trans. Autom. Contr. AC-4, 37–43. doi:10.1109/tac.1959.6429401
Mulders, S. P., Pamososuryo, A. K., Disario, G. E., and Wingerden, J.-W. v. (2019). Analysis and Optimal Individual Pitch Control Decoupling by Inclusion of an Azimuth Offset in the Multiblade Coordinate Transformation. Wind Energy 22, 341–359. doi:10.1002/we.2289
Navalkar, S. T., Van Wingerden, J. W., and Van Kuik, G. A. M. (2014). Individual Blade Pitch for Yaw Control. J. Phys. Conf. Ser. 524, 012057. doi:10.1088/1742-6596/524/1/012057
Petrović, V., and Campagnolo, F. (2013). “Experimental Validation of Wind Turbine Higher Harmonic Control Using Shaft Loads Measurements,” in 2013 European Control Conference (ECC) (IEEE), 472. doi:10.23919/ecc.2013.6669709
Schreiber, J., Bottasso, C. L., and Bertelè, M. (2020). Field Testing of a Local Wind Inflow Estimator and Wake Detector. Wind Energy Sci. 5, 867–884. doi:10.5194/wes-5-867-2020
Simley, E., Fleming, P., Girard, N., Alloin, L., Godefroy, E., and Duc, T. (2021). Results from a Wake-Steering Experiment at a Commercial Wind Plant: Investigating the Wind Speed Dependence of Wake-Steering Performance. Wind Energy Sci. 6, 1427–1453. doi:10.5194/wes-6-1427-2021
Soleimanzadeh, M., Wisniewski, R., and Kanev, S. (2012). An Optimization Framework for Load and Power Distribution in Wind Farms. J. Wind Eng. Industrial Aerodynamics 107-108, 256–262. doi:10.1016/j.jweia.2012.04.024
Sørensen, J. N., Mikkelsen, R. F., Henningson, D. S., Ivanell, S., Sarmast, S., and Andersen, S. J. (2015). Simulation of Wind Turbine Wakes Using the Actuator Line Technique. Philos. Trans. A Math. Phys. Eng. Sci. 373, 20140071. doi:10.1098/rsta.2014.0071
Sorensen, J. N., and Shen, W. Z. (2002). Numerical Modeling of Wind Turbine Wakes. J. Fluids Eng. 124, 393–399. doi:10.1115/1.1471361
van Dijk, M. T., van Wingerden, J.-W., Ashuri, T., Li, Y., and Rotea, M. A. (2016). Yaw-misalignment and its Impact on Wind Turbine Loads and Wind Farm Power Output. J. Phys. Conf. Ser. 753, 062013. doi:10.1088/1742-6596/753/6/062013
van Dijk, M. T., van Wingerden, J.-W., Ashuri, T., and Li, Y. (2017). Wind Farm Multi-Objective Wake Redirection for Optimizing Power Production and Loads. Energy 121, 561–569. doi:10.1016/j.energy.2017.01.051
Wang, C., Campagnolo, F., and Bottasso, C. L. (2020a). Does the Use of Load-Reducing Ipc on a Wake-Steering Turbine Affect Wake Behavior? J. Phys. Conf. Ser. 1618, 022035. doi:10.1088/1742-6596/1618/2/022035
Wang, C., Campagnolo, F., and Bottasso, C. L. (2020b). Identification of Airfoil Polars from Uncertain Experimental Measurements. Wind Energy Sci. 5, 1537–1550. doi:10.5194/wes-5-1537-2020
Wang, C., Campagnolo, F., Canet, H., Barreiro, D. J., and Bottasso, C. L. (2021). How Realistic Are the Wakes of Scaled Wind Turbine Models? Wind Energy Sci. 6, 961–981. doi:10.5194/wes-6-961-2021
Wanke, G., Hansen, M. H., and Larsen, T. J. (2019). Qualitative Yaw Stability Analysis of Free-Yawing Downwind Turbines. Wind Energy Sci. 4, 233–250. doi:10.5194/wes-4-233-2019
Yang, J., Fang, L., Song, D., Su, M., Yang, X., Huang, L., et al. (2021). Review of Control Strategy of Large Horizontal‐axis Wind Turbines Yaw System. Wind Energy 24, 97–115. doi:10.1002/we.2564
Zalkind, D. S., and Pao, L. Y. (2016). “The Fatigue Loading Effects of Yaw Control for Wind Plants,” in 2016 American Control Conference (ACC) (IEEE), 537–542. doi:10.1109/acc.2016.7524969
Keywords: wind energy, wind turbines, control systems, yaw, individual pitch control, wakes, wake steering
Citation: Campagnolo F, Castellani F, Natili F, Astolfi D and Mühle F (2022) Wind Tunnel Testing of Yaw by Individual Pitch Control Applied to Wake Steering. Front. Energy Res. 10:883889. doi: 10.3389/fenrg.2022.883889
Received: 25 February 2022; Accepted: 25 April 2022;
Published: 26 May 2022.
Edited by:
Jens Nørkær Sørensen, Technical University of Denmark, DenmarkReviewed by:
Alan Wai Hou Lio, Technical University of Denmark, DenmarkBart Matthijs Doekemeijer, Delft University of Technology, Netherlands
Copyright © 2022 Campagnolo, Castellani, Natili, Astolfi and Mühle. This is an open-access article distributed under the terms of the Creative Commons Attribution License (CC BY). The use, distribution or reproduction in other forums is permitted, provided the original author(s) and the copyright owner(s) are credited and that the original publication in this journal is cited, in accordance with accepted academic practice. No use, distribution or reproduction is permitted which does not comply with these terms.
*Correspondence: Filippo Campagnolo, ZmlsaXBwby5jYW1wYWdub2xvQHR1bS5kZQ==