- College of Energy and Electrical Engineering, Hohai University, Nanjing, China
The consumption of traditional fossil energy brings inevitable environmental protection problems, which also makes the low-carbon transition in industrial development imminent. In the process of low-carbon transition, the power industry plays a very important role. However, the large-scale integration of renewable energy resources such as wind power and photovoltaic brings new characteristics to power system dispatch. How to design a dispatch strategy that considers both low-carbon demand and economic cost has become a major concern in power systems. The flexible resources such as demand response (DR) and energy storage (ES) can cooperate with these renewable energy resources, promoting the renewable energy generation and low-carbon process. Thus, a low-carbon dispatch strategy for power systems considering flexible DR and ES is proposed in this article. First, models of DR and ES based on their behavior characteristics are established. Then, a carbon emission index is presented according to China’s Clean Development Mechanism (CDM). Finally, the low-carbon dispatch strategy for power systems is proposed through the combination of the carbon emission index and flexible resource dispatch models. The simulation results show that the proposed dispatch strategy can significantly improve wind power consumption and reduce carbon emission.
1 Introduction
Energy crisis and environmental protection issues are receiving more attention worldwide. Many countries are focusing on the development of sustainable renewable energy resources. China is in the stage of energy transformation, facing the challenge of carbon neutrality target by 2060. The strategy of energy revolution has emerged, which paves the way for low-carbon industrial development. In addition, in the process of energy structure transformation, flexible resources are important to achieve low-carbon advancement in power systems.
The trend of clean power integration is irreversible. The uncertainties brought by large-scale integration of renewable energy resources pose a higher challenge to the secure and stable operation of power systems (Shan et al., 2018; Cheng et al., 2021). On the one hand, customers are guided to stagger power consumption and optimize the load structure through reasonable demand response (DR) (Shu et al., 2017). On the other hand, high-quality ES systems should be selected to match the generation dispatch of the power system (Shan et al., 2018; Zhang et al., 2018). Generally, DR in power systems refers to the electricity customer behavior of changing their electricity consumption activities according to market regulation signals (Hobbs et al., 1993; Federal Energy Regulatory Commission, 2007; Zhang et al., 2008). The DR in the electricity market can be classified into price-based response (PDR) and incentive-based response (IDR) according to the response mode. In addition, the electricity customers are guided to respond to the power system dispatch in long-term and short-term time scales (Wang et al., 2021). As an effective method for optimal dispatch of power systems, DR has been proposed in a large number of countries, helping change the electricity consumption pattern. It supports not only the grid’s peak-shaving and valley-filling but also renewable power consuming (Gao et al., 2014; Aghaei and Alizadeh, 2013) IDR can combine with PDR to improve the reliability and flexibility of DR and make DR dispatched precisely in real time (Xu et al., 2019). Zhang et al. (2021) propose an optimal DR dispatch model considering supply–demand balance and security constraints; the imbalance pressure caused by renewable energy is alleviated. In the study by Hong-Tao et al. (2018), Chen establishes a wind–solar power consumption model, and it verifies the effectiveness of DR on reducing the curtailment of wind and solar power. In the study by Gao et al. (2019), Gao characterizes the uncertainty of DR participation by considering the risk attitudes. It shows that the introducing DR can improve the adequacy of generation systems including wind power. In the study by Li et al. (2021), Li develops an optimal DR dispatch strategy for DR dispatch coordinated with the load aggregator to achieve joint optimization of entity benefits. Furthermore, the application of automatic DR in smart grids can greatly enhance the security of power system operation (Taorong et al., 2020). DR can be applied in frequency modulation to balance the active power (Zhu et al., 2021) and ensure sufficient voltage balancing control capacity (Tan and Shaaban, 2020).
Similar to DR, energy storage (ES) also has the function of flexible regulation. The renewable power curtailment can be reduced by introducing ES into the system. Thus, the ES configuration strategy is regarded as an effective approach to enhance the friendliness of wind and solar power generation (Zhang et al., 2022). It is also helpful for the stability and economic efficiency of power systems (Ani, 2021). Dorahaki developed an optimal VPP dispatch model which contains distributed wind power and ES devices. The ES device can smooth the fluctuations caused by wind power in the study by Dorahaki et al. (2020). In addition, the joint operation of wind power and ES can relieve the contradiction of renewable energy supply and reprogram the tariff profit (Zhang J. et al., 2020). The storage duration, capacity, and charging/discharging frequency of ES are investigated in the study by Hargreaves and Jones, (2020) to make it suitable for renewable energy systems. The combination of DR and ES is more beneficial to promote the optimal operation of the power systems (Wang et al., 2016; He et al., 2021). The adverse impacts of wind power uncertainties on power system stability can be solved by introducing DR and ES. Su integrates DR to a hybrid Wind-PV-ES system, achieving a goal of zero-curtailment of renewable power based on the correlation analysis (Su et al., 2020). In the study by Firouzmakan et al. (2019), DR and ES are considered in comprehensive stochastic energy management system containing micro-CHP units and renewable energy to implement resource complementarity and improve integral revenue. A multi-energy microgrid with wind–solar power generation considering DR and ES is constructed to provide a reasonable plan for multiple energy applications (Shen et al., 2022). In conclusion, the integration of DR and ES offers additional sources of flexibility in the system (Mimica et al., 2022).
Carbon emission trading is an effective way to promote global emission reduction through the market mechanism. In the study by Lou et al. (2017), Lou includes carbon emission trading cost in the objective function based on the concept of low-carbon economy. It optimizes the power generation dispatch under the random charging/discharging behavior of EVs and effectively reduces the system’s carbon emission. At the same time, the focus on carbon emission stimulates the demand for EVs, which helps take the lead in achieving the goal of “carbon peak” and “carbon neutrality” (Nie et al., 2022). Melgar-Dominguez et al. (2020) demonstrates that implementing a carbon emission trading scheme can make reduction in costs of the supplied energy and purchase of emission allowances. By incorporating the cost of carbon emission trading into a multi-energy complementary system, the environmental factors and system operating characteristics can be fully considered. Thus, wind and photovoltaic power curtailment and load shedding are reduced while minimizing system operating costs (Zhu et al., 2019). In the study by Zhang W. et al. (2020), Zhang quantitively evaluates the operation efficiency of different carbon emission trading systems to determine whether they are profitable to the economy and environment. Flexible resources such as DR and ES can cooperate with renewable energy to optimize power system dispatch and promote renewable power consumption. In addition, the import of the carbon emission trading market model can quantify the impacts of the dispatch strategy on carbon emission.
The existing literature has examined the response characteristics of DR and ES from various perspectives, showing the enhancing functions of DR and ES on carbon emission reduction. However, the integrated utilization of flexible resources still needs to be further explored, especially during the low-carbon transition period of power systems. Therefore, we propose a low-carbon dispatch strategy that combines carbon emission index and flexible DR and ES resources in this study. The strategy that realizes the reasonable coupling of conventional thermal power units, flexible resources, and carbon trading can effectively reduce wind power curtailment and quantitatively evaluate the reduction of carbon emission.
The remainder of this study is organized as follows. First, Section 2 establishes the models of DR and ES based on their behavioral characteristics. Subsequently, Section 3 proposes a low-carbon dispatch strategy through the combination of carbon market with the flexible DR resources and ES models. Section 4 demonstrates the effectiveness of the proposed strategy with simulation results. Finally, Section 5 draws the conclusion of this work.
2 Models of Flexible Resources in Power System Dispatch
2.1 The Response and Configuration Model of Multiple Demand Response Resources
We consider incentive-based DR (IDR) and price-based DR (PDR) in this study. Here, three types of IDR including interruptible load (IL), direct load control (DLC), and transferable load (TL) are modeled.
Generally, IL and DLC adjust the response amount and duration within a period according to a dispatch plan as there is a supply–demand balance problem in the system.
The cost of IL and DLC can be expressed as
The dispatch of TL can shift part of the load from the peak hours to the valley hours, releasing the load pressure and reducing thermal unit start-ups and shutdowns.
The cost of TL response can be expressed as
The PDR participates in system dispatch according to price signals, and the response amount and cost of PDR can be expressed as
When the locational marginal price is not in the threshold interval, the PDR resource can choose whether to respond and adjust to the specified load level. PDR can obtain the corresponding economic compensation from the system. The PDR acquisition response cost can be expressed as
The cost model of multiple DR is introduced above. Generally, DR also requires considering the constraints such as response duration, interval time, and amount constraints. The constraints on DR resources are as follows.
• Maximum response duration constraint:
• Maximum response count constraint:
• Minimum response interval time constraint:
• Load response amount constraint:
2.2 Energy Storage Model
The ES of power systems are modeled as follows. It is established based on its charging/discharging power, charging/discharging efficiency, maximum charging/discharging rate, self-discharging rate, and state of charge (SOC).
• Charging and discharging power constraints:
• Charging and discharging capacity constraints:
• Self-discharging capacity constraint:
• Storage capacity:
• SOC constraint:
3 The Low-Carbon Dispatch Model Considering Flexible Demand Response and Energy Storage
3.1 A Carbon Market Model Based on Clean Development Mechanism Trading Mechanism
The carbon emission trading mechanism is proposed to promote CO2 emission reduction. Based on the current economic situation, China participates in the Clean Development Mechanism (CDM) market. The large-scale grid integration of wind power is in accordance with the objective of the CDM. It can meet the demand of low-carbon dispatch of power systems. With the introduction of the CDM, power generation entities are pre-assigned a certain baseline of CO2 emissions, and the actual carbon emission is monitored (Lou et al., 2017).
Depending on the actual situation in China, the allowance allocation method is feasible. The allowance can influence the trading scale of the emission trading market and is regarded as an important factor of carbon emission trading cost. Therefore, allowances need to be measured in advance to assess the cost.
Enterprises responsible for emission reduction obligations attend the initial allocation of carbon emission trading allowances. The competent department of carbon emission trading distributes carbon emission allowances to them through legal means.
Enterprises obtain carbon emission rights through the initial allocation of carbon emission allowances. A reasonable allocation method is conducive to the optimal allocation of resources. It can enable enterprises to produce in a low-carbon and economically efficient way (Lou et al., 2017). We adopt the industry baseline method to calculate the free carbon emission allowances for power producers.
The amount of carbon allowances and the distribution method set by the government directly affects the effect of the supply of carbon emission rights. It further impacts the trading price in the carbon emission trading market. If an enterprise does not get enough allowances, it will enter the secondary market of trading to buy more. Conversely, when an enterprise emits less carbon than its allowances, it can earn revenue by selling the excess emission allowances. Therefore, the carbon emission of the participating carbon market in the model can be expressed as
The different allocation methods lead to different amounts of allowances for each enterprise. Thus, it indirectly affects the reasonableness of the supply of allowances. As a result, the motivation of enterprises to reduce emissions also changes, which affects the trading price.
The cost of emission
3.2 The Dispatch Model Considering Flexible Demand Response and Energy Storage Resources.
3.2.1 The Objective Function of the Dispatch Model
The dispatch model consists of five main parts:
• Thermal unit dispatch cost
The thermal unit dispatch process includes the start-up and shutdown cost and fuel cost.
The shutdown cost of thermal units is generally set to a small constant independent of the duration of continuous operation, and the start-up cost is set as an exponential function of the time constant for the shutdown time. The start-up and shutdown costs of thermal units are set as fixed parameters to simplify the analysis in this article, which can be expressed as
Then, the start-up and shutdown costs of thermal units in a dispatch cycle can be expressed as
The fuel cost of thermal units is usually a binomial of its power output, which can be expressed as
Thus, the total cost of thermal unit dispatch is expressed as
• Carbon emission trading cost
Based on CDM, the cost of carbon emission trading is as follows (Lou et al., 2017):
When
• Penalty cost for wind power curtailment
• DR participation cost
The DR participation cost in a dispatch cycle can be expressed as
• ES operation cost
According to the ES model presented in 2.2, the operation cost of ES can be expressed as
Through integration of the aforementioned five subobjectives, the main objective function can be expressed as
3.2.2 The Constraints of the Dispatch Model
The model also includes constraints on the operation of thermal power units and relative constraints of DR and ES.
• Spinning reserve constraint:
• Power balance constraint:
• Upper and lower limit constraints of thermal unit output:
• Minimum start-up and shutdown time constraints:
• Ramping constraints:
• Maximum start-up and shutdown power constraints:
• System stability requirement:
Constraints of DR resources in Eqs 1–8 (35)
Constraints of ES resources in Eqs 9–13 (36)
4 Case Study
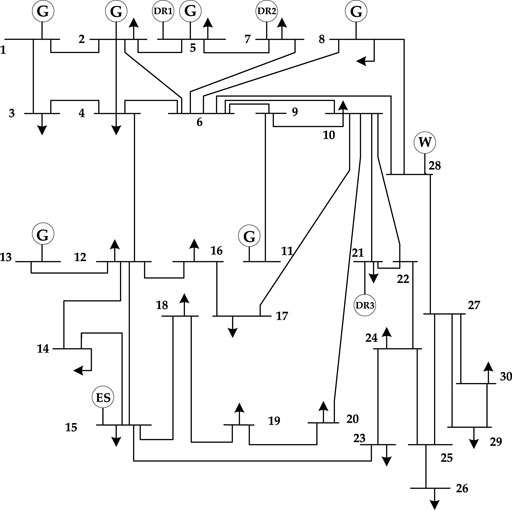
To verify the effectiveness of our proposed low-carbon dispatch strategy, a modified IEEE30-bus test system is selected and shown in Figure 1. It has six thermal units and 41 lines. The system is assembled with three DR aggregators (named as D1, D2, and D3 in Figure 1) containing different DR resources at Bus 5, 7, and 21, respectively. D1 and D2 each contain three IDRs, and D3 contains one PDR resource. A wind farm with a total capacity of 45 MW is located at Bus 28. An ES module with a capacity of 500 MW·h is located at Bus 15. The relevant parameters of thermal power units, DR resources, ES device, system load forecast, and wind power forecast output are given in Supplementary Material S1. The model proposed in this study is solved by GAMS on a 16-core CPU/16G RAM PC. To quantitively access the impact of flexible DR and ES resources on the wind power consumption and carbon reduction, three scenarios are designed as follows.
Scenario 1
In this scenario, DR resources do not participate in the system dispatch process.
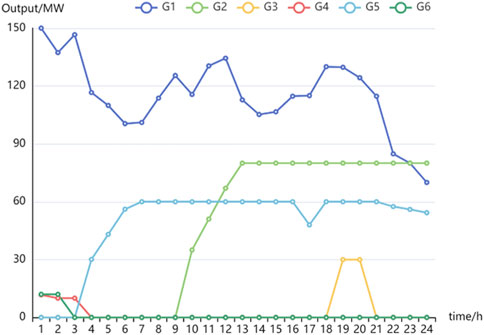
The outputs of thermal units are shown in Figure 2. The amount of wind power curtailment and daily operation costs of the system are shown in and Tables 1, 2, respectively.
It can be found from Table 1 that the wind power curtailment occurs frequently in Scenario 1. In Table 2, the total cost of system operation is $105512, of which the thermal unit dispatch cost, carbon emission trading cost, and wind power curtailment penalty are $87613, $2,985, and 14913, respectively.
Scenario 2:
In this scenario, only DR resources participate in the system dispatch process.
The characteristic parameters of IDR and PDR resources are listed in Supplementary Material S1 and the LMP curves of PJM.
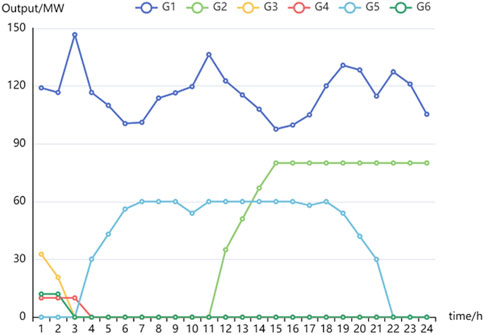
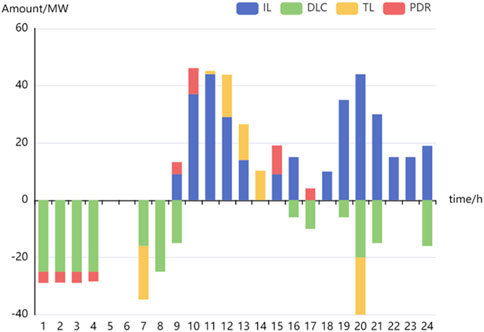
The outputs of thermal units, values of DR response, and amount of wind curtailment are shown in Figures 3, 4; Table 3, respectively. The daily operation costs of the system are listed in Table 4.
The wind power curtailment amount in Scenario 1 and Scenario 2 are 497.10 and 242.00 MW, respectively. Compared with Scenario 1, the participation of DR resources in Scenario 2 helps reduce the wind power curtailment by 51.32%. In addition, it is worth noting that the carbon emission trading cost before and after DR participation is $2,985 and $2,776 respectively. With DR participation in the system dispatch, the overall outputs of thermal power units decrease. In addition, the peak-to-valley gap of the system is reduced, which directly reduces carbon emission. DR provides more opportunity for wind power generation and avoids frequent start-up and shutdown actions of the thermal units. Therefore, it also helps relieving the pressure of high load peaking.
Scenario 3
In this scenario, both DR and ES participate in the system dispatch process.
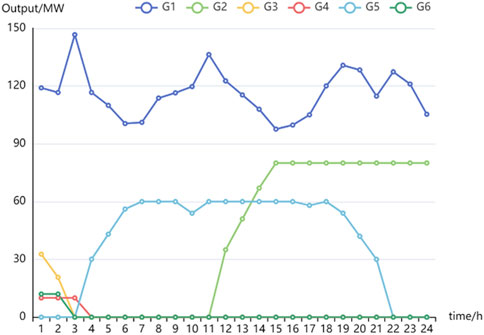
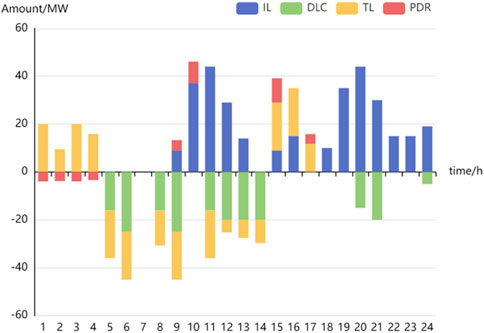
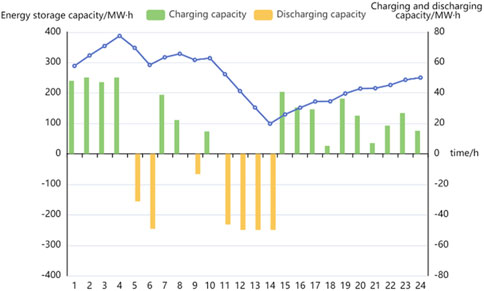
The outputs of thermal units, values of DR response, and variation of ES capacity are shown in Figure 5, Figure 6, and Figure 7, respectively. The blue curve representing energy storage capacity in Figure 7 is associated with the left Y-axis, and the green and yellow bars representing the charging and discharging capacity are associated with the right Y-axis. The daily operation costs of the system are listed in Table 5.
In Scenario 3, the time distribution of wind power resources is further optimized with the participation of ES in the system operation process. The wind power here is completely consumed. The flexible dispatch strategy and superior response performance of DR resources and ES play an important role in wind power consumption and system power balance maintenance. Moreover, ES helps with relieving the pressure of peaking. In carbon emission reduction, the effect of ES is reflected in the consumption of wind power to reducing carbon emission at the source-side.
As can be found from Table 6, the participation of DR in the system dispatch process has optimized the operation of thermal units, reducing their peaking pressure and the costs arising from frequent start-ups and shutdowns. In addition, the increase in wind power consumption results in significant reduction in wind power curtailment penalty. The improvement of thermal unit outputs has reduced the carbon emission trading cost of the system by 7.00% with DR participation. Although the involvement of ES brings added costs to the system, it is notably less than the decrease in the wind power curtailment penalty. Thus, compared with Scenario 1 and 2, the total cost in Scenario 3 decreases by 7.67 and 13.77%, respectively.
5 Conclusion
In this article, we propose a low-carbon dispatch strategy for power systems considering flexible DR and ES. First, the models of flexible DR resources and ES is established based on their behavior characteristics. Second, by combining the carbon market model with the flexible DR resources and ES model, the low-carbon dispatch strategy is proposed. Finally, the effectiveness of the proposed strategy is verified with simulations.
From the presented work, general conclusions can be drawn as follows:
1) The cooperation of DR and ES has a remarkable impact on the power system dispatch. The combined operation mode of DR and ES effectively promotes peak-shaving and valley-filling.
2) The combined DR–ES dispatch has a notable function on wind power consumption. Through the dispatch of flexible resources, the wind power curtailment can be greatly reduced.
3) The low-carbon dispatch strategy can quantitatively evaluate the reduction of carbon emission, realizing the reasonable coupling of conventional thermal power units, flexible resources, and carbon trading. It can help design carbon reduction policies according to DR and ES activities.
In the future work, we plan to combine the uncertainties derived from power and load with our framework and make the proposed model appropriate for short-time scale dispatch environment.
Data Availability Statement
The original contributions presented in the study are included in the article/Supplementary Material; further inquiries can be directed to the corresponding author.
Author Contributions
HH conceptualized and formed the methodology. TW prepared the original draft. HH, TW, and XX reviewed and edited the article. HH, CW, and TW supervised the study. ZW, HZ and GS administered the project. HH funded the acquisition. All authors have read and agreed to the published version of the manuscript.
Funding
This research was funded in part by the Fundamental Research Funds for the Central Universities under Grant B200201016 and in part by the Postdoctoral Research Funding Program of Jiangsu Province under Grant 2021K622C.
Conflict of Interest
The authors declare that the research was conducted in the absence of any commercial or financial relationships that could be construed as a potential conflict of interest.
Publisher’s Note
All claims expressed in this article are solely those of the authors and do not necessarily represent those of their affiliated organizations, or those of the publisher, the editors, and the reviewers. Any product that may be evaluated in this article, or claim that may be made by its manufacturer, is not guaranteed or endorsed by the publisher.
Supplementary Material
The Supplementary Material for this article can be found online at: https://www.frontiersin.org/articles/10.3389/fenrg.2022.883602/full#supplementary-material
References
Aghaei, J., and Alizadeh, M.-I. (2013). Demand Response in Smart Electricity Grids Equipped with Renewable Energy Sources: A Review. Renew. Sustain. Energ. Rev. 18, 64–72. doi:10.1016/j.rser.2012.09.019
Ani, V. A. (2021). Development of an Intelligent Power Management System for Solar PV-Wind-Battery-Fuel-Cell Integrated System. Front. Energ. Res. 9. doi:10.3389/fenrg.2021.613958
Cheng, L., Zang, H., Wei, Z., Ding, T., Xu, R., and Sun, G. (2022). Short-term Solar Power Prediction Learning Directly from Satellite Images With Regions of Interest. IEEE Trans. Sustain. Energy 13, 629–939. doi:10.1109/TSTE.2021.3123476
Dorahaki, S., Dashti, R., and Shaker, H. R. (2020). Optimal Energy Management in the Smart Microgrid Considering the Electrical Energy Storage System and the Demand-Side Energy Efficiency Program. J. Energ. Storage 28, 101229. doi:10.1016/j.est.2020.101229
Federal Energy Regulatory Commission (2007). The Content You Are Looking for Is Currently Archived in eLibrary. Available at: http://www.ferc.gov/legal/staff-reports/demand-response.pdf (Accessed February 15, 2022).
Firouzmakan, P., Hooshmand, R.-A., Bornapour, M., and Khodabakhshian, A. (2019). A Comprehensive Stochastic Energy Management System of Micro-CHP Units, Renewable Energy Sources and Storage Systems in Microgrids Considering Demand Response Programs. Renew. Sustain. Energ. Rev. 108, 355–368. doi:10.1016/j.rser.2019.04.001
Gao, C. W., Liang, T. T., and Li, Y. (2014). A Review of the Theory and Practice of Automatic Demand Response. Power Sys Techno 352, 359. doi:10.13335/j.1000-3673.pst.2014.02.013
Gao, J., Ma, Z., and Guo, F. (2019). The Influence of Demand Response on Wind-Integrated Power System Considering Participation of the Demand Side. Energy 178, 723–738. doi:10.1016/j.energy.2019.04.104
Hargreaves, J. J., and Jones, R. A. (2020). Long Term Energy Storage in Highly Renewable Systems. Front. Energ. Res. 8. doi:10.3389/fenrg.2020.00219
He, P., Chi, F., and Zhao, Z. B. (2021). A Research on a Scheduling Method of Wind Power Energy Storage System with Demand Response Participation. Comput. Digital Eng. 1936, 1940. doi:10.3969/j.issn.1672-9722.2021.09.039
Hobbs, B. F., Rouse, H. B., and Hoog, D. T. (1993). Measuring the Economic Value of Demand-Side and Supply Resources in Integrated Resource Planning Models. IEEE Trans. Power Syst. 8, 979–987. doi:10.1109/59.260903
Hong-Tao, C., Jian-Xue, C., Yang, D., Meng, Y., and Ge, P. (2018). “Local Consumption Model of Wind and Photovoltaic Power Based on Demand Side Response,” in 2018 China International Conference on Electricity Distribution (CICED), Tianjin, China, 17-19 Sept. 2018. doi:10.1109/CICED.2018.8592126
Li, W., Han, R. D., and Sun, C. (2021). Optimal Incentive Contract and Incentive Strategy for Levelable Load Participation in Demand Response Based on Electricity Consumption Preference. Proc. Chin. Soc. Electr. Eng 185, 193. doi:10.13334/j.0258-8013.pcsee.202593
Lou, S., Zhang, L., Wu, Y., and Wang, Y. (2017). Coordinated and Optimal Operation between Electric Vehicle Cluster and Power System in Low Carbon Economy. Trans. China Electrotechnical Soc. 176, 183. doi:10.19595/j.cnki.1000-6753.tces.2017.05.021
Melgar-Dominguez, O. D., Pourakbari-Kasmaei, M., Lehtonen, M., and Sanches Mantovani, J. R. (2020). An Economic-Environmental Asset Planning in Electric Distribution Networks Considering Carbon Emission Trading and Demand Response. Electric Power Syst. Res. 181, 106202. doi:10.1016/j.epsr.2020.106202
Mimica, M., Sinovčić, Z., Jokić, A., and Krajačić, G. (2022). The Role of the Energy Storage and the Demand Response in the Robust reserve and Network-Constrained Joint Electricity and reserve Market. Electric Power Syst. Res. 204, 107716. doi:10.1016/j.epsr.2021.107716
Nie, Q., Zhang, L., and Li, S. (2022). How Can Personal Carbon Trading Be Applied in Electric Vehicle Subsidies? A Stackelberg Game Method in Private Vehicles. Appl. Energ. 313, 118855. doi:10.1016/j.apenergy.2022.118855
Shan, F., Li, X., and Song, Y. (2018). Economic Dispatch of Regional Integrated Energy System Based on Improved Two-Stage Robust Optimization. Electr. Meas. Instrumentation 103, 108. doi:10.3969/j.issn.1001-1390.2018.23.017
Shen, Y., Hu, W., Liu, M., Yang, F., and Kong, X. (2022). Energy Storage Optimization Method for Microgrid Considering Multi-Energy Coupling Demand Response. J. Energ. Storage 45, 103521. doi:10.1016/j.est.2021.103521
Shu, Y., Zhang, Z., Guo, J., and Zhang, Z. (2017). Analysis of Key Factors of New Energy Consumption and Research on Solution Measures. Proc. Chin. Soc. Electr. Eng 1, 9. doi:10.13334/j.0258-8013.pcsee.162555
Su, S., Zhang, S., and You, Y. (2020). A Demand Response Strategy Based on Correlation Analysis for Complementary Wind and Storage. Sci. Techn. Eng. 6902, 6907. doi:10.3969/j.issn.1671-1815.2020.17.029
Tan, W.-S., and Shaaban, M. (2020). Dual-timescale Generation Scheduling with Nondeterministic Flexiramp Including Demand Response and Energy Storage. Electric Power Syst. Res. 189, 106821. doi:10.1016/j.epsr.2020.106821
Taorong, G., Ninghui, H., Jindou, Y., and Chao, Y. (2020). Demand Response Analysis of Large Electricity Consumer Based on Load Response Model. Manage. Sci. Informatization Econ. Innovation Develop. Conf. 81, 84. doi:10.1109/MSIEID52046.2020.00023
Wang, B., Ye, B., and Zhu, L. (2021). Practice and Exploration of Electricity Demand Response in China under Market Environment[J]. Electricity demand-side Manag. 91, 95. doi:10.3969/j.issn.1009-1831.2021.05.018
Wang, T. W., Gao, E., Jiang, M., and Du, T. (2016). Optimal Scheduling of Power System under Virtual Power Plant Counting and Distributed Wind Power and Energy Storage System. Electric Power Construction 108, 114. doi:10.3969/j.issn.1000-7229.2016.11.016
Xu, Y., Liao, Q., and Liu, D. (2019). Integrated Demand Response and Game-Based Intra-day Joint Optimal Dispatch of Regional Integrated Energy System with Multiple Subjects. Power Sys Techno 2506, 2518. doi:10.13335/j.1000-3673.pst.2018.2421
Zhang, H., Gong, C., Ju, W., Pan, G., and Wang, W. (2021). Optimization Dispatch Modeling for Demand Response Considering Supply and Demand Balance and Security Constraints. Power Syst. Green Energ. Conf. 166, 170. doi:10.1109/PSGEC51302.2021.9542507
Zhang, J., Guerra, O. J., Eichman, J., and Pellow, M. A. (2020). Benefit Analysis of Long-Duration Energy Storage in Power Systems with High Renewable Energy Shares. Front. Energ. Res. 8. doi:10.3389/fenrg.2020.527910
Zhang, L. D., Yuan, Y., and Sun, D. (2018). A Wind-Storage Joint Operation Scheduling Model Based on Two-Stage Robust Interval Optimization. Electric Power Automation Equipment 59, 66. doi:10.16081/j.issn.1006-6047.2018.12.009
Zhang, Q., Wang, X., Wang, J., and Feng, C. L. (2008). A Review of Demand Response Research under Power Market. Automat Electron. Power Sys 97, 106. doi:10.3321/j.issn:1000-1026.2008.03.022
Zhang, R. C., Zhai, D. J., and Zhang, Y. (2022). Distributed Model Predictive Control Based on Scenic Storage Double-Layer Bus Microgrid. Mech. Des. Manufacture 1, 6. doi:10.19356/j.cnki.1001-3997.20211115.040
Zhang, W., Li, J., Li, G., and Guo, S. (2020). Emission Reduction Effect and Carbon Market Efficiency of Carbon Emissions Trading Policy in China. Energy 196, 117117. doi:10.1016/j.energy.2020.117117
Zhu, Q., Wang, Y., Song, J., Jiang, L., and Li, Y. (2021). Coordinated Frequency Regulation of Smart Grid by Demand Side Response and Variable Speed Wind Turbines. Front. Energ. Res. 9. doi:10.3389/fenrg.2021.754057
Zhu, Y., Lan, Z. B., and Kui, Z. (2019). Optimal Operation of Wind-Storage Multi-Energy Complementary System Considering Carbon Emission Cost. Power Syst. Prot. Control. 127, 133. doi:10.19783/j.cnki.pspc.180659
Glossary
Indices
t Index of hours
i Index of thermal units
l Index of branches
Parameters
Variables
Keywords: power system dispatch, flexible resources, demand response, energy storage, low-carbon dispatch strategy
Citation: Han H, Wei T, Wu C, Xu X, Zang H, Sun G and Wei Z (2022) A Low-Carbon Dispatch Strategy for Power Systems Considering Flexible Demand Response and Energy Storage. Front. Energy Res. 10:883602. doi: 10.3389/fenrg.2022.883602
Received: 25 February 2022; Accepted: 21 March 2022;
Published: 26 April 2022.
Edited by:
Qinran Hu, Southeast University, ChinaReviewed by:
Minjian Cao, Tsinghua University, ChinaXin Zhao, Southeast University, China
Xun Dou, Nanjing Tech University, China
Copyright © 2022 Han, Wei, Wu, Xu, Zang, Sun and Wei. This is an open-access article distributed under the terms of the Creative Commons Attribution License (CC BY). The use, distribution or reproduction in other forums is permitted, provided the original author(s) and the copyright owner(s) are credited and that the original publication in this journal is cited, in accordance with accepted academic practice. No use, distribution or reproduction is permitted which does not comply with these terms.
*Correspondence: Haiteng Han, aGFuaHRAaGh1LmVkdS5jbg==
 Haiteng Han
 Tiantian Wei
 Chen Wu