 Yizhou Fang
 He Wu*
 Bo Jiang
95% of researchers rate our articles as excellent or good
Learn more about the work of our research integrity team to safeguard the quality of each article we publish.
Find out more
ORIGINAL RESEARCH article
Front. Energy Res. , 24 June 2022
Sec. Wave and Tidal Energy
Volume 10 - 2022 | https://doi.org/10.3389/fenrg.2022.883553
This article is part of the Research Topic Offshore Wind and Wave Energy and Climate Change Impacts View all 5 articles
During the R&D of marine renewable energy converters, scale models are usually used in the early stages of development of marine renewable energy converters. China’s National Ocean Integrated Test Site (NOITS) is being developed by the National Ocean Technology Center (NOTC) in Weihai, Shandong Province, to facilitate testing of scaled wave and tidal energy converters in an open sea environment. This research aims to gain a detailed understanding of the wave characteristics and the wave energy resource at this site. A nested modeling system has been implemented using Simulating WAves Nearshore (SWAN) to provide a 10-year high-resolution wave hindcast between 2009 and 2019 with an approximately 60 m resolution covering the test site. Analysis of the spatio-temporal distribution of wave energy resource in NOITS reveals its strong seasonality, with the mean wave power density of >1.5 kW/m during winter and <0.2 kW/m during summer. We also performed a statistical analysis of the high and extreme wave conditions and their occurrence. By applying scaling methods to wave resources, four WECs were selected to demonstrate the testing at different scale ratios in NOITS. The results of this study provide engineering references for the design of scale wave energy converter models which target to perform open sea trials in NOITS.
Wave energy has been recognized as a promising renewable energy resource and has gained more interest during the past decade (López et al., 2013). Compared to other forms of marine renewable energy (e.g., tidal energy), wave energy has much global interest because the geographical distribution of the resource is more diverse (Neill and Hashemi, 2018). It is also a potential solution for coastal regions and remote islands that face a shortage of electricity.
Upon deploying wave energy converters (WECs) in the desired site, it is essential to clarify the wave characteristics and wave energy resources in this area. Due to the high variability of the wave energy resources, the current IEC technical specification 62600-101 (International Electrotechnical Commission, 2015) suggests using a minimal of 10-year wave data for the assessment. Much effort has been devoted to wave resource characterization from global to regional scales. Zheng (2021) built a global dataset for long-term planning, site selection, and operation of wave energy projects; Rusu and Rusu, (2021) evaluated the global distribution of wave energy resources based on the ERA5 reanalysis data; Gunn and Stock-Williams, (2012)calculated global wave energy resource reserves. On the shelf sea-scale, Neill and Hashemi, (2013) quantified the variability of the wave energy resource over the Northwest European shelf seas, and a correlation was found between the winter resource and the North Atlantic Oscillation; Besio et al. (2016) produced a 35-year wave hindcast in the Mediterranean Sea for wave energy resource assessment; Akpinar et al. (2017) simulated 31 years of wave data for the Black Sea and performed an analysis of the variability of the resource at different time scales; Zheng et al. (2019) studied the spatio-temporal variability of wave energy along the Maritime Silk Road. For regional assessments, van Nieuwkoop et al. (2013) characterized the wave resource of Cornwall, UK, from a 23-year hindcast dataset; Veigas et al. (2014) carried out the optimal site selection for the Seawave Slot-Cone Generator in Galicia, Spain. In recent years, many studies have been conducted on wave energy in regional and nearshore areas using high-resolution numerical models. Yang Z. et al. (2020) conducted a 32-year simulation of the West Coast of the US, with a resolution of 200 m in nearshore areas, and analyzed the potential, variability, and extreme conditions of the wave resource; García-Medina et al. (2021) evaluated the wave resource of the southern coast of Alaska following IEC TS 62600-101, using a 32-year simulation with a resolution of 300 m within 30 km from the shoreline.
Characteristics of wave energy resources in China seas have been previously studied by several researches using different sources of data and approaches. The wave field of the East China Sea and South China Sea was simulated by the third-generation wave spectral model WAVEWATCH-III and investigated the trend of the wave energy and significant wave height in the China seas (Zheng et al., 2012; Zheng and Li, 2015). Wan et al. (2015) performed a wave energy resource assessment in China’s seas based on multi-satellite altimeter data from AVISO. Wang et al. (2016) studied wave energy resources in the Bohai Sea by using wave fields produced by the SWAN wave model from 1985 to 2010. Jiang et al. (2019) gave guidance on site selection for wave energy power plants in the South China Sea (SCS) using wave statics from the ERA-Interim reanalysis dataset. Kamranzad and Lin, (2020) revealed the long-term rate of change of wave energy in the SCS by analyzing 55 years of SWAN wave simulation. A recent study by Yang S. et al. (2020) analyzed the spatial and temporal distribution of wave energy in the China seas based on a 30-year numerical modeling result. Multiple technologies and data sources have been adapted, and these studies provide an outlook of wave energy resources along the coastline of China. However, most of the researchers focused on the regional scale, while little investigation has been conducted at a site-specific scale for China’s coastal areas.
After the laboratory test phase, the development of WEC requires sea trails to verify the effectiveness and reliability of the technology under real ocean conditions and refine the estimation of the levelized cost of energy (Pecher, 2017). With the increasing demand for R&D of marine energy converters, the need of a test facility in well-understood ocean environments has been increasing. Several test sites have been constructed or planned in many locations with different wave conditions all over the globe. The first of its kind is the European Marine Energy Centre (EMEC), which has a wave test facility located at Billia Croo to the west of Orkney, officially opened in 2003 (Lawrence et al., 2013). Another wave energy test site in the UK is Wave Hub in Cornwall, which provides grid-connected infrastructure for testing and development of wave and offshore wind (South West of England Regional Development Agency, 2006). Portugal has built a test site for the research and demonstration of floating offshore wind and wave energy technologies (TRL 6-8) at Agucadora, north of Porto (Silva et al., 2018). Ireland has set up a 1/4 scale wave energy testing facility in Galway Bay (Atan et al., 2018) and the Atlantic Marine Energy Test Site for full-scale devices with much more energetic in terms of wave energy, as it is directly exposed to the Atlantic Ocean (Atan et al., 2016). Spain built an offshore infrastructure named Oceanic Platform of the Canary Islands (PLOCAN) off the coast of Gran Canaries, aiming to provide test facilities for marine energy converters during the final stages of development(González et al., 2011). In the US, two grid-connected test sites at Oregon State University and the University of Hawaii at Manoa are available to full-scale WECs (Lehmann et al., 2017).
In recent years, with more than 30 organizations participating in wave energy conversion technology research, China has built 49 wave energy demonstration projects, 10 of which have over 100 kW rated capacity (Qiu et al., 2019). Given the growing interest in the MRE sector, a number of test sites have been built or planned in China. One of these is the National Ocean Integrated Test Site (NOITS), a public-available test bed for marine technologies including tidal stream and wave energy converters. It is being built by the National Ocean Technology Center, located approximately 5 km off the coast of Weihai City, Shandong Province. Along with two other planned full-scale test sites for tidal stream and wave technology in Zhejiang and Guangdong provinces, NOITS is designed to provide facilities and environmental conditions for sea trail testing of scale models. The site is located north of Chudao Island, occupying 5 km2 of the sea area with a water depth ranging from 40–80 m (Figure 1). Two berths and a two-body floating platform (Guohaishi No.1, Figure 2) are provided for installation and mooring of MRE devices.
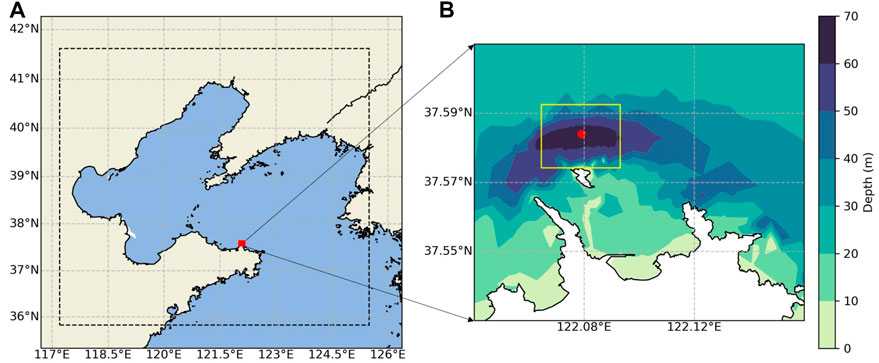
FIGURE 1. (A) Location of NOITS, with a dotted line and red box indicating outer and inner grid, respectively. (B) Bathymetry near Chudao Island, with a yellow box indicating the boundary of NOITS. The red dot is the deployment location of the wave buoy which collected validation data.
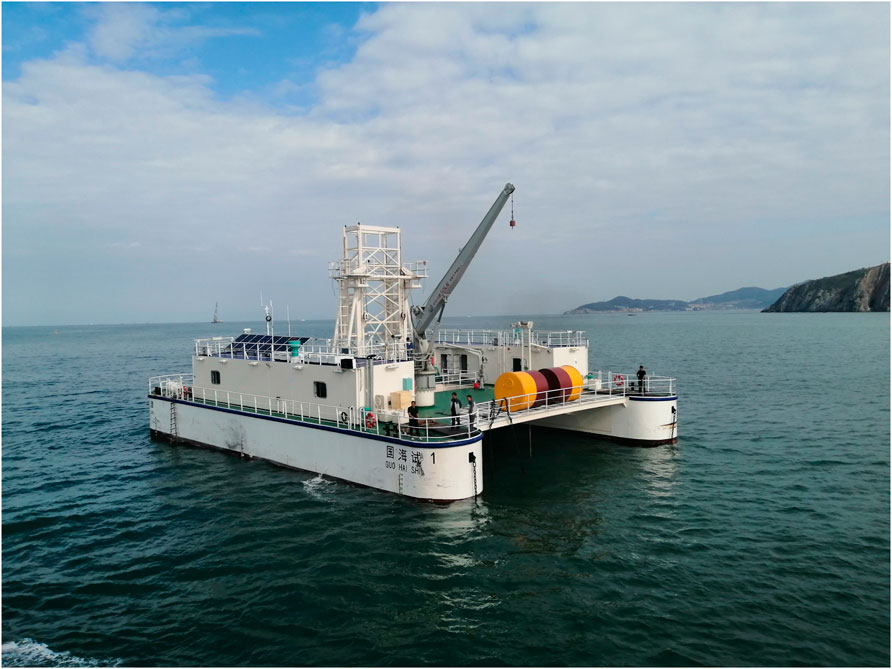
FIGURE 2. Guohaishi No.1 floating platform at the NOITS.
This research focuses on understanding the characteristics of wave energy resources at the NOITS site, with the aim of providing useful information for those who want to conduct sea trails at this test site. For this purpose, a nested numerical wave model is developed to simulate wave conditions at the site. Based on the modeled 10-year wave data, the spatio-temporal distribution of wave energy resources is studied. In addition, extreme waves and testing conditions of WECs under different scaling factors are discussed.
The third-generation wave model SWAN developed by Delft University of Technology was adopted in this study. SWAN has been widely used in the field of wave energy resource characterization and assessment (Akpinar et al., 2017; Silva et al., 2018). The model solves the action balance equation rather than the energy balance equation, which includes terms from wave generation by wind, wave breaking, white-capping, nonlinear wave–wave interactions, and bottom friction. In Cartesian coordinates, the equation may be written as:
where S is the total source term and
where the terms on the right-hand side denote the wind input to wave growth, nonlinear three-wave and four-wave interaction, wave dissipation due to white-capping, bottom friction, and depth-introduced wave breaking, respectively.
SWAN accepts both structured and unstructured grids. Generally, structured grids are simpler in terms of pre-/post-processing, but in order to balance the desired resolution and computational expense, a nest grids method is required; unstructured grids can accommodate different scales within a single grid making it easy to achieve higher resolution in the target area, but more effort is required for meshing, as the model result will highly depend on the quality of the mesh. Both methods are widely used in modeling of wave energy resources. For instance, Morim et al. (2016) and Rusu (2018) adopted the nesting method for high-resolution simulation of wave resources on the South Coast of Australia and the Iberian Nearshore in Portugal, respectively, while Ahn et al. (2021) and Li et al. (2021) used unstructured grids of the East Coast of the US and Hawaiian waters in SWAN.
As Te in the study area is mostly in the range of 3–7 s (Wan et al., 2018), the ratio between water depth of NOIST (40–80 m) and wavelength (15–75 m) is usually greater than 0.5; therefore, the wave power can be calculated using the deep-water expression:
where P is the wave power in kilowatts per unit of crest length, Hs, the significant wave height, Te, the energy period, and g, the gravitational acceleration. Taking ρ, the seawater density, as 1025 kg/m3, the wave power can be calculated as Eq. 4:
and Te is defined as moments of the wave spectrum:
where f is the frequency and S(f) is the density of the wave spectrum.
Temporal variability of the wave energy is described and qualified by the annual variability index (AV) and the coefficient of variation (CV). AV is given by:
where Pamax − Pamin is the difference between the maximum and minimum annual averaged wave power of individual years and Pmean is the mean wave power over the 10 years.
CV is defined as the ratio of the standard deviation (δ) to the mean(μ) of wave power:
To correctly project the performance and behavior of the WEC from a scaled model and to record sufficient data during the test, choosing the appropriate scaling ratio is essential for sea trails. For wave energy applications, the Froude similarity is widely used in the design of WECs, and its applicability has been proven by previous research (Schmitt and Elsäßer, 2017; Sheng et al., 2017). The Froude number (Fr) is defined by:
where U is the velocity of the fluid and l is the characteristic length. Here, the ratio (λ) between the full-scale device and the model is defined as:
where Lf and Lm are the characteristic length for the full-scale device and model, respectively. The Froude similarity can be written as:
If g is constant and taking Lf = λLm, Eq. 10 yields the following:
Since the dimensions of U can be written as:
where [U], [L], and [T] are the dimensions of velocity, length, and time, respectively. This yields the Froude scale ratio of time as λ0.5. A list of the Froude scale ratios of wave height, wave period, and power density is shown in Table 1. Applying the Froude similarity to wave quantities, the wave conditions at a test site can be upscaled for full-scale usage.
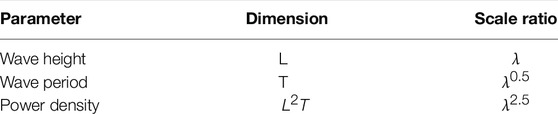
TABLE 1. Froude scaling ratios between full-scale and model for wave quantities.
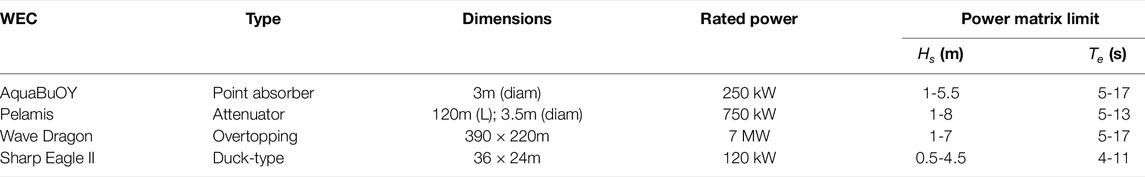
TABLE 2. WECs selected to demonstrate testing in the NOITS.
In this study, a nested wave model for NOITS has been set up to produce the wave hindcast at the study area. The outer grid covers the entire Bohai Sea and Yellow Sea, extending from 117.2°E to 126°E and 35.8°N to 42.3°N, with a spatial resolution of 0.01°. The inner grid covers approximately 80 km2 sea area around NOITS (122.03°– 122.13°E, 37.52°– 37.62°N) at 55 m × 55 m resolution. Two-dimensional wave spectrum files were generated 3 h by the coarser outer model and interpolated to the grid points at the boundary of the high-resolution inner grid. Since the Bohai Sea and Yellow Sea are semi-enclosed marginal seas with a modest wave climate and the inner grid is sufficiently far away from the ocean boundary of the outer grid, no wave components were applied to the boundary of the outer grid. Breaking, white-capping, JONSWAP bottom friction, and quadruplet wave–wave interactions were activated in the simulations. The driven wind field was produced from the CCMP (Cross-Calibrated Multi-Platform) V2.0 ocean surface wind vector (Mears et al., 2019), which provides 6-hourly wind data at a grid resolution of 0.25°.
The model was simulated for a 10-year period from January 2009 to December 2019. A total of 25 bins were set in the frequency domain between 0.05 Hz and 1 Hz, with a time step of 60 min for the outer and inner grids. For the spectral direction, a bin of 10° was chosen for the full 360°. Modeling results of significant wave height (Hs), mean period (Tm01), energy period (Te), and the mean wave direction (θm) were generated at 1-h intervals and stored in NetCDF files.
The model was validated against the observed wave data from a buoy deployed to the north of NOITS between February and March 2015. To evaluate the model performance, differences between the modeled results and observations were quantified by computing the root-mean-square error (RMSE), scatter index (SI), and relative error (RE). The RMSE is defined as:
where N is the number of observations, Sn is the simulated value, and On is the observed value corresponding to Sn. The scatter index (SI) is the RMSE normalized by the averaged observation values, defined as:
where
where
The model result was validated against wave observation data collected by a buoy deployed in the NOITS (122°4′44″E, 37°35′2″N) between February and March 2015 (Figure 1). The comparison results of the modeled and observed Hs, Tm01, and θm are provided in Figure 3. The model results indicated that the model was able to simulate the significant wave height with reasonable accuracy, with 0.16 m RMSE, 18.5% scatter index, and -17.1% RE. Hs below 2.7 m, while some values around 3 m were overestimated. The mean wave period was underestimated by about 10%, which was in accordance with other modeling results of SWAN and documented in SWAN’s scientific and technical documentation The SWAN Team, (2020). θm showed a general agreement between the modeled and observed wave directions. However, there are some discrepancies around the observed direction of 60°where the model predicted 180°, probably due to incorrect wind forcing. Based on the validation metrics, this model provides reliable data for the analysis of wave energy resources for further studies.
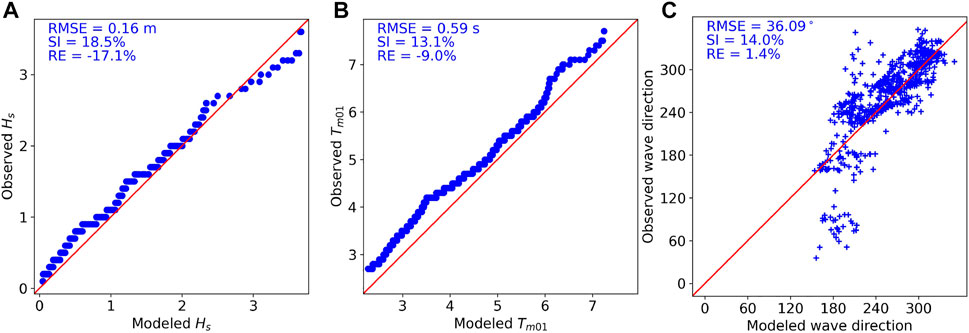
FIGURE 3. Quantile plots (QQ plots) for modeled and observed significant wave height (A) and mean wave period (B), and scatter plot of modeled wave direction against observed (C) at NOIST between February and March 2015. Validation metrics are in the upper left of each sub-figure.
In this section, wave parameters from the 10-year simulation at the NOITS are discussed. To provide necessary information for the design and testing of WEC prototypes, the assessment of wave energy resources involves:
• Spatial-temporal distribution of seasonal means;
• Variation of wave resources at different temporal levels;
• Joint occurrence analysis;
• Scatter plot of spectral variation
The spatial distribution of seasonal-averaged wave power at NOITS was calculated based on Eq. 4. Seasonal analysis was conducted on a three-month basis: December–January–February (DJF), March–April–May (MAM), June–July–August (JJA), and September–October–November (SON). Contour maps (Figure 4) show the seasonal mean Hs, Te, and wave power density (P) within the NOITS from our 10-year simulation results. Overall, no obvious spatial variation was observed in the NOITS and its surrounding waters. The decrease of wave power happens only in areas very close to the shoreline. An evident seasonal varying trend of the wave energy resource is distinguished, with the most energetic sea state (>1.5 kW/m) occurring during winter (DJF) and then gradually decreasing until summer (JJA). In terms of Hs and Te, the highest seasonal-averaged values correspond to DJF (1 m and 4 s), followed by SON (0.6 m and 3.4 s), MAM (0.3 m and 2.5 s), and JJA (0.2 m and 2 s).
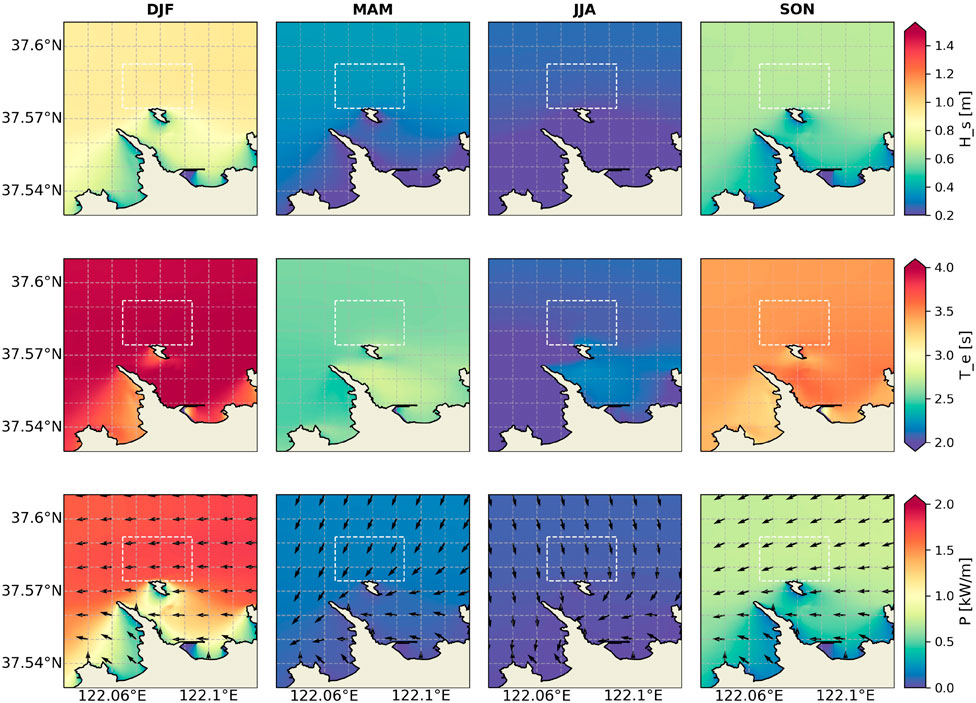
FIGURE 4. Ten-year seasonal means of Hs(m), Tm01(s), and power density (kW/m) at NOITS. Arrows in the power density diagrams are the main wave directions. White boxes are the boundary of NOITS.
For the deployment and testing of a WEC, detailed wave characterization matrices such as directional wave power spreading and occurrence of certain wave conditions (that is, wave height and period) are required. As previously shown in Figure 4, little spatial change of wave characteristics can be seen within the site, and considering that the area of the site (5 km2) is small, the center point of the NOITS is selected for detailed analysis.
Generally speaking, this site has a relatively strong variation in wave power density, with AV = 0.386 and CV = 1.23. Figure 5 illustrates the monthly variability of the wave energy resource from the 10-year simulation result. The monthly mean power density data have a clear trend that it rises during winter and falls during summer. For the most energetic month (December), the median power density is 4.9 kW/m with a 95% confidence interval lying between 3.2 kW/m and 6.4 kW/m. In contrast, the less energetic months (May, June, and July) have very low mean power density (<0.2 kW/m). It is also noticeable that higher mean power density months experienced more intra-annual variations than months with lower mean power density, as the 95% error bars suggested.
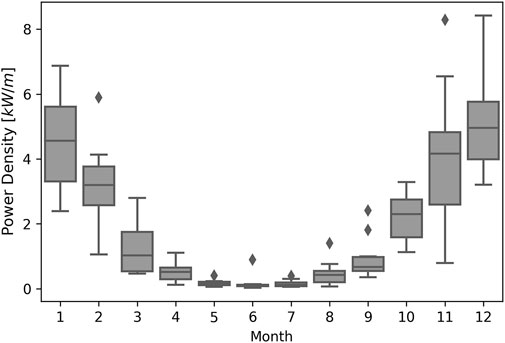
FIGURE 5. Box-plot of the monthly means of wave power density at the NOITS derived from 10-year wave data. Lines inside box and upper and lower box boundary are median and 75th and 25th percentiles, respectively. Error bars indicate 95% confidence intervals, and diamonds are data falling outside 95% confidence intervals.
Annual and seasonal wave rises are given in Figure 6, showing the directional distribution (22.5° bins) of the wave power density. Annually, most of the wave energy transfers into the NOITS from SWW to NW direction, which corresponds to the propagation direction of the two most energetic seasons (i.e., DJF and SON). The occurrence of the >3 kW/m wave power density during DJF and SON is 30.3% and 18.0%, respectively. Mean wave directions in DJF and SON are within the 90° interval from SW to NW, due to the East Asian Monsoon in these seasons. No major wave direction was observed for MAM and JJA.
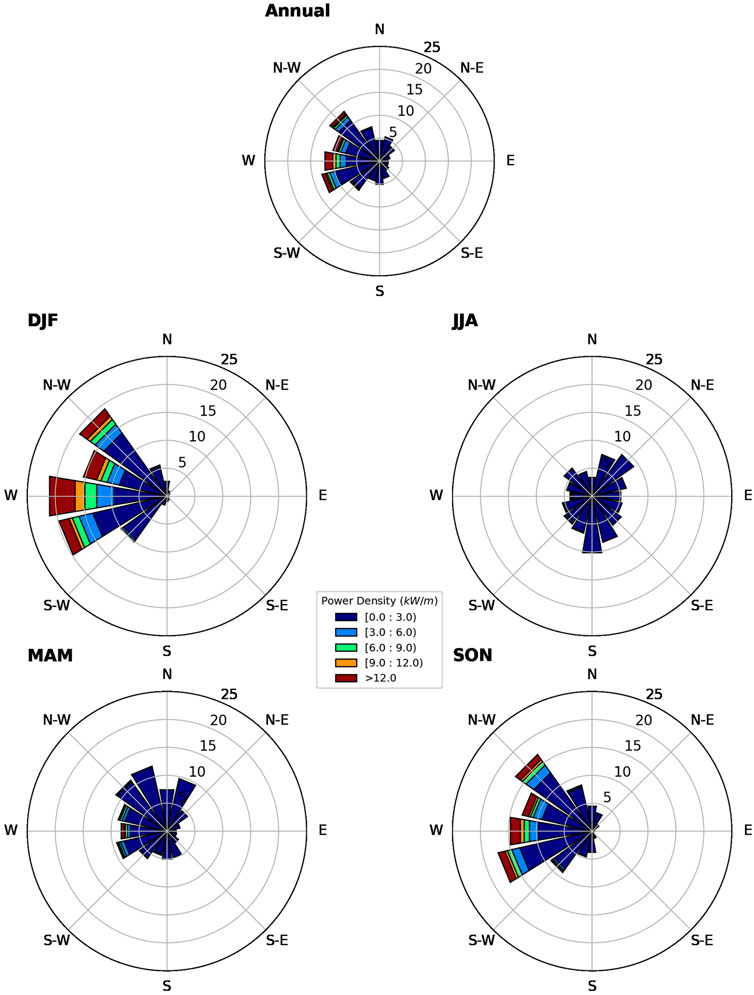
FIGURE 6. Annual and seasonal wave rise of wave power density at NOITS from the 10-year wave data.
The bivariate scatter plot of Hs and Te (Figure 7) shows the occurrence of binned sea states from the 10-year data. Mostly, waves in this area are mild as the 50, 90, and 99 percentiles of wave power density are 0.37 kW/m, 3.46 kW/m, and 9.64 kW/m, respectively. The largest portion of sea states is in the bins of 0–0.5 m in Hs and 1–4 s in Te. These wave conditions are not applicable to the molarity of existing full-scale WEC, and therefore NOITS has been designed as a scale prototype test site.
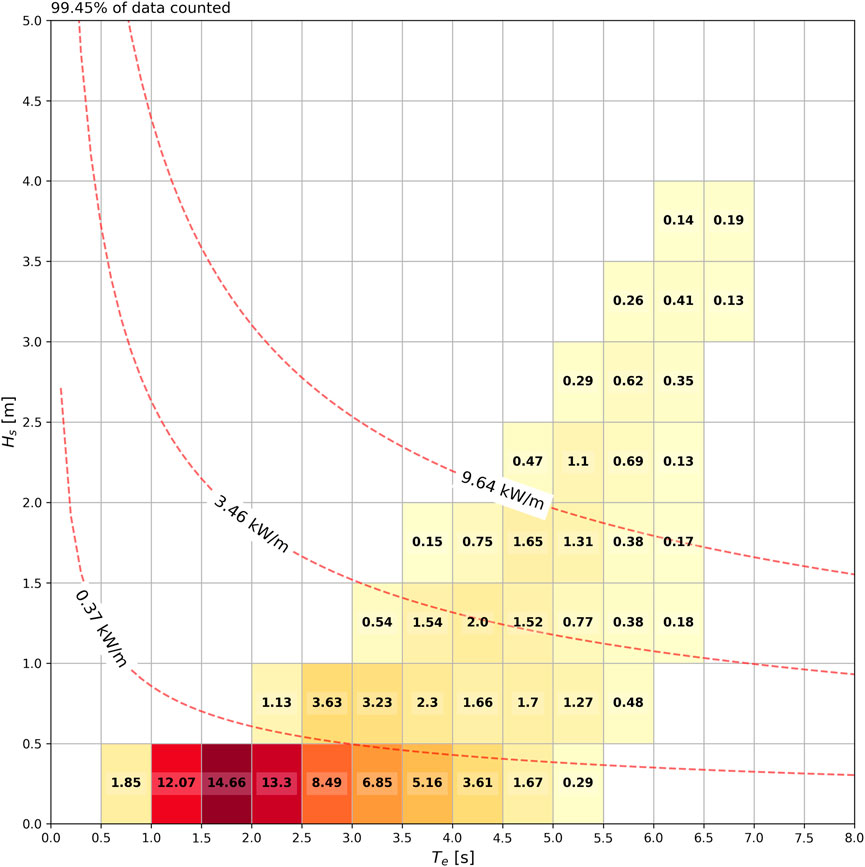
FIGURE 7. Scatter plot of Hs and Te at the NOITS from the 10-year data, with curves indicating 50, 90, and 99 percentiles of wave power. The number represents the occurrence (%) of the corresponding wave condition.
Figure 8 presents the energy spectrum under different significant wave height and energy period conditions. For each subplot bin, the x-axis is the frequency and the y-axis is the energy density, with N denoting the occurrence of a certain wave condition. The red curves indicate the mean spectrum for the bin, and the upper and lower bounds are shown as shadows. Since most WECs are designed to be narrow-banded, that is, they have a high energy conversion efficiency only in a narrow frequency range Prendergast et al. (2020); this information can help designers understand whether their device is suitable for this site.
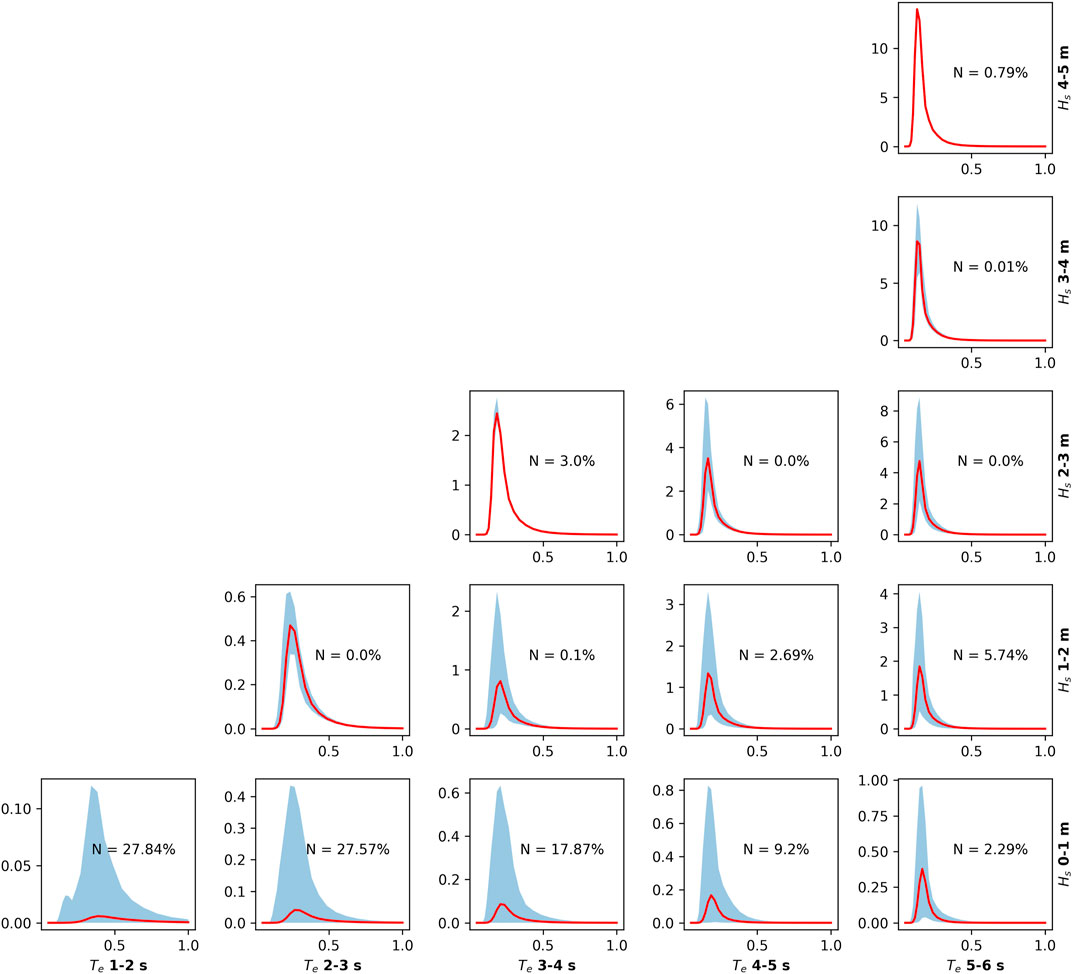
FIGURE 8. Wave spectral variation (frequency (Hz) on the x-axis and energy density (m2/Hz) on the y-axis) binned by Hs and Tm01. Red curves are the mean spectrum, and blue areas are the upper and lower bounds of the spectrum.
For a better understanding of the extreme wave conditions that can be encountered and to guide the design of the prototype and its moorings, extreme wave condition estimations are required. Maximum likelihood estimate (MLE) fitting is applied to Hs and Te, and extreme values are sampled with the peaks-over-threshold (POT) approach. Here, the thresholds for Hs and Te are set at 99th percentiles for both time series (i.e., 3.16 m and 6.32 s, respectively). Peaks exceeding these thresholds were extracted from the time series, and a minimum time interval of 24H was applied to ensure the independence of peak events.
Figure 9 shows the estimated return values of Hs and Te with the associated 95% confidence intervals (CIs). The difference between the 10-year and 50-year extremes is not substantial, with Hs and Te of the two differing by 0.57 m and 0.18 s, respectively. Compared to the seasonal mean Hs, the 10-year extreme wave height is approximately four times the mean Hs of DJF (0.93 m). In general, wave conditions at the test site are mild, with 10-year and 50-year wave extremes within the operating conditions of many WECs and most full-size mooring systems are able to cope with these conditions. Designers may consider lowering the specification of the mooring system to reduce test costs. It should be noted that the extreme values analyzed here are based on the statistically averaged wave height and period, which would underestimate the extreme values of the individual waves.
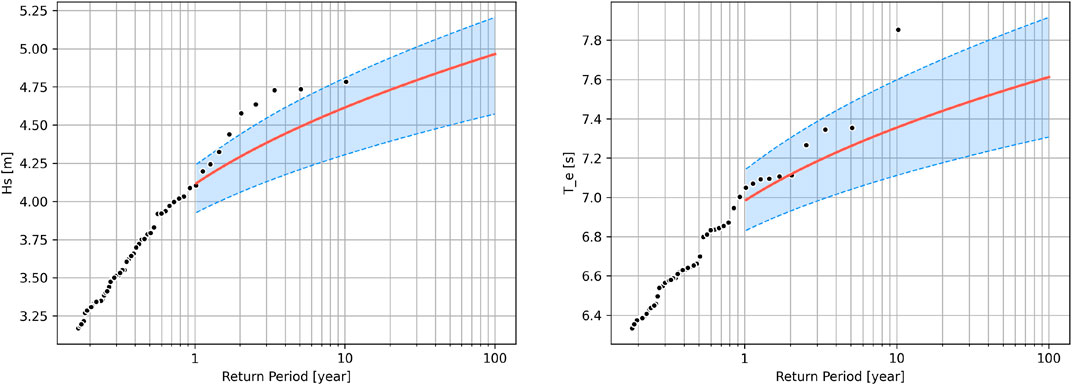
FIGURE 9. Estimated significant wave height (left) and energy period (right) with 95% confidence intervals (blue shadows) against the return period at NOITS.
Here, the Froude similarity is used to upscale the 10-year NOITS wave data at scale ratios of 2, 4, 6, and 8. Figure 10 is the annual bi-variate scatter plots of Hs and Te which present the distribution of wave conditions at different scales. The percentage of data presented in the figure is shown in the upper left corner because some extreme wave incidents are too far away from most of the data and therefore cannot fit into the scatter plot for demonstration. At scale ratio = 2, most of the upscaled waves are in the cells of Hs less than 1 m and Te between 1 and 6 s. With an increasing scale ratio, some unnatural “strong wind waves” (small period with large wave height) appear due to the square root relation between λ and Te.
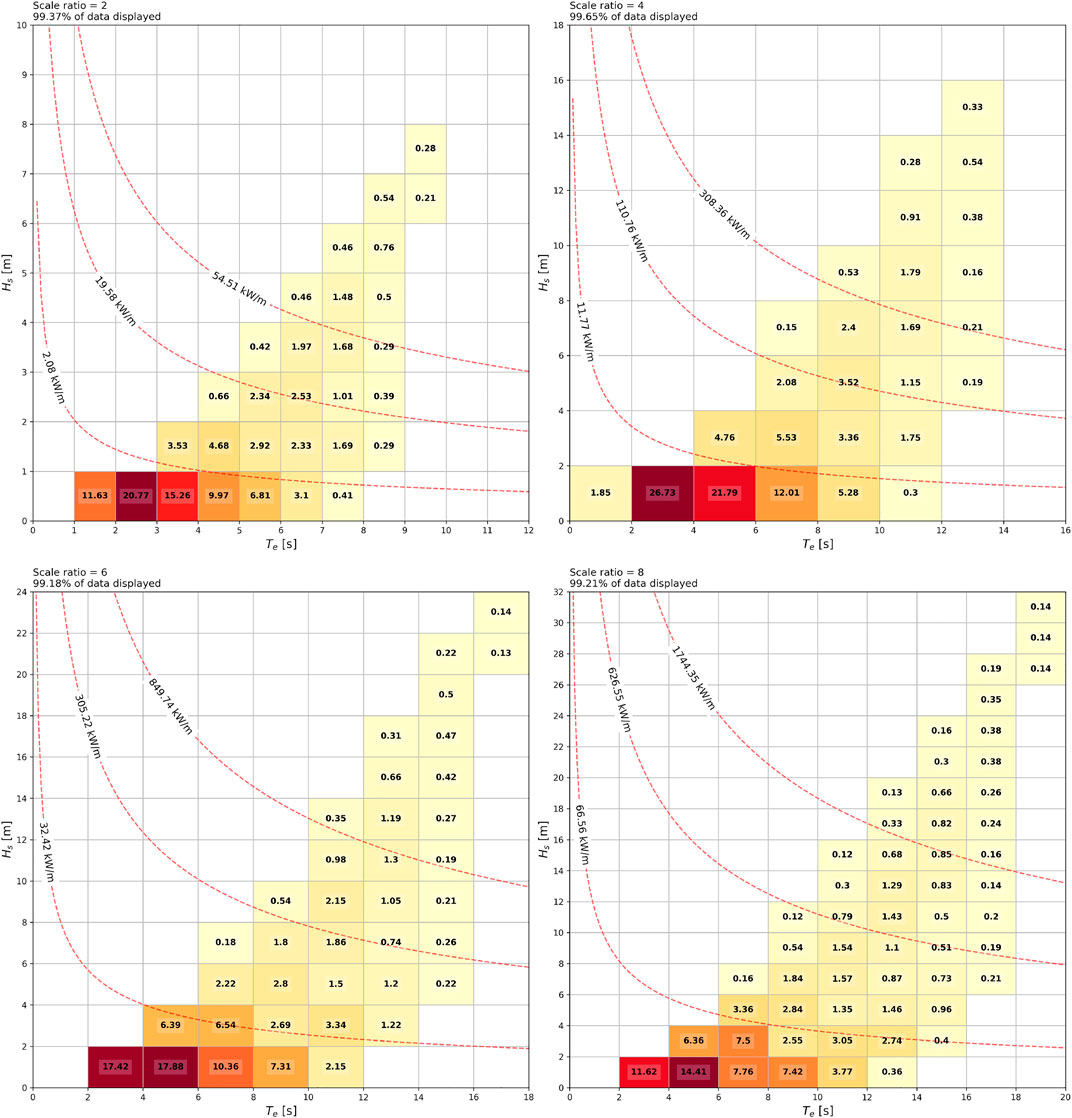
FIGURE 10. Joint occurrence of Froude-scaling Hs and Te at NOITS, with isobaths indicating 50th, 90th, and 99th wave power density. Numbers in each cell represent the occurrence (%) of the corresponding wave condition. Scale ratio and percentage of data presented are in the upper left corner of each sub-figure.
Four WECs are selected to demonstrate testing statics in NOITS at different scale ratios. The considered WECs are AquaBuOY (Weinstein et al., 2004), Pelamis (Henderson, 2006), Wave Dragon (Kofoed et al., 2006), and Shape Eagle II (Sheng et al., 2017), with rated power ranging from 120 kW to 7 MW and different types and dimensions, details of selected WECs are in Table 2. Two metrics are proposed to quantify the performance of the test and the suitability of the scale ratio. These are hours of operation, defined as how many hours of scaled wave conditions of a year or a season that fall within the working cells in the WEC’s power matrix; normalized energy production (NEP), defined as:
where EPn is the annual- or seasonal-equivalent full-scale energy production at different scale ratios and EPmax is the maximum of EPn. Note that the NEP values here only reflect the correspondence between the full-scale WEC power matrix and upscaled wave resource at a certain ratio and do not directly relate to the energy production of the WEC. The power matrices of AquaBuOY, Wave Dragon, and Pelamis were obtained from Silva et al.( 2013), and Sharp Eagle II’s power matrix was provided by the Guangzhou Institute of Energy Conversion, Chinese Academy of Sciences.
Figure 11 shows the hours of operation for these four WECs under different scale ratios at NOITS. Overall, for most WECs, averaged annual testing time increased with an increasing scale ratio until it peaks at a scale ratio around 8–11, except for Sharp Eagle, where the maximum test time is seen at a scale ratio between 5 and 6. However, the trend is inconsistent for seasons. All four WECs have less than 2000 h of operation at full-scale, with AquaBuOY and Pelamis having less than 1000 h. The longest testing time is available in DJF, followed by SON. This varies with an increasing scale ratio, and the testing time in MAM and JJA increases with the increasing scale ratio. Within the range of scale ratios we used, the spring and summer testing times for all four WECs are maximized at the smallest scale used here (scale ratio = 12). Hours of operation during DJF for WECs reach their maximum at different scales and then decrease as the scaled wave conditions become too harsh for the device. The optimal scale ratio in terms of testing time during winter is 4–5 for AquaBuOY, 3–4 for Wave Dragon and Pelamis, and 2–3 for Sharp Eagle II.
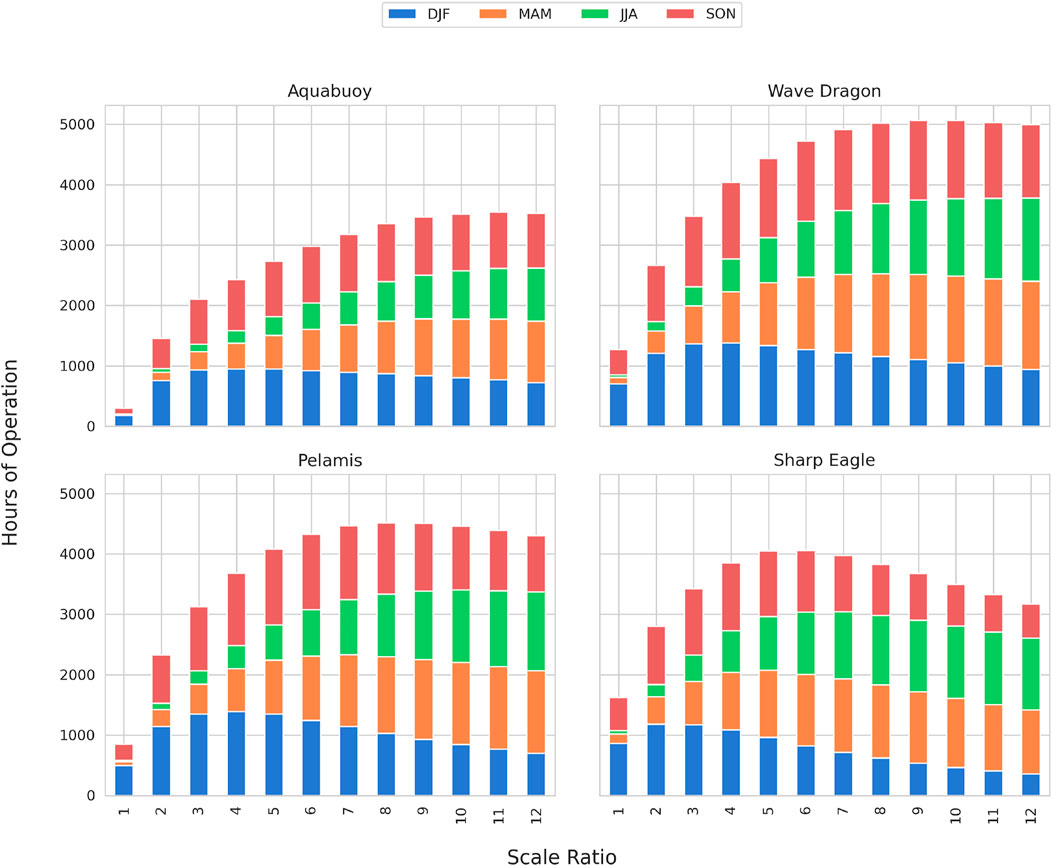
FIGURE 11. Annual hours of operation for four WECs under different scale ratios at NOITS. Stacked bars represent seasonal hours.
Compared to hours of operation, NEP focuses on the length of time that the upscaled wave resource meeting or close to rated power conditions of the WECs. As shown in Figure 12, the trend of NEP is similar to that of hours of operation, with the annual NEP of Sharp Eagle reaching its maximum at a scale ratio between 6 and 7, while the rest of WECs’ NEP peaks ranging at 12–16. NEP of DJF also has a tendency to increase with the increasing scale ratio and then decrease. The scale ratio for each WEC to reach the maximum NEP in winter ranged from 2 to 6, with Sharp Eagle, which has the lowest rated power (100 kW), reaching the maximum winter NEP at the smallest scale ratio value, followed by AquaBuOY, Pelamis, and Wave Dragon. A similar trend can also be observed in SON. However, NEP increased with the increasing scale ratio for all WECs in both MAM and JJA.
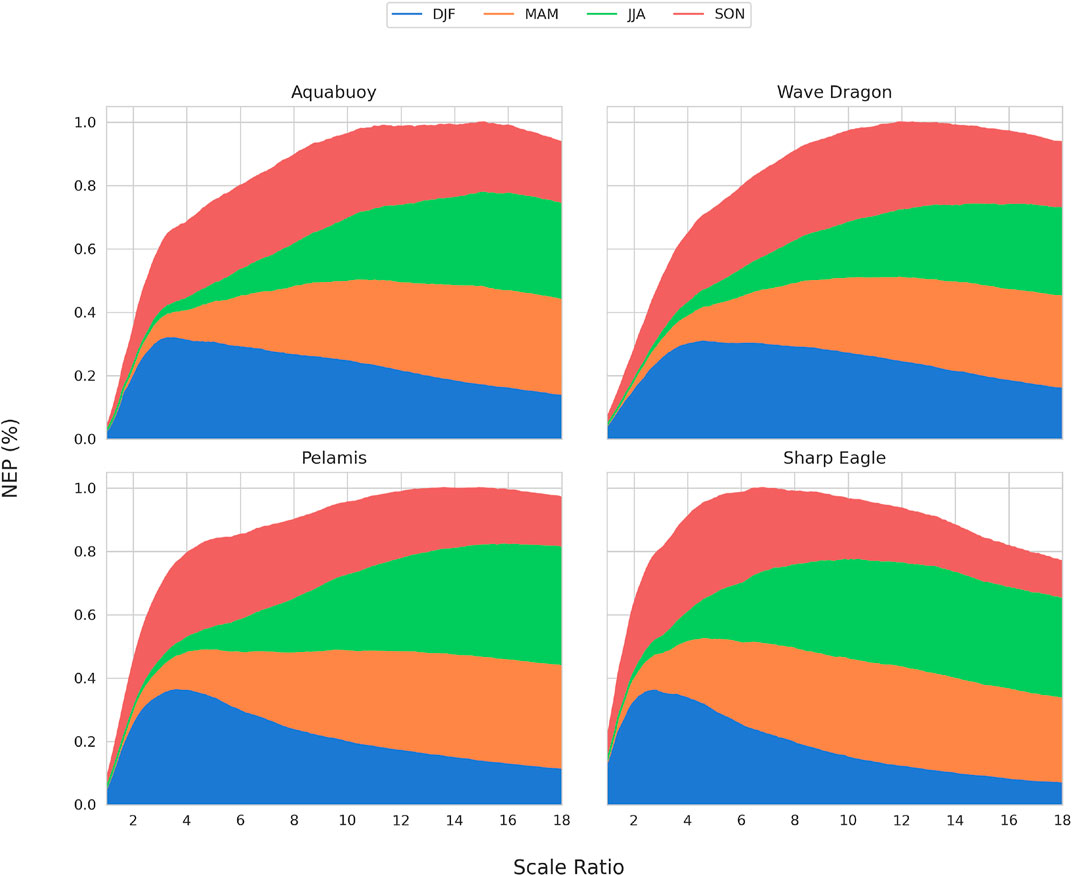
FIGURE 12. Normalized annual energy production for four WECs under different scale ratios at NOITS. Stacked colors represent normalized seasonal production.
Another important aspect is how wave conditions are distributed during “off-time”—where wave conditions exceed power matrix limits or fall in cells with no output in the power matrix. Wave conditions may be too mild for the WEC to start operating or too harsh that it goes into the survival mode. Hours with Hs and Te lower than the lower limits are defined as “under” conditions; hours with wave conditions exceeding the upper limits of the power matrix and with no output in the power matrix are defined as “over” conditions. Here, scale ratios of each WEC which can reach their maximum hours of operation are selected to dissect the “off-time,” which are 11, 10, 8, and 6 for AquaBuOY, Wave Dragon, Pelamis, and Sharp Eagle, respectively. Breakdown bars are shown in Figure 13. For Pelamis and Sharp Eagle, a similar pattern has been observed, where over condition dominates in DJF and SON and switches to under-dominance in MAM and JJA. Wave Dragon also shares this pattern, except that the two conditions take comparable hours in MAM. For AquaBuOY, most seasons are over-condition dominated except for JJA, probably due to its high requirement on Te, that is, ⩾ 6s. These results indicate that the season chosen for the test should correspond to the purpose of the test. For example, testing of survival mode reliability should be carried out during winter.
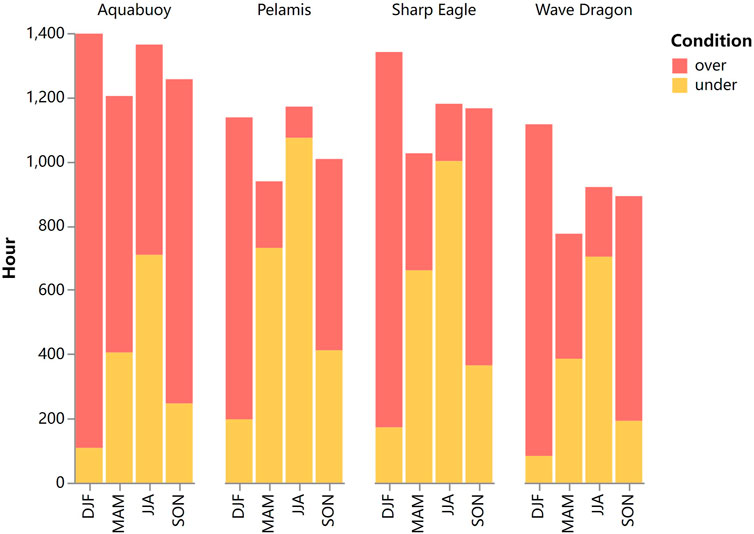
FIGURE 13. Breakdown of “off-time” for four WECs at scale ratios with maximum operation hours. Stacked bars represent over/under wave condition hours.
On the basis of the aforementioned findings, for the prototype to be tested at NOITS, a suitable scale ratio should be selected according to the operating wave conditions of the full-scale WEC, planned test season and duration, and test target (for example, efficiency or reliability). In general, in order to achieve sufficient testing hours, WECs with high-rated power need to be scaled down further compared to lower-rated power like Sharp Eagle. It is also advisable to examine whether the upscaled wave conditions at the test site can reproduce the wave conditions at the target area where the full-scale WEC may be deployed as carried out by Atan et al. (2018).
A nested SWAN model was used to obtain 10 years of high-resolution wave data at NOITS—an MRE test site in Weihai, China. We have investigated the spatio-temporal distribution of wave energy resources in NOITS and showed possible scenarios for WECs tested here. This assessment, including a thorough evaluation of wave resource variability and the analysis of extreme wave conditions, provides WEC developers with detailed information on wave resource characteristics on the test site.
Our analysis reveals a clear seasonal trend of wave resource, as the mean wave power density of NOIST is approximately 1.5 kW/m during DJF, less than 0.2 kW/m during JJA, and 0.37 kW/m throughout the year. Annually, the wave conditions with the highest occurrence are 0–0.5 m Hs with 1–4 s Te. Inter-annul uncertainty is much greater in months with high power density. For a 50-year extreme event, the significant wave height and energy period at NOIST are 4.86 m and 7.54 s, respectively.
Four WECs were selected to demonstrate the testing at NOIST at different scale ratios and quantified by hours of operation and normalized energy production. The maximum operation hours for the selected WECs are in the range of 3500–5000 h at their optimal scale ratios. Sharp Eagle’s normalizedannual energy production peaks are in the range of 1:5–1:6 scale, whereas other WECs need further scale down to 1:12–1:18 to maximize NEP. The results suggest that the ideal scale factor for WEC testing is dependent on the WEC’s specifications at full scale, the season in which the test is planned to be carried out, and the purpose of the test. Overall, NOIST is suitable for testing WECs with lower-rated power or early-stage prototypes of higher-rated-power WECs.
The raw data supporting the conclusion of this article will be made available by the authors, without undue reservation.
Conceptualization, HW and YF; methodology, YF, QZ, and BJ; validation, YF and QZ; formal analysis, YF; investigation, QZ; writing—original draft preparation, YF and HW; writing—review and editing, YF, XW, and BJ; visualization, YF; project administration, XW; funding acquisition, XW and HW. All authors have read and agreed to the published version of the manuscript.
This research was funded by the National Key R&D Program of China, under grant numbers 2017YFE0132000, 2019YFE0102500, and 2019YFB1504401, and National Natural Science Foundation of China under grant number 52078251.
The authors declare that the research was conducted in the absence of any commercial or financial relationships that could be construed as a potential conflict of interest.
All claims expressed in this article are solely those of the authors and do not necessarily represent those of their affiliated organizations, or those of the publisher, the editors, and the reviewers. Any product that may be evaluated in this article, or claim that may be made by its manufacturer, is not guaranteed or endorsed by the publisher.
Ahn, S., Neary, V. S., Allahdadi, M. N., and He, R. (2021). Nearshore Wave Energy Resource Characterization Along the East Coast of the United States. Renew. Energy 172, 1212–1224. doi:10.1016/j.renene.2021.03.037
Akpınar, A., Bingölbali, B., and Van Vledder, G. P. (2017). Long-Term Analysis of Wave Power Potential in the Black Sea, Based on 31-year SWAN Simulations. Ocean. Eng. 130, 482–497. doi:10.1016/j.oceaneng.2016.12.023
Atan, R., Goggins, J., Harnett, M., Agostinho, P., and Nash, S. (2016). Assessment of Wave Characteristics and Resource Variability at a 1/4-Scale Wave Energy Test Site in Galway Bay Using Waverider and High Frequency Radar (CODAR) Data. Ocean. Eng. 117, 272–291. doi:10.1016/j.oceaneng.2016.03.051
Atan, R., Goggins, J., and Nash, S. (2018). Galway bay – the 1/4 Scale Wave Energy Test Site? A Detailed Wave Energy Resource Assessment and Investigation of Scaling Factors. Renew. Energy 119, 217–234. doi:10.1016/j.renene.2017.11.090
Besio, G., Mentaschi, L., and Mazzino, A. (2016). Wave Energy Resource Assessment in the Mediterranean Sea on the Basis of a 35-year Hindcast. Energy 94, 50–63. doi:10.1016/j.energy.2015.10.044
García-Medina, G., Yang, Z., Wu, W.-C., and Wang, T. (2021). Wave Resource Characterization at Regional and Nearshore Scales for the U.S. Alaska Coast Based on a 32-year High-Resolution Hindcast. Renew. Energy 170, 595–612. doi:10.1016/j.renene.2021.02.005
González, J., Monagas, V., Delory, E., Hernández, J., and Llinás, O. (2011). “A Marine Test Site for Ocean Energy Converters: Oceanic Platform of the Canary Islands,” in OCEANS 2011 IEEE - Spain, 1–6. doi:10.1109/Oceans-Spain.2011.6003471
Gunn, K., and Stock-Williams, C. (2012). Quantifying the Global Wave Power Resource. Renew. Energy 44, 296–304. doi:10.1016/j.renene.2012.01.101
Henderson, R. (2006). Design, Simulation, and Testing of a Novel Hydraulic Power Take-Off System for the Pelamis Wave Energy Converter. Renew. Energy 31, 271–283. doi:10.1016/j.renene.2005.08.021
International Electrotechnical Commission (2015). Marine Energy - Wave, Tidal and Other Water Current Converters - Part 101: Wave Energy Resource Assessment and Characterization. Geneva, Switzerland: Tech. Rep. TS 62600-101:2015, IEC.
Jiang, B., Wu, G., Ding, J., Ma, C., Fang, Y., and Wang, X. (2019). Assessment of the Wave Energy Resource in the South China Sea. Proc. Institution Civ. Eng. - Marit. Eng. 172, 23–33. doi:10.1680/jmaen.2018.29
Kamranzad, B., and Lin, P. (2020). Sustainability of Wave Energy Resources in the South China Sea Based on Five Decades of Changing Climate. Energy 210, 118604. doi:10.1016/j.energy.2020.118604
Kofoed, J. P., Frigaard, P., Friis-Madsen, E., and Sørensen, H. C. (2006). Prototype Testing of the Wave Energy Converter Wave Dragon. Renew. Energy 31, 181–189. doi:10.1016/j.renene.2005.09.005
Lawrence, J., Sedgwick, J., Jeffrey, H., and Bryden, I. (2013). An Overview of the U.K. Marine Energy Sector. Proc. IEEE 101, 876–890. doi:10.1109/JPROC.2012.2235055
Lehmann, M., Karimpour, F., Goudey, C. A., Jacobson, P. T., and Alam, M.-R. (2017). Ocean Wave Energy in the United States: Current Status and Future Perspectives. Renew. Sustain. Energy Rev. 74, 1300–1313. doi:10.1016/j.rser.2016.11.101
Li, N., García-Medina, G., Cheung, K. F., and Yang, Z. (2021). Wave Energy Resources Assessment for the Multi-Modal Sea State of Hawaii. Renew. Energy 174, 1036–1055. doi:10.1016/j.renene.2021.03.116
López, I., Andreu, J., Ceballos, S., Martínez de Alegría, I., and Kortabarria, I. (2013). Review of Wave Energy Technologies and the Necessary Power-Equipment. Renew. Sustain. Energy Rev. 27, 413–434. doi:10.1016/j.rser.2013.07.009
Mears, C. A., Scott, J., Wentz, F. J., Ricciardulli, L., Leidner, S. M., Hoffman, R., et al. (2019). A Near-Real-Time Version of the Cross-Calibrated Multiplatform (CCMP) Ocean Surface Wind Velocity Data Set. J. Geophys. Res. Oceans 124, 6997–7010. doi:10.1029/2019JC015367
Morim, J., Cartwright, N., Etemad-Shahidi, A., Strauss, D., and Hemer, M. (2016). Wave Energy Resource Assessment along the Southeast Coast of Australia on the Basis of a 31-year Hindcast. Appl. Energy 184, 276–297. doi:10.1016/j.apenergy.2016.09.064
Neill, S. P., and Hashemi, M. R. (2013). Wave Power Variability over the Northwest European Shelf Seas. Appl. Energy 106, 31–46. doi:10.1016/j.apenergy.2013.01.026
Neill, S. P., and Hashemi, M. R. (2018). “Wave Energy,” in Fundamentals of Ocean Renewable Energy. Editors S. P. Neill, and M. R. Hashemi (Academic Press), 107–140. E-Business Solutions. doi:10.1016/B978-0-12-810448-4.00005-7
Pecher, A. (2017). “Experimental Testing and Evaluation of WECs,” in Handbook of Ocean Wave Energy. Editors A. Pecher, and J. P. Kofoed (Cham: Springer International Publishing), Ocean Engineering & Oceanography, 221–260. doi:10.1007/978-3-319-39889-1_9
Prendergast, J., Li, M., and Sheng, W. (2020). A Study on the Effects of Wave Spectra on Wave Energy Conversions. IEEE J. Ocean. Eng. 45, 271–283. doi:10.1109/JOE.2018.2869636
Qiu, S., Liu, K., Wang, D., Ye, J., and Liang, F. (2019). A Comprehensive Review of Ocean Wave Energy Research and Development in China. Renew. Sustain. Energy Rev. 113, 109271. doi:10.1016/j.rser.2019.109271
Rusu, E. (2018). Numerical Modeling of the Wave Energy Propagation in the Iberian Nearshore. Energies 11, 980. doi:10.3390/en11040980Publisher
Rusu, L., and Rusu, E. (2021). Evaluation of the Worldwide Wave Energy Distribution Based on ERA5 Data and Altimeter Measurements. Energies 14, 394. doi:10.3390/en14020394
Schmitt, P., and Elsäßer, B. (2017). The Application of Froude Scaling to Model Tests of Oscillating Wave Surge Converters. Ocean. Eng. 141, 108–115. doi:10.1016/j.oceaneng.2017.06.003
Sheng, S., Wang, K., Lin, H., Zhang, Y., You, Y., Wang, Z., et al. (2017). Model Research and Open Sea Tests of 100 kW Wave Energy Convertor Sharp Eagle Wanshan. Renew. Energy 113, 587–595. doi:10.1016/j.renene.2017.06.019
Silva, D., Rusu, E., and Guedes Soares, C. (2018). The Effect of a Wave Energy Farm Protecting an Aquaculture Installation. Energies 11, 2109. doi:10.3390/en11082109
Silva, D., Rusu, E., and Soares, C. (2013). Evaluation of Various Technologies for Wave Energy Conversion in the Portuguese Nearshore. Energies 6, 1344–1364. doi:10.3390/en6031344
South West of England Regional Development Agency (2006). Wave Hub Development and Design Phase Final Design Report. UK: Tech. rep., Halcrow Group Ltd.
The SWAN Team (2020). Scientific and Technical Documentation, SWAN Cycle III Version 41.31A. Netherlands: Tech. rep., The SWAN team.
van Nieuwkoop, J. C. C., Smith, H. C. M., Smith, G. H., and Johanning, L. (2013). Wave Resource Assessment along the Cornish Coast (UK) from a 23-year Hindcast Dataset Validated against Buoy Measurements. Renew. Energy 58, 1–14. doi:10.1016/j.renene.2013.02.033
Veigas, M., López, M., and Iglesias, G. (2014). Assessing the Optimal Location for a Shoreline Wave Energy Converter. Appl. Energy 132, 404–411. doi:10.1016/j.apenergy.2014.07.067
Wan, Y., Fan, C., Dai, Y., Li, L., Sun, W., Zhou, P., et al. (2018). Assessment of the Joint Development Potential of Wave and Wind Energy in the South China Sea. Energies 11, 398. doi:10.3390/en11020398
Wan, Y., Zhang, J., Meng, J., and Wang, J. (2015). A Wave Energy Resource Assessment in the China's Seas Based on Multi-Satellite Merged Radar Altimeter Data. Acta Oceanol. Sin. 34, 115–124. doi:10.1007/s13131-015-0627-6
Wang, Z., Dong, S., Dong, X., and Zhang, X. (2016). Assessment of Wind Energy and Wave Energy Resources in Weifang Sea Area. Int. J. Hydrogen Energy 41, 15805–15811. doi:10.1016/j.ijhydene.2016.04.002
Weinstein, A., Fredrikson, G., Parks, M. J., and Nielsen, K. (2004). “AquaBuOY - the Offshore Wave Energy Converter Numerical Modeling and Optimization,” in Oceans ’04 MTS/IEEE Techno-Ocean ’04 (IEEE Cat. No.04CH37600), 1854–1859. doi:10.1109/OCEANS.2004.1406425
Yang, S., Fan, L., Duan, S., Zheng, C., Li, X., Li, H., et al. (2020). Long-Term Assessment of Wave Energy in the China Sea Using 30-year Hindcast Data. Energy Explor. Exploitation 38, 37–56. doi:10.1177/0144598719878777
Yang, Z., García-Medina, G., Wu, W.-C., and Wang, T. (2020). Characteristics and Variability of the Nearshore Wave Resource on the U.S. West Coast. Energy 203, 117818. doi:10.1016/j.energy.2020.117818
Zheng, C.-w. (2021). Global Oceanic Wave Energy Resource Dataset-With the Maritime Silk Road as a Case Study. Renew. Energy 169, 843–854. doi:10.1016/j.renene.2021.01.058
Zheng, C. W., and Li, C. Y. (2015). Variation of the Wave Energy and Significant Wave Height in the China Sea and Adjacent Waters. Renew. Sustain. Energy Rev. 43, 381–387. doi:10.1016/j.rser.2014.11.001
Zheng, C., Xu, J., and Zhan, C. (2019). 21st Century Maritime Silk Road: Wave Energy Resource Evaluation. Singapore: Springer.
Keywords: wave energy, test site, SWAN, site scaling, WEC
Citation: Fang Y, Wu H, Zhou Q, Jiang B and Wang X (2022) A Detailed Investigation Into the Wave Energy Resource at a Small-Scale Ocean Energy Test Site in China. Front. Energy Res. 10:883553. doi: 10.3389/fenrg.2022.883553
Received: 25 February 2022; Accepted: 12 May 2022;
Published: 24 June 2022.
Edited by:
Adem Akpinar, Uludağ University, TurkeyReviewed by:
Onea Florin, Dunarea de Jos University, RomaniaCopyright © 2022 Fang, Wu, Zhou, Jiang and Wang. This is an open-access article distributed under the terms of the Creative Commons Attribution License (CC BY). The use, distribution or reproduction in other forums is permitted, provided the original author(s) and the copyright owner(s) are credited and that the original publication in this journal is cited, in accordance with accepted academic practice. No use, distribution or reproduction is permitted which does not comply with these terms.
*Correspondence: He Wu, d2hfY3JhbmVAMTYzLmNvbQ==
Disclaimer: All claims expressed in this article are solely those of the authors and do not necessarily represent those of their affiliated organizations, or those of the publisher, the editors and the reviewers. Any product that may be evaluated in this article or claim that may be made by its manufacturer is not guaranteed or endorsed by the publisher.
Research integrity at Frontiers
Learn more about the work of our research integrity team to safeguard the quality of each article we publish.