- State Grid Zhejiang Xinchang Electric Power Supply Co, Shaoxing, China
With the construction of new power systems, distributed power sources are connected in large numbers and the possibility of faults increases. The optimal allocation of repair resources is important to improve the fault management efficiency and the quality of power supply services in the producer–consumer community. Using a large number of historical fault resources accumulated in the producer–consumer community, we first preprocess the fault information by the rough set theory, then establish an optimal allocation model that minimizes the total fault loss, consider fault risk classification and repair response capability, and finally use the improved gray wolf optimization algorithm to perform the optimal calculation. To address the problems of the traditional gray wolf algorithm, tent mapping is introduced in the generation of the initial population to enhance the uniformity of the initial population. The cooperative competition mechanism is introduced to improve the utilization of effective information among individuals. Finally, the feasibility and superiority of the algorithm are verified through the analysis of calculation cases. Finally, the feasibility of this configuration method is verified through the analysis of arithmetic cases.
1 Introduction
With the deepening reform of China’s energy market and the development context of the transformation of the power system to low carbon, a large number of decentralized and small-scale distributed energy sources are bound to appear in the future distribution network (Bo et al., 2015; Mu et al., 2021). In recent years, under the pressure of climate change, people have become increasingly concerned about new energy sources, and with the steady construction of new power systems, the form of zonal autonomy among producer–consumer communities has become more and more obvious (Zhang et al., 2021). Variability and uncertainty, important characteristics of distributed renewable energy, will directly affect the possibility of fault occurrence within the producer–consumer community. Moreover, transformer–customer relationship management has become one of the latest challenges due to the large number of end customers in the low-voltage distribution system and the lack of measurement equipment (Zhao et al., 2021). This also makes it more difficult for the producer–consumer community to perform emergency repairs. When encountering power outages, customers are more concerned about service indicators such as “promptness of arrival,” “speed of repair,” and “satisfaction of service,” which put forward higher requirements for emergency repair resource allocation strategies. However, although a large amount of historical fault data resources is stored in the distribution system, they are not utilized. Therefore, it is necessary to improve the fault risk classification and repair response capability and to study the optimal allocation technology of repair resources for the producer–consumer community under the power resource-sharing mode.
Since DG is not able to support the stable operation of the load for a long time, the study of the fault rescue strategy is particularly important (Lu et al., 2018). The literature (Zhang et al., 2008) investigates the multi-objective rescue strategy in the case of multiple faults and proposes a genetic topology hybrid algorithm to optimize the rescue strategy by determining the distribution network fault information through the topology analysis method. In the literature (Lu et al., 2011), a multi-objective mathematical model of multi-team repair is used for rapid restoration of faulty distribution networks, and the switching operation variables and repair control variables in the model are combined to obtain repair strategies using an optimized multi-objective bacterial population convergence algorithm, which improves the repair efficiency. In the literature (Deng et al., 2017), a two-layer decision model was established, with the maximum efficiency of the emergency repair grid as the goal in the upper layer and the minimum scheduling cost as the goal in the lower layer. The KKT (Karush–Kuhn–Tucker) condition was used to convert the two-layer model into a single layer, and the model was solved by an optimized genetic algorithm. Fault recovery and fault repair are two phases, and some scholars have jointly optimized the two phases (Huang et al., 2014; Yang et al., 2016). In the literature (Huang et al., 2014), a simple joint model of fault and repair was developed, and the repair path was obtained by the enumeration method. In the literature (Yang et al., 2016), the maximum restoration value and the minimum economic loss are the inner and outer objective functions in the repair and restoration phase, respectively, and the minimum network loss and the minimum repair time are the inner and outer objective functions in the repair and grid restoration phases, respectively, to restore the lost load using DG and emergency generators, etc. Most of the existing studies combine fault recovery and fault repair into two phases, without considering the load fluctuation during the repair process, ignoring the synergistic optimization of fault recovery and fault repair and reducing the recovery efficiency.
In this study, we propose an optimal allocation method for emergency repair resources in a producer–consumer community considering fault risk classification and emergency repair response capability. The simulation results show that the optimal allocation of repair resources can significantly improve the reliability of power supply services and reduce potential fault losses.
2 Preprocessing of Fault Information Based on the Rough Set Theory
Fault information data are the information source for fault risk assessment and the basic component of the in-depth knowledge mining process (Chen et al., 2021). In order to solve the problems of diversity, noise, and incompleteness of the original data in fault information, discovering the characteristic attributes and classification knowledge from a large amount of sample data and performing attribute simplification, data preprocessing such as data cleaning and integration, incomplete data completion, and data discretization are required (Tian et al., 2016).
2.1 Fault Data Cleaning and Integration
As one of the most important attributes of fault information, the time of fault occurrence and power restoration can be extracted from the data recorded in the original ledger. This time information includes year, quarter, month, day, and hour. of this time point, which can be used for statistical analysis of fault time properties in different depths in all aspects, and also indirectly to obtain information such as fault duration to test the self-healing, repairability, and timeliness of maintenance personnel after the damage occurred in this grid. As one of the most important attributes of fault information, the time of fault occurrence and restoration of power can be extracted from the data recorded in the original ledger. The time information includes year, quarter, month, day, and hour, which can be used to analyze the temporal characteristics of the fault in different depths, and also to indirectly obtain information such as the duration of the fault, in order to test the self-healing, repairability, and timeliness of maintenance after the damage of the power grid here.
The cause of the outage is one of the most important risk factors affecting the results of the grid fault risk assessment, which is mainly extracted from the data recorded in the original ledger to describe the responsibility and cause of the grid outage.
The fault level mainly refers to three levels extracted from the data recorded in the original ledger based on the severity of the fault, i.e., I, II, and III level faults. This fault attribute represents the severity of the consequences of the fault that is important in risk assessment, i.e., the severity of the fault occurrence commonly used in the original risk assessment.
2.2 Incomplete Fault Data Patching
In this study, in order to improve the correctness of the algorithm and to obtain the most realistic complementary data that better fits the possibility of the system, we use the idea of clustering to select similar samples when selecting data samples. The smaller the distance, the higher the similarity. The formula for calculating the “distance” between the two samples is:
where
The ROUSTIDA method is based on the identifiable matrix in the rough set as an algorithm to reflect the invisible inner law embodied in the information system as much as possible, and its basic goal is to keep the incomplete object as much as possible with the same property law of similar objects in the original system, i.e., the value difference is as small as possible.
Let the information table system be
where
Let the initial information system be
First, for randomly selected data, a simple discretization is performed.
1) Fault duration a1 [0 ∼ 1.5, 1.5 ∼ 5.0, 5.0 ∼ 15.0, and 15.0–506.4]
2) Fault level a2 [Class I failure, Class II failure, and Class III failure]
3) Faulty equipment a3 [Overhead lines and electric sin lines, transformers and busbars, equipment on column, and user equipment]
4) Cause of failure a4 [Problems with the equipment itself, external damage, weather, user impact, and system issues]
2.3 Fault Data Discretization
Since the fault frequency varies with the size of the selected sample base range, this study chooses to use the combination of the equal distance and equal frequency method and draws on the idea of “adjacent attribute value midpoint” to process the original data against the division of the original frequency range.
Let the equidistance division method be based on the number of intervals
Similarly, the equal frequency method divides the value domain of the numerical property interval
Let the equal distance and equal frequency correspond to the first
3 Emergency Repair Resource Optimization Allocation Model
3.1 Objective Function
This study constructs an optimization model for the allocation of emergency repair resources in the producer–consumer community with the objective of minimizing the total potential fault loss. The objective function is as follows:
where W1 and W2 are the weight values of the fault risk classification and fault repair response capability, respectively. Si represents the fault subline classification of each producer and consumer, Li represents the distance between the repair station and each producer, and Vi represents the speed between the repair station and each producer.
3.2 Fault Risk Classification
In this study, two aspects, frequency and time, as well as percentage indicators, are selected to deal with the quantification of fault risk in the producer–consumer community in a certain way. Based on the fault attribute categories derived from the collation and with reference to the regulations, such as the “Power Supply Reliability Regulations for Power Supply Systems,” and combined with the assessment process, indicators such as the number of fault occurrences, the percentage of fault attributes, the average outage time of faults, and the probability of faults are selected.
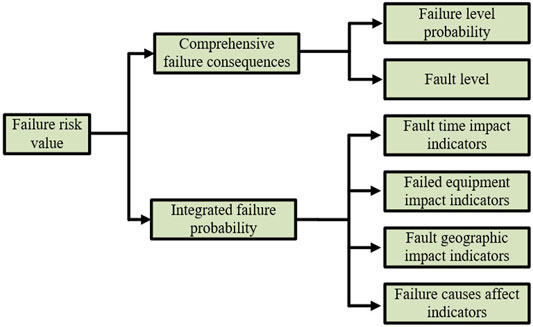
In order to evaluate the risk of outage in the producer–consumer community, the risk calculation method presented in this study is to establish a fault benchmark risk index system, as shown in Figure 1 quantify the probability and consequence of fault occurrence to obtain the fault probability and consequence values, which initially reflect the risk value of fault outage and then consider the influence of the remaining fault attributes and other factors on the probability of fault occurrence and the consequence of fault, and perform the corresponding calculation to obtain the integrated fault probability value and integrated fault consequence value. The calculation is based on these values.
Based on the concepts related to risk assessment, the formula for the failure risk value can be derived:
Since the risk of failure in the producer–consumer community does not depend only on itself but also is influenced by factors related to the geographical area of the failure and the weather of the failure, etc., and the influence of the remaining attributes of the producer–consumer community indicator system on the main risk indicators is introducedas follows:
1) Number of failures, n
Within the statistical data information, the number of failures under different fault attributes is indicated by n, and the statistical unit is [times]. For example, the number of failures in different regions, the number of failures at different times, and the number of failures in different devices, etc.
2) Probability of failure properties,
Within the statistical data message, the proportion of the number of counts of the lower-level attributes of a fault attribute value to the total number of this fault attribute, is expressed as
3) Average power outage time for faults,
Within the statistical data information, the average number of hours of outages for fault outages, in statistical units [h/time], is expressed in
3.3 Fault Repair Response Capability
Based on the known geographical latitude and longitude information of the producer–consumer distribution, the distance between the producer–consumer and the ideal repair station is first calculated by applying the inverse half-positive sagittal function, then the time required to reach the repair location is calculated by considering the actual fault repair process, and finally the fault repair response capability is evaluated according to the required time.
1) Calculation of the distance between the producer and the ideal repair station
For any two points on the sphere, the semi-positive vector of the circular center angle can be calculated by the following equation:
where hav is an abbreviation for semi-positive vector function, d is the distance between two points, r is the radius of the ball,
Substitute to get
2) Calculation of the time required to rush to the repair site
Considering the fault repair process, the road congestion coefficient and road curvature coefficient can be set to
3) The calculation of the maximum time to repair the road
Assuming that the total time specified by the power company to reach the emergency repair site at the latest is
Time constraint
The aforementioned equation is a time constraint on the time required to travel from the repair station to the point of failure.
The latitude and longitude of the repair station are greater than the minimum latitude and longitude of the producer and less than the maximum latitude and longitude.
4 Improving Gray Wolf Optimization Algorithm
For the aforementioned model of optimal allocation of resources for the community of production and consumption consumers, this study uses a particle swarm-based improved gray wolf optimization algorithm to solve it. Its mathematical model is simple, with few parameters, and easy to operate (Taha and Elattar, 2018). The programming is easy to implement. By referring to the rank ordering of wolf packs and hunting techniques, respectively, each solution is graded and searched, until the optimal solution is found.
4.1 Population Initialization Based on Tent Mapping
The more uniformly the initial population is distributed in the search space, the better it is for improving the efficiency of the algorithm in finding the best solution and the accuracy of the solution. The initial gray wolf population of the traditional gray wolf optimization algorithm is randomly generated, which means it cannot guarantee that the initial population of individuals is uniformly distributed in the solution space. Chaotic sequences have better randomness, regularity, and traversal characteristics. Compared with other mappings, the tent mapping can generate a more balanced distribution of sequences, so the tent mapping is used to initialize the gray wolf population (Tian et al., 2021).
Tent mapping expressions
When
Based on the tent mapping, the population
where
4.2 Competition and Cooperation Mechanism
In the GWO algorithm, the individuals of the population follow
where
4.3 Adaptive Adjustment of Weighting Coefficients
In order to meet the requirements of the GWO algorithm in different iteration cycles for finding the best and to improve the convergence speed and the accuracy of finding the best, adaptive inertia weights are introduced in the position update
where
The value of
The improved position equation is shown in Eqn. 3-7—Eqn. 3-9.
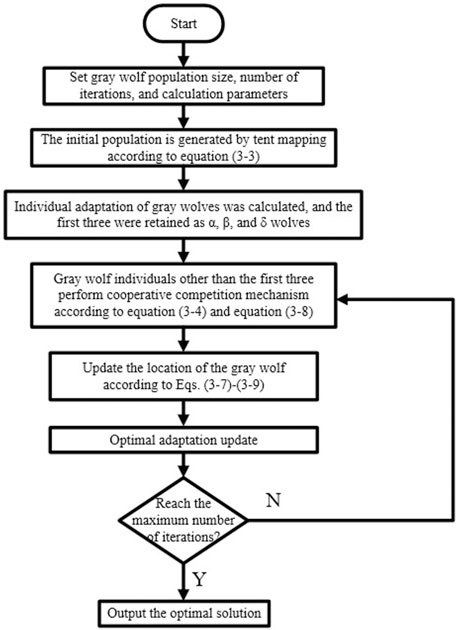
The flow chart is shown in Figure 2.
5 Case Study
In this study, an optimization model with the objective of minimizing the total fault loss is developed considering the fault risk classification and the emergency response capability, and the model is solved Intel Core i5-8400 by invoking GUROBI8.0.1 software under the MATLAB 2018b platform through the YALMIP toolbox with the computer parameters of Intel Core i5-8400 Q1BVQDIuODA= GHz and 8 GB memory.
5.1 Basic Data Sources
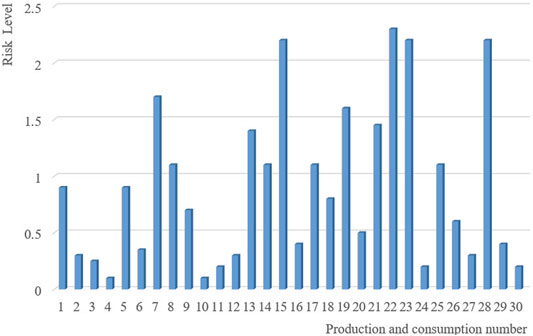
The data are collected from the distribution network fault data provided by a city power company in the south for the year 2020–2021. In total, three randomly distributed producers and consumers in a square producer–consumer community with the same length and width are selected as the study case of the repair resource allocation optimization algorithm. The fault risk classification of the producers and consumers is shown in Figure 3.
By preprocessing the historical failure data of three randomly distributed producers and consumers in a square producer–consumer community with both length and width of 3 km, the failure risk value calculation formula is used to finally obtain the failure risk-grading map of producers and consumers shown in the aforementioned figure. From the information in the aforementioned figure, it can be seen that the failure risk level can be roughly divided into three categories: 0–0.5, 0.5–1.5, and 1.5 or more, among which the number of the first failure risk-level producers and consumers is the largest.
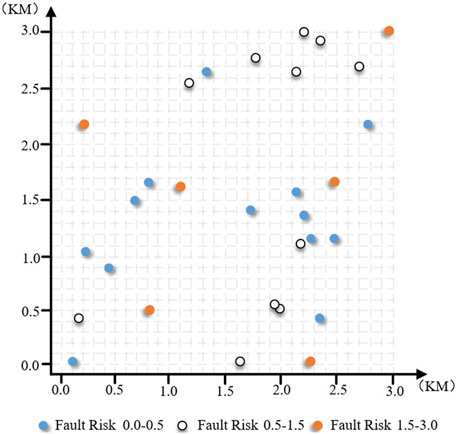
The distance between each producer and consumer is calculated using the latitude and longitude transformation method in 0.3 Section 2, and then the information of each point is displayed on the two-dimensional coordinate plane, and the producer–consumer configuration scenario shown as follows is obtained by combining the producer–consumer failure risk-grading situation as shown in Figure 4.
5.2 Optimization Results and Analysis
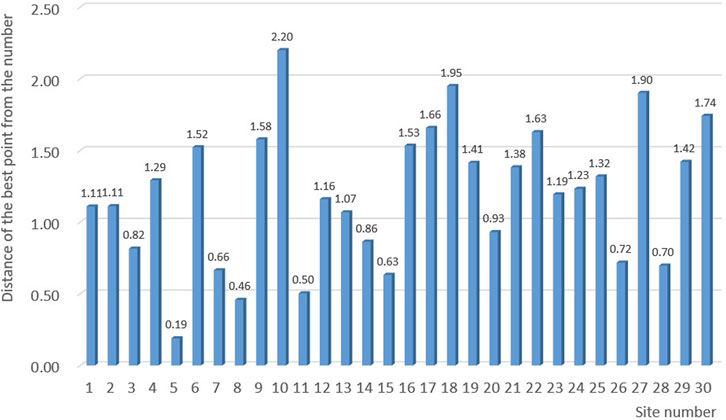
The convergence curve of the optimization process, the distance map of the optimized robotic stationing point, the comparison of the results of different algorithms, and the information of the optimal solution are shown in Figures 5, 6, Tables 1, 2, respectively.
The aforementioned figure shows the iterative process of the optimization model. At the beginning of the iteration, the algorithm adaptation is large and the change in the value of the objective function fluctuates; as the iteration proceeds, the corresponding total potential fault loss gradually decreases. After about 200 iterations, the optimization model adaptation consistency variable converges to the same value, i.e., the global optimal solution is obtained.
To further illustrate the performance of the algorithm proposed in this article, the algorithm is compared with the particle swarm algorithm and the traditional gray wolf optimization algorithm, and each algorithm is performed 20 times independently, and then the average value is calculated, and the calculation results are shown in Table 1.
As can be seen from Table 1, the optimal solution of this algorithm is better than that of the traditional gray wolf optimization algorithm and particle swarm algorithm. Also, the algorithm is improved by introducing tent mapping chaos initialization, introducing a cooperative competition mechanism, and introducing adaptive inertia weights in generating the initial population. The comparison of the average number of iterations and the average time consumed by the three algorithms shows that this algorithm can take into account both the global and local searchability. It is not only better than the other two methods in terms of the number of convergence iterations, but also the average number of iterations is around 143, and the convergence time is shorter. Compared with the traditional gray wolf optimization algorithm, the speed is improved by 30.76%.
As can be seen in Table 2, when the objective function of minimizing the total potential failure loss is taken into account, the weight values of the failure risk classification and the repair response capability of the producer and consumer are set to 0.6 and 0.4, respectively, based on which the optimal stationing point coordinates obtained by solving the optimization model are 1.772 and 1.433, respectively. The total potential failure loss is 0.8496, and the distance between the repair stationing point and each producer and consumer is shown in Figure 6.
Comparing the average distance and potential loss of fault between the stationing point and the producer and consumer before and after optimization, as shown in Table 3, the average distance is reduced by 10.21% after optimization; the potential loss of fault is reduced by 17.38% mainly because the optimized deployment of repair resources makes the repair resources closer to the high-risk fault in the region.
6 Conclusion
In this study, we propose an optimal allocation method for emergency repair resources in the producer–consumer community considering fault risk classification and emergency repair response capability. First, we preprocess the fault information by the rough set theory, then establish an optimal allocation model to minimize the total fault loss, consider fault risk classification and emergency repair response capability, and finally use the improved gray wolf optimization algorithm for the optimal search calculation. By improving the initial population generation, adaptive weight adjustment, and inter-individual information exchange, the ability of the algorithm to jump out of the local optimum and the efficiency of the optimization search are improved. Through the analysis of the optimization results, it is concluded that the proposed algorithm and the optimization strategy of repair resources are effective in reducing the potential fault loss and optimizing the repair station optimization, which have certain practical significance. In fact, the spatial correlation between the emergency repair resource allocation point and each producer and consumer is very complex and is not a simple straight-line distance. The model designed in this study does not consider the actual road distribution, and the subsequent research should first combine the real geographic information of GIS, then add the road influence factors into the model and give sufficient weights, and finally, build a more perfect resource allocation optimization model. The aforementioned problems can be studied in depth if necessary in the future.
Data Availability Statement
The raw data supporting the conclusion of this article will be made available by the authors, without undue reservation.
Author Contributions
The authors’ individual contributions are as follows: DM: data collation, formal analysis, and methodology; JQ: supervision and writing (original manuscript). All authors have read and agreed to the published version of the manuscript.
Funding
The study was funded by the Research and Application of One-stop Operation and Inspection Technology for Distribution Network Based on Multi-model Identification project and Double Innovation Project of Zhejiang Electric Power Company C511JZ200000.
Conflict of Interest
Authors DM and JQ were employed by State Grid Zhejiang Xinchang Electric Power Supply Co, Shaoxing, 312500, China.
The authors declare that the research was conducted in the absence of any commercial or financial relationships that could be construed as a potential conflict of interest.
Publisher’s Note
All claims expressed in this article are solely those of the authors and do not necessarily represent those of their affiliated organizations, or those of the publisher, the editors, and the reviewers. Any product that may be evaluated in this article, or claim that may be made by its manufacturer, is not guaranteed or endorsed by the publisher.
References
Bo, T., Chen, Q., Gao, Z., and Zhu, C. (2015). “Fuzzy Comprehensive Risk Assessment of Distribution Network Fault Based on Rough Set [C],” in IEEE PES Asia-Pacific Power and Energy Engincering Conference APPEEC, Brisbane, QLD, Australia, 15-18 Nov. 2015 (IEEE).
Chen, G., Li, D., and Chen, X. (2021). A Low False Alarm Rate Power Theft Detection Method Based on Improved XGBoost Model[J]. Power Syst. Prot. Control 49 (23), 178–186. doi:10.19783/j.cnki.pspc.210094
Deng, C., Liu, Y., Tan, Y., Yu, X., and Liu, J. (2017). A Method for scheduling power emergency resources considering the grid restoration process [J]. Power Grid. Tech 41 (11), 3582–3589. doi:10.13335/j.1000-3673.pst.2017.0688
Huang, X, Yang, Y, and Fan, W (2014). Joint optimization model for multi-fault repair and power supply restoration in distribution networks[J]. Power Syst. Automation 38 (11), 68–73. doi:10.1109/ICAML51583.2020.00091
Lu, ZG, Li, D, Lv, X, Zhao, S, and Hou, X (2018). Multi-fault repair strategy of distribution network under ice disaster containing distributed power supply[J]. J. Electrical Eng. Tech. 33 (02), 423–432. doi:10.19595/j.cnki.1000-6753.tces.160919
Lu, ZG, Sun, B, Liu, Z, and Yang, L (2011). A Rush Repair Strategy for Distribution Networks Based on Improved Discrete Multi-Objective BCC Algorithm After Discretization. Power Syst. Automation 35 (11), 55–59.
Mu, C, Ding, T, Dong, J, Ning, K, Dong, X, He, Y, et al. (2021). Development of decentralized peer-to-peer multi-energy trading system based on private blockchain[J]. Chinese. J. Electrical Eng. 41 (03), 878–890. doi:10.13334/j.0258-8013.pcsee.200392
Taha, I. B. M., and Elattar, E. E. (2018). Optimal reactive power resources sizing for power system operations enhancement based on improved grey wolf optimiser. IET Generation, Transmission & Distribution 12 (14), 3421–3434. doi:10.1049/iet-gtd.2018.0053
Tian, S, Liu, L, Shurong, W, Fu, Y, Yang, M, and Liu, S (2021). Dynamic reconfiguration of distribution network based on improved grey wolf optimization algorithm[J]. Power System Protection and Control 49 (16), 1–11. doi:10.19783/j.cnki.pspc.201356
Yang, LJ, Lv, X, Li, D, Wang, M, Lu, ZG, and Yu, Q (2016). Optimization strategy for multi-fault rescue and recovery coordination in distribution networks containing distributed power sources[J]. Power Syst. Automation 40 (20), 13–19. doi:10.1016/j.energy.2015.03.101
Zhang, J, Zhang, P, and Huang, S (2008). A multi-fault repair strategy for distribution networks based on genetic topology hybrid algorithm[J]. Power System Automation 22, 32–35+60.
Zhang, K., Zhou, B., Or, S. W., Li, C., Chung, C. Y., and Voropai, N. (2022). Optimal coordinated control of multi-renewable-to-hydrogen production system for hydrogen fueling stations. IEEE Trans. on Ind. Applicat. 58, 2728–2739. doi:10.1109/TIA.2021.3093841
Keywords: production and consumption community, fault risk classification, emergency response capability, optimal configuration, improved gray wolf algorithm
Citation: Mao D and Qiu J (2022) Optimal Allocation of Emergency Repair Resources for Producer–Consumer Communities Considering Fault Risk Classification and Emergency Repair Response Capability. Front. Energy Res. 10:881081. doi: 10.3389/fenrg.2022.881081
Received: 22 February 2022; Accepted: 13 April 2022;
Published: 24 May 2022.
Edited by:
Jian Zhao, Shanghai University of Electric Power, ChinaReviewed by:
Yi He, Hong Kong Polytechnic University, Hong Kong, SAR ChinaDazhong Ma, Northeastern University, China
Zhekang Dong, Hangzhou Dianzi University, China
Copyright © 2022 Mao and Qiu. This is an open-access article distributed under the terms of the Creative Commons Attribution License (CC BY). The use, distribution or reproduction in other forums is permitted, provided the original author(s) and the copyright owner(s) are credited and that the original publication in this journal is cited, in accordance with accepted academic practice. No use, distribution or reproduction is permitted which does not comply with these terms.
*Correspondence: Jinyi Qiu, NzYzNDM0NDUxQHFxLmNvbQ==
 Donghua Mao
 Jinyi Qiu