 Dongliang Hu
 Yongguang Cheng
 Pengcheng Zhang1
94% of researchers rate our articles as excellent or good
Learn more about the work of our research integrity team to safeguard the quality of each article we publish.
Find out more
ORIGINAL RESEARCH article
Front. Energy Res., 10 May 2022
Sec. Process and Energy Systems Engineering
Volume 10 - 2022 | https://doi.org/10.3389/fenrg.2022.880293
This article is part of the Research TopicInternal Flow Mechanism of Modern Hydraulic MachineryView all 20 articles
To meet the demand of the power grid for flexible regulation, pump turbines have to frequently and fleetly stop, start, and transition between different modes, causing many instability problems. To solve the problems, understanding the complex flow and pressure pulsation features in different working conditions is the prerequisite. In this study, the flow patterns, pressure pulsations, cavitation characteristics, and runner forces of a prototype pump-turbine working under the five operating modes were displayed and analyzed based on computational fluid dynamics simulations. It is shown that when working points are near the pump and turbine design working points, the flow is smooth, with small pressure pulsation and without cavitation; however, when working points deviate from the optimal ones, flow patterns become worse and cavitation appears. In the pump-brake mode, the flow hits the runner blades violently, causing obvious pressure and runner force fluctuations. In the hump region, the flow has a strong impact on the guide vanes, and the rotating stall vortices are apparent in the vane area. In the S-shaped region, pressure pulsations are the highest with prominent rotor–stator interaction and rotating stall. Under similar working conditions, a larger guide-vane opening corresponds to a larger pressure pulsation amplitude. On the spatial distribution, the largest pressure pulsations happen in the vaneless space.
Driven by the “Emission Peak and Carbon Neutrality” goal, the excellent “regulator” function of pumped storage becomes more and more prominent in the new energy-dominated modern energy system. As the core equipment of pumped storage power stations, pump turbines directly affect the safe, stable, and flexible operation of the power stations. To meet the demand of the power grid for flexible regulation, pump turbines have to frequently and fleetly stop, start, and transition between different modes, causing many instability problems. To solve the problems, understanding the complex flow and pressure characteristics in different working conditions is the prerequisite. The full characteristic curves of pump turbines are usually expressed on the four-quadrant pump-turbine characteristics, on which the five operating modes are defined: Pump, pump-brake, turbine, turbine-brake, and reverse pump. In these modes, the pump-turbine operates in the positive or negative rotation direction and positive or negative flow direction. The flow patterns, pressure pulsations, cavitation characteristics, and runner forces in different operating modes are quite different and not well understood. Most of the existing studies focused on the narrow normal operating regions and the two special operating regions, namely, the hump and S-shaped regions. Also, there are no systematic and comprehensive descriptions of the flow characteristics in the whole region. The descriptions of the changes and distributions of characteristics across the five operating modes on the four-quadrant characteristics plane are of great reference values to runner design and pressure pulsation study for transient processes, during which the working point fleetly slides across different modes or regions.
In recent years, three-dimensional (3D) computational fluid dynamics (CFD) has become an important means to study flow patterns and pressure pulsations of pump turbines and can accurately predict pressure pulsation characteristics (Yan et al., 2013), cavitation characteristics (Celebioglu et al., 2017), the S-shaped characteristics (Liu et al., 2013), and the hump characteristics (Ran et al., 2011) and has played an important role in finding general laws and revealing underlying mechanism. There have been many studies on the formation mechanism and flow characteristics of the two highly unstable regions (Zuo et al., 2016), the S-shaped region and the hump region.
For the studies on the S-shaped region, Ji and Lai (2011) claimed that the high-speed and high-pressure water retaining ring at the runner inlet is the cause of unit start-up difficulty at low heat in the S-shaped region. Widmer et al. (2011) pointed out that the stable stall vortex and rotating stall vortex structures in the vaneless space block the flow, causing the local pressure to rise in the area near the vortex structure and leading to the S-shaped characteristics. Xiao R. et al. (2012) and Xiao Y. X. et al. (2012) pointed out that pre-opening guide vanes are an effective method to improve stability in the S-shaped region, however, with limitations. Zhang et al. (2011) claimed that the pressure pulsations in the vaneless space reach the largest when the working point is in the S-shaped region. Zhang et al. (2019) further pointed out that the pressure pulsation amplitude near the runaway working point is the largest. After sorting out the distribution characteristics of pressure pulsations on the operating characteristic plane, it is equally important to analyze their causes, such as rotor–stator interaction, rotating vortex rope, rotating stall, and cavitation (Goyal and Gandhi, 2018). Hasmatuchi et al. (2011) claimed that when the working point deviates from the optimal one under the turbine mode, the pressure pulsation increases due to interference between the rotating stall and the flow channel after entering the turbine-brake zone, and the rotational speed of the rotating stall zone is about 70% of the rotational speed of the runner. Jun-Won et al. (2021) further pointed out that the frequency of rotating stall in the S-shaped region is 0.6 times the rotation frequency of the runner. Shang (2020) claimed that the effect of cavitation on the S-shaped characteristics is mainly reflected in the vortex structure in the vaneless space, and the changes in vortex structure and cavitation cavity volume have an effect on the pressure pulsation characteristics. Wang (2020) pointed out that when the cavitation coefficient decreases, the cavitation phenomenon arises and develops continuously, and when cavitation is more serious, the backflow vortex in the blade channel obstructs the flow, resulting in insufficient discharge capacity.
For the studies on the hump region in the pump operating mode, Wang and Guo (2018) claimed that the internal flow patterns of the pump-turbine become worse with the decrease of discharge. LI et al. (2017) pointed out that the main cause of the hump characteristic is that the vortex and flow separation in the guide-vane space block the flow channels. Li and Wang (2015) claimed that the hydraulic loss in the runner is also one of the main causes of the hump characteristics’ formation. It has also been found that the generation of the hump characteristics is also related to cavitation near the suction surface of the runner blade leading edge (Li et al., 2021), which reduces the head of the pump-turbine (Liu et al., 2012); the reduction of the cavitation coefficient has a significant effect on the hump characteristic curve (Ješe et al., 2014) and runner forces (Zhu et al., 2021).
For studies on pressure pulsations in pump turbines, Wang et al. (2013) claimed that the more distant the working point deviates from the optimal one, the greater the pressure pulsation amplitude, and the blade passing frequency is dominant in the vaneless space. Also, Wu et al. (2021) pointed out that when the discharge decreases to zero, the amplitude of pressure pulsation in the vaneless space increases with the guide-vane opening, and the blade passing frequency caused by rotor–stator interaction dominates at each monitoring point. In addition to rotor–stator interaction, the rotating stall is also an important cause of pressure pulsations in the hump region. Zhang C. Z. et al. (2017) claimed that the rotating stall usually occurs at part load in the pump mode, which can cause severe pressure pulsations. Ješe and Fortes-Patella (2016) claimed that the frequency of rotating stall changes with discharge. Xia et al. (2015) pointed out that the rotating stall occurs in the guide-vane areas under the pump mode and occurs in the runner under the pump-brake mode. Also, in order to study the causes and distribution characteristics of pressure pulsations under different modes, Zhang (2015) analyzed several working points in the four-quadrant plane and proposed that the low-frequency pulsation is mainly caused by the asymmetrically distributed pressures rotating at a speed slower than the runner rotational speed; the high-frequency pulsation is caused by the rotor–stator interaction; the low-amplitude pulsation occurs in the smooth-flow region; the high-amplitude pulsation occurs in the pump-brake mode, reverse pump mode, and S-shaped region.
In summary, the current research on the flow characteristics of pump-turbine has achieved rich results, but there were still shortcomings or missing aspects. Most of the existing research focused on the local working operation region, and there were only few panoramic descriptions of the characteristic distributions in the full operating zones (Zhang, 2015), and the cavitation and runner force characteristics were ignored in these works. This study aimed to display and interpret the distribution characteristics of flow patterns, pressure pulsations, cavitation characteristics, and runner forces in each operating condition, based on CFD simulations of a prototype pump-turbine. Also, we hope the resulting laws and mechanisms can provide a reference for related research and runner design. The following section introduces the numerical simulation conditions, including the computational model and mesh, solution settings, selection of simulated working points, and monitoring point arrangement. Section 3 shows the results and analysis, first giving the overall distribution characteristics of flow and pressure pulsation characteristics in the four-quadrant characteristics plane and then analyzing the flow and pressure pulsation characteristics and their formation mechanism in detail under each mode.
CFD simulations of a prototype pump-turbine of a pumped storage power station in China were conducted. The computational model is composed of the spiral-casing, guide-vane, runner, cone, and draft tube. To avoid boundary conditions’ effect on the results, two extending pipes were added to the spiral-casing inlet and the draft-tube outlet, respectively. The overall computational model and the meshes for the guide-vane and runner areas are shown in Figure 1. The relevant parameters of the pump-turbine are shown in Table 1.
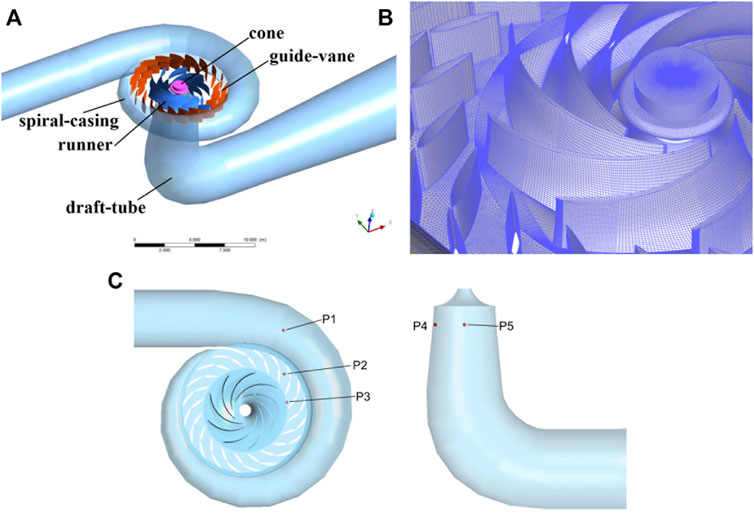
FIGURE 1. CFD computational model of the pump-turbine and schematic layout of monitoring points for pressure pulsations. (A) Computational domains. (B) Meshes in the runner and guide-vane areas. (C) The layout of monitoring points for pressure pulsations.

TABLE 1. Basic parameters of the pump turbine.
All the meshes were generated separately by using software ANSYS ICEM 19.0. Unstructured wedge mesh was used in the guide-vane domain, while structured hexahedral mesh was used in all the other domains. For the prototype pump-turbine with large dimensions in this study, the turbulence flow in the flow passage is well developed with the maximum Reynolds number of 7 × 10⁶ and the viscous sublayer thickness blew 1 mm, which is very smaller than the flow domain, it is almost impossible to meet
The simulations were conducted by using ANSYS FLUENT. The shear stress transport (SST)
For boundary conditions, the inlet and outlet of the turbine computational model were set as mass flow inlet and pressure outlet, respectively; the solid wall surfaces were set as the no-slip boundary condition, and the intersections of different mesh parts were treated as inner interfaces.
In the simulations, the single-phase flow simulation was performed first, and after the parameters approach stable then the ZGB cavitation model was opened. This means that the results of the single-phase flow simulation were used as the initial conditions of the two-phase flow transient simulations. The saturated vapor pressure is 3,540 Pa and the SIMPLEC scheme was used in the pressure-velocity coupling; the timestep was set to 0.001 s, which is corresponding to 1.5° of runner rotation at the rated speed; the convergence residual target values for continuity, velocities, k,
A total of 29 working points on the 4-quadrant characteristic plane were specially selected for the simulations. They are at 37° (the rated guide-vane opening), 43° (slightly greater than the rated opening), and 12° (near the no-load opening), with the 0-speed point, 0-discharge point, normal working points, and the points deviated far from the design working points covered. The simulated results are drawn on the n11-Q11 (unit speed against unit discharge) and n11-M11 (unit speed against unit torque) characteristic planes, and compared with the model test measured curves provided by the manufacturer (
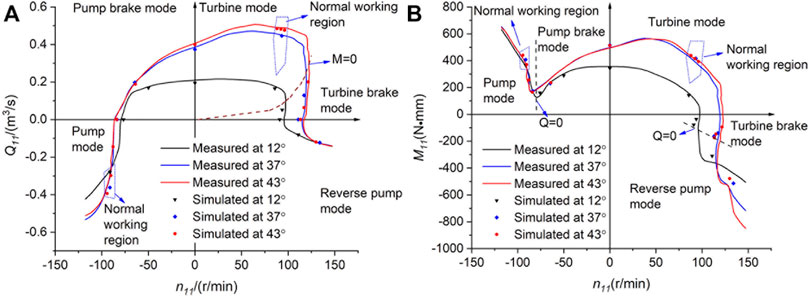
FIGURE 2. Comparison between CFD simulation and model test. (A) n11-Q11 characteristic curves. (B) n11-M11 characteristic curves.
To obtain the pressure pulsation characteristics, some monitoring points were arranged as shown in Figure 1C, where 1# point was located in the spiral-casing, 2# point was located in the guide-vane channel, 3# was located in the vaneless space, and 4# and 5# were located at the draft-tube inlet. All the monitoring points were located in the middle section of the flow channel.
For uniformity of description, in the following sections, the classification of blade inlet and outlet, as well as the blade suction and pressure surfaces, is based on the normal operating conditions of the turbine mode. The directions of runner rotation and the water spiral are both described in the overhead view. Also, the axial forces are positive in the upward direction.
To better illustrate the pressure pulsation distribution patterns across different operating modes and at different monitoring points in a normalized standard, the pressure coefficient
where
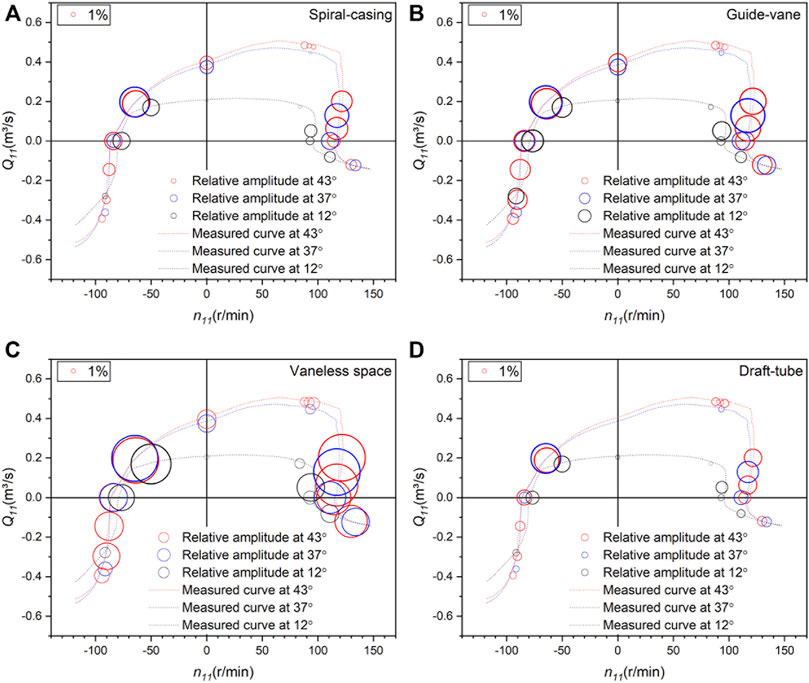
FIGURE 3. Distributions of
It can be seen that the distribution laws of pressure pulsations across the four-quadrant characteristic plane at each location of the pump-turbine under different opening degrees are similar, with the relative amplitude of pressure pulsation (
Pressure pulsations of the pump-turbine are closely related to flow patterns, and worse flow patterns can lead to severe pressure pulsations. We present an overview of the general flow patterns in each operating condition by taking the rated opening of 37° as an example. Figures 4A,B show the flow patterns in the guide vane and runner, and in the draft tube, respectively. The velocity triangle (U is the peripheral velocity, W is the relative velocity, and V is the absolute velocity) in Figure 4A corresponds to the location of the red dot.
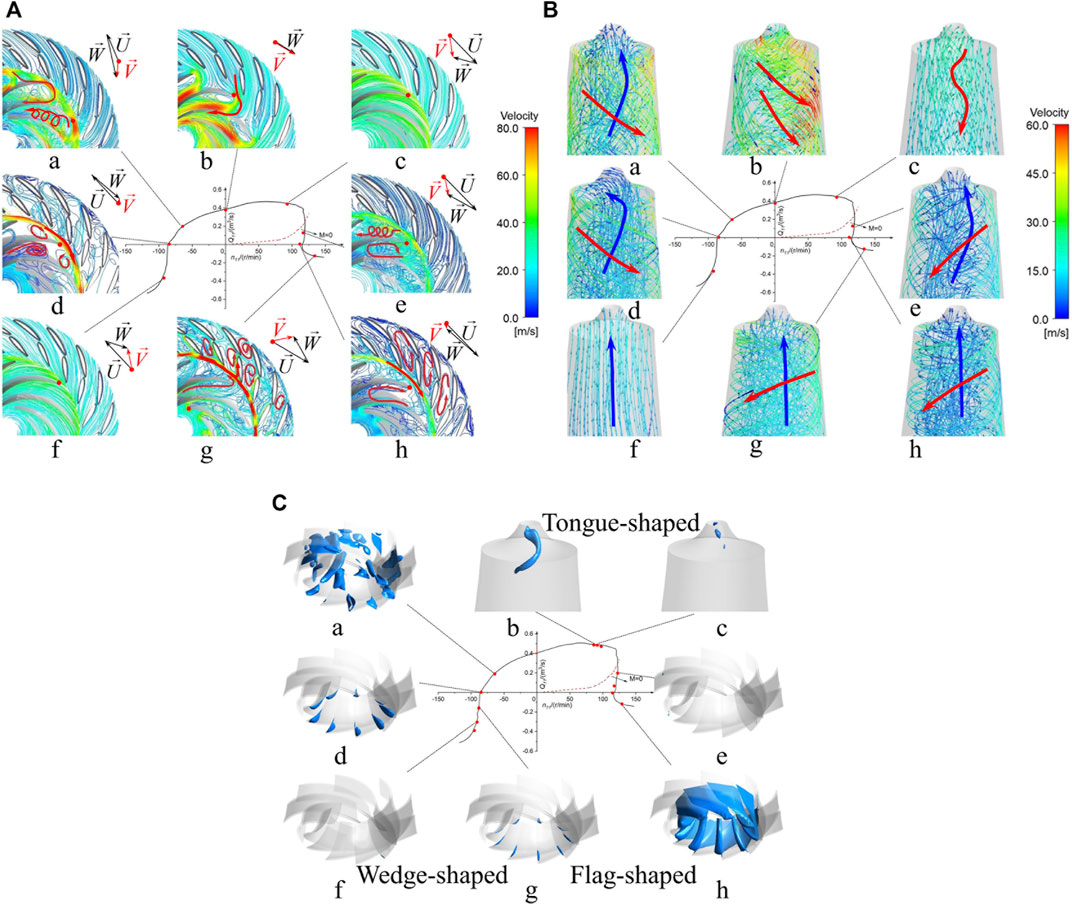
FIGURE 4. Flow patterns and cavitation patterns for different working points. (A) Flow patterns in guide-vanes and runner at opening 37°. (B) Flow patterns in the draft tube at opening 37°. (C) Cavitation patterns at opening 43°(WVVF = 0.1).
In both the normal working regions of the pump (Figure 4Af) and turbine (Figure 4Ac) modes, the streamlines are smooth; in the pump mode, the water flows upwards in the draft tube (Figure 4Bf), and in the turbine mode, the water flows smoothly downwards but with a slight spiral in the center of the draft-tube due to the vortex rope (Figure 4Bc).
When the working condition deviates from the normal working regions, the flow inside the turbine is turbulent. At the pump 0-discharge point (Figure 4Ad) there are a large number of backflows and vortices inside the runner, with a circumferential flow water ring in the vaneless space. Also, at the turbine 0-discharge point (Figure 4Ah), vortices generate inside the guide vane and backflow occurs in the runner channels. Under the reverse pump mode (Figure 4Ag), the water flows upwards along the suction surface of the runner blades, then hits the guide vanes, and then, partly flows into the vane channels in the direction of the guide-vane surface, and the other flows forward to the next vane channel; thus, the vortex inside the guide-vane is obvious. In the pump-brake mode (Figure 4Aa), the flow enters the runner and impacts strongly with the pressure surface of the blades, and the water flows in a spiral manner in the runner channels. Under the turbine-brake mode (Figure 4Ae) the flow in the runner is extremely turbulent and forms a spatial spiral transverse flow at the runner inlet, creating backflow and vortices along the pressure surface of the blades. As for the flow patterns in the draft tube, in all these off-design conditions, the water spirally flows downwards near the wall and flows upwards in the center of the draft tube. The flows in the pump 0-discharge point (Figure 4Bd, pump-brake mode (Figure 4Ba), and 0-speed point (Figure 4Bb) are counterclockwise (overhead view) spiral near the wall, and in the turbine-brake mode (Figure 4Be), the turbine 0-discharge point (Figure 4Bh) and reverse pump mode (Figure 4Bg) are clockwise spiral.
When the unit is operating at a large opening of 43°, cavitation of various shapes and sizes is generated at most working points, therefore, we take this opening as an example to show the cavitation distribution patterns across modes, as shown in Figure 4C, in which the water vapor volume fraction (WVVF) is selected as 0.1. The cavitation volume is small at high discharge pump points (Figure 4Cf) and the wedge-shaped cavitation occurs near the shroud side of the suction surface of the trailing edges of some runner blades. As the discharge decreases, cavitation deepens and occurs at every runner blade (Figure 4Cg). And cavitation deepens further at the pump 0-discharge point (Figure 4Cd). Under the pump-brake mode (Figure 4Ca) the internal cavitation of the runner is extremely serious, with a large area of cavitation inside the blade channels. Under the high discharge turbine conditions (Figures 4Cb,c), cavitation occurs inside the rotating vortex rope in the draft tube in the form of a helical tongue, with the volume of cavitation decreasing as the discharge decreases. Under the turbine-brake mode (Figure 4Ce) the volume of a cavitation becomes small, and the cavitation occurs mainly on the leading edges of the runner blades. Under the reverse pump mode (Figure 4Ch), there is a large area of flag-shaped cavitation in the rear half of the pressure surface of the runner blades.
Figure 5A gives the mean, maximum, and minimum axial forces of the pump-turbine at each working point at different openings. Here the axial force represents the force of the main flow channel. In the normal working regions of the turbine mode and pump mode, the mean axial force is the largest but the fluctuation of the axial force is the smallest. On the contrary, in the off-design regions, the mean axial force is small, but the fluctuation is large, especially in the pump-brake and turbine-brake modes. In the pump-brake mode, the axial force fluctuation is the largest, with an amplitude of over
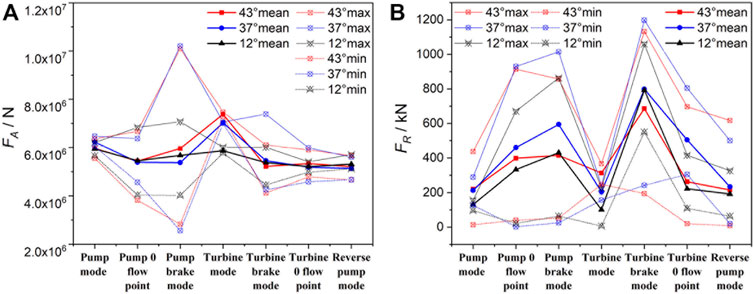
FIGURE 5. Variation of runner forces under different working conditions. (A) Axial force (FA). (B) Radial force (FR).
The radial force (the resultant force of x and y directions) variation is slightly different from the axial force, as shown in Figure 5B. The average value and fluctuation of radial force in the normal working regions of the turbine mode and pump mode are both small, which reflects the smooth operation of the unit. But under the pump-brake and turbine-brake modes, the average value of radial force reaches the extreme values of about 1000 kN, and the difference between the maximum and minimum values is also large. The serious radial force fluctuations may cause strong vibrations in the runner shaft system. The radial force fluctuations are also high under the remaining unfavorable operating conditions such as the pump 0-discharge and turbine 0-discharge points, and the reverse pump mode.
In general, as the opening decreases, the axial and radial force fluctuations are reduced under most operating modes.
In the following sections, we will discuss the mechanism and correlations of flow characteristics and give a more detailed description of the flow characteristics in each operating mode.
When the pump-turbine is operating in the pump mode, the rotation direction of the runner is counterclockwise, pumping water upstream. When it operates near the design working point, there is no obvious flow impact and separation inside the blade channels (Figure 6A). As the discharge decreases, the angle between the absolute velocity V and the peripheral velocity U reduces and the flow hits the guide vane significantly, which makes the flow more turbulent in the guide-vane channels. And when the discharge is low, the water flowing out of the runner forms a circumferential flow of high-speed water ring, impeding the flow into the guide vanes, and the flow separation is serious in the guide-vane area. The internal flow patterns of the runner are similarly smooth in the normal working regions of the pump mode at different openings (Figures 6A–C). But at the small opening of 12°, the water entering the guide-vane area continues flowing in the direction of the pressure surface of the guide vane, forming a vortex and serious separation in the vane channels (Figure 6C).
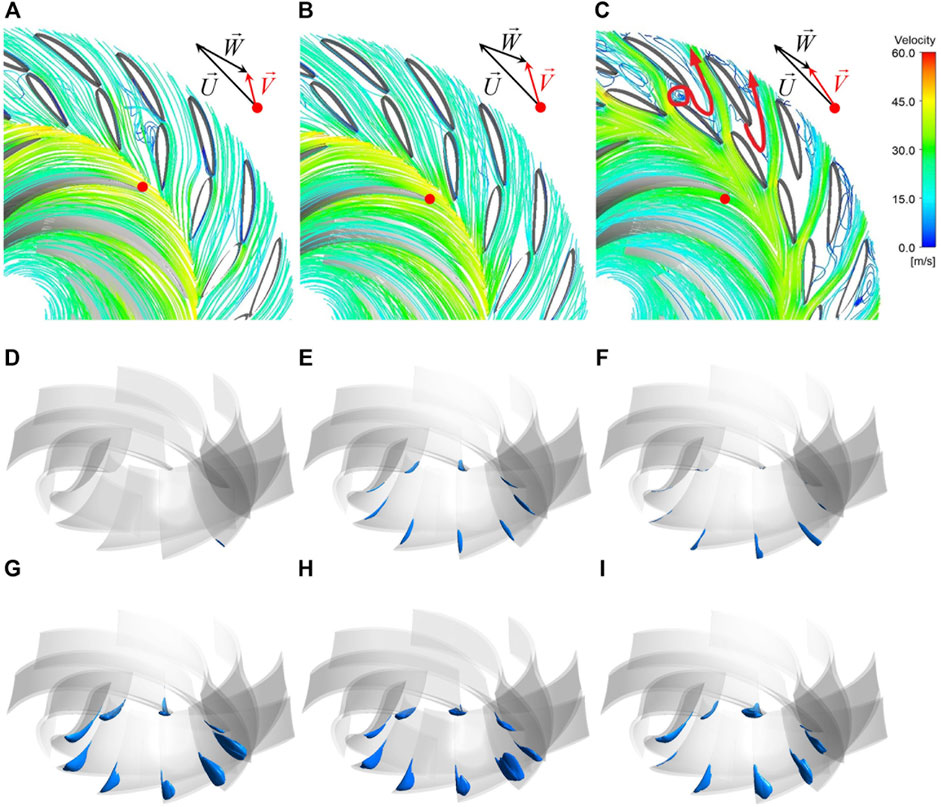
FIGURE 6. Flow patterns (A–C) and cavitation cavity patterns (D–I) of different working points within pump mode at different openings (WVVF = 0.1). (A) 43° (Q = 150 m3/s). (B) 37°. (C) 12°. (D) 43° (Q = 120 m3/s). (E) 43° (Q = 60 m3/s). (F) 12° (Q = 110 m3/s). (G) 43° (Q = 0 m3/s). (H) 37° (Q = 0 m3/s). (I) 12° (Q = 0 m3/s).
Under the pump mode, the wedge-shaped cavitation caused by flow separation occurs at the trailing edge of the runner blades and the location is near the shroud side of the suction surface, as shown in Figure 6. The degree of cavitation deepens and the volume of cavitation increases as the discharge decreases, corresponding to the deterioration of the flow pattern, no cavitation occurs at the 43° high discharge working point and 37° working point calculated in this study but occurs at the small opening 12°. When the discharge is further reduced to 0, more pronounced cavitation occurs at the three openings and the area of occurrence is unchanged (Figures 6G–I).
Runner forces are closely related to flow patterns, the radial force in the better operating conditions has a pronounced periodicity, as shown in Figures 7A,B (the graph shows the variation of the radial forces on the whole runner over one cycle of runner rotation). In small-discharge and small-opening conditions the periodicity is damaged due to the turbulent flow. As the discharge decreases the radial force increases, at the pump 0-discharge point (Figure 7C), the periodicity of radial forces is severely damaged, and the fluctuations are violent, the largest radial force can reach 900 kN.
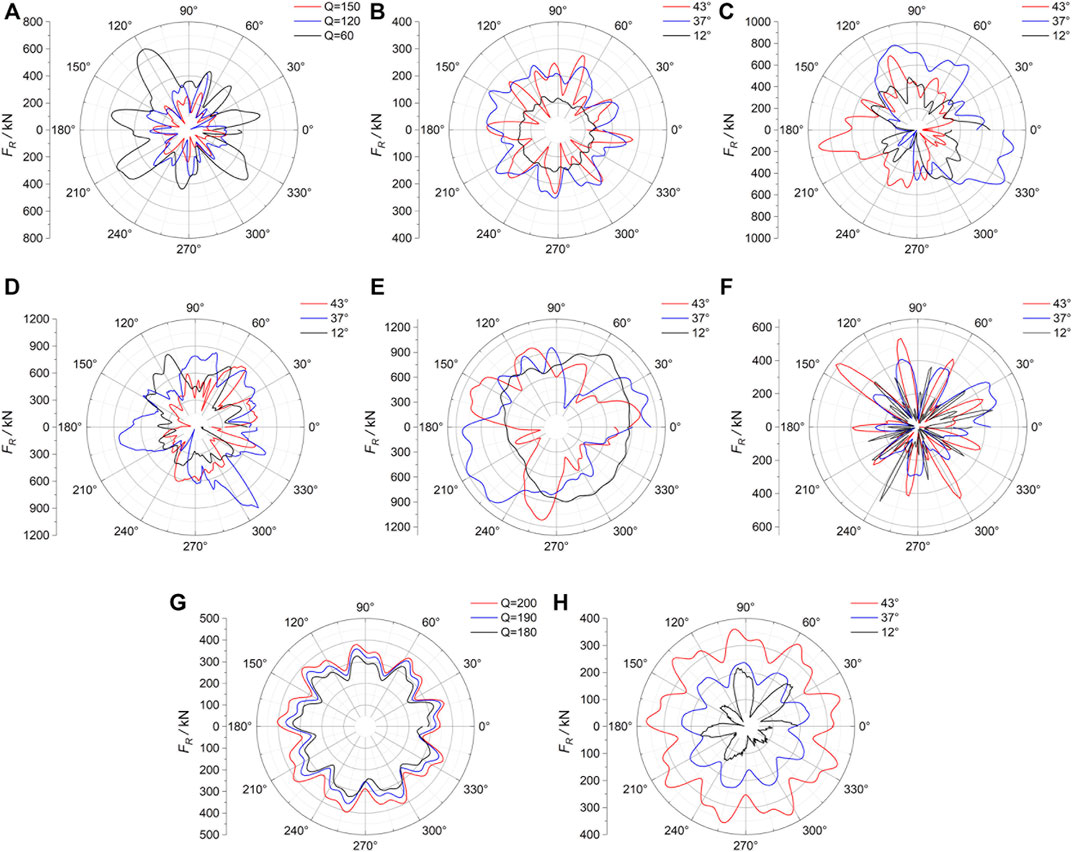
FIGURE 7. Comparisons of radial force variations for different working points within different modes. (A) Radial forces under pump mode at opening 43°. (B) Radial forces under pump mode at three openings. (C) Radial forces at the pump 0-discharge point at three openings. (D) Radial forces under the pump-brake mode at three openings. (E) Radial forces under the turbine-brake mode at three openings. (F) Radial forces under the reverse pump mode at three openings. (G) Radial forces at different flow points under turbine mode at opening 43°. (H) Radial forces under turbine mode at three openings.
The frequency spectrums of pressure pulsations at different openings under the pump mode are similar, as shown in Figure 8. Under this mode, because of the upward flow direction, rotor-stator interaction has less effect on the draft-tube area
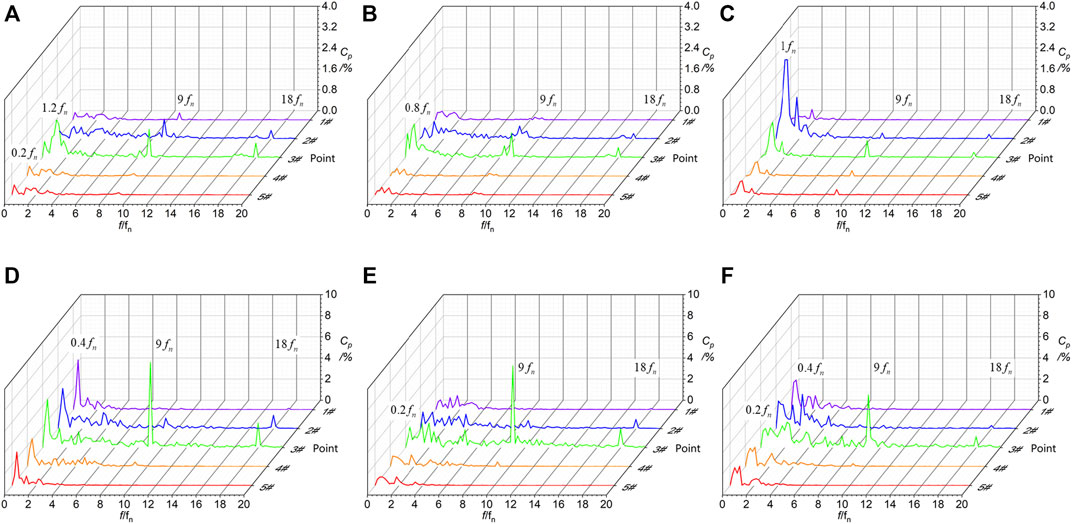
FIGURE 8. Frequency spectrums of pressure pulsations within pump mode at the three openings. (A) 43°. (B) 37°. (C) 12°. (D) 43° (Q = 0 m3/s). (E) 37° (Q = 0 m3/s). (F) 12° (Q = 0 m3/s).
Under the pump-brake mode, the runner keeps rotating in the pump direction, but the water flows direction changes to the turbine direction. The flow in the vaneless area is turbulent, as shown in Figures 9A–C, when the water enters the runner, it first strongly hits the inlet of the pressure surface of the runner, then flows to the adjacent blade channel, and hits the next blade again and continues to flow downwards along the blade surface. The water flows down spirally in the blade channels because of the violent impact between the water and the blades, causing serious flow separation.
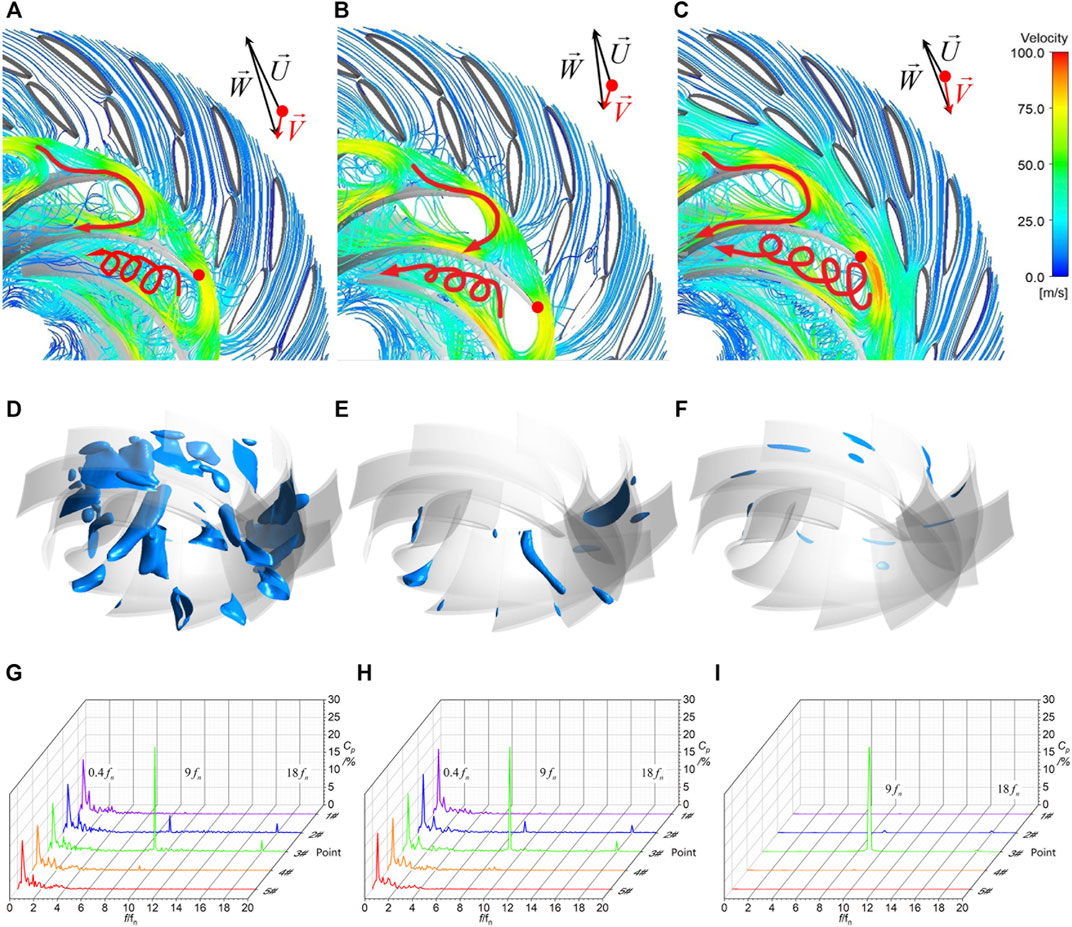
FIGURE 9. Flow patterns (A–C), cavitation cavity patterns (D–F), and frequency spectrums of pressure pulsations (G–I) at different working points within the pump-brake mode at different openings (WVVF = 0.1). (A) Flow patterns at 43°. (B) Flow patterns at 37°. (C) Flow patterns at 12°. (D) Cavitation cavity patterns at 43°. (E) Cavitation cavity patterns at 37°. (F) Cavitation cavity patterns at 12°. (G) Frequency spectrums at 43°. (H) Frequency spectrums at 37°. (I) Frequency spectrums at 12°.
Due to the serious flow separation and backflow vortex, local pressure decreases, and the cavitation is serious under this mode, as shown in Figures 9D–F. A large area of cavitation appears in the runner channels at the large opening of 43° (Figure 9D), and the cavitation area decreases as the opening decreases. The turbulent flow patterns and the severe cavitation cavity cause the radial force of the runner to change dramatically and irregularly in one cycle under this mode (Figure 7D), and the radial force also increases significantly compared to that of the pump mode (the largest radial force under this mode can reach to 1000 kN), resulting in significant vibration of the unit’s shaft system.
The amplitude of the pressure pulsations at each monitoring point under the pump-brake mode is extremely high (Figures 9G–I), except the main frequency at the monitoring point in the vaneless space is still
The turbine mode is the normal operating condition of the pump turbine, and the runner rotation direction is clockwise. When the working point is near the optimal one (Figures 10A–C), the direction of the relative velocity W of the water flow in the runner follows the direction of the blades, the internal flow patterns are smooth and the impact on the runner blades is weak after the water enters the runner. At the small opening of 12° (Figure 10C), the water continues to flow forward in the direction of the guide vanes for some distance before entering the runner, and the flow velocity is higher in the vaneless space, with the streamline slightly turbulent near the pressure surface of the runner blades.
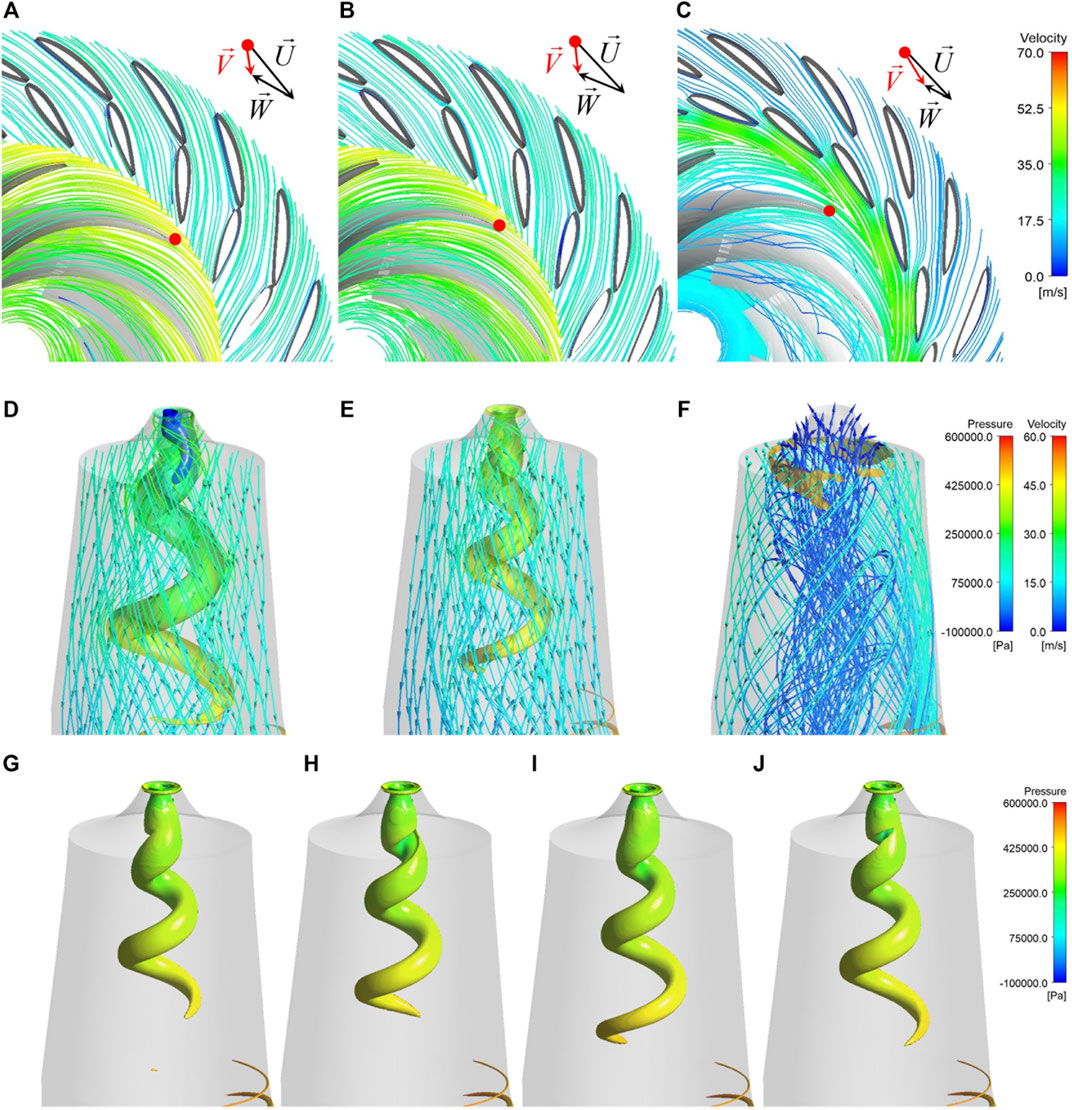
FIGURE 10. Flow patterns, cavitation cavity patterns, and vortex rope of different working points within the turbine mode at three openings (Swirling Strength = 0.01, WVVF = 0.01). (A) Flow patterns at 43° (Q = 190 m3/s). (B) Flow patterns at 37°. (C) Flow patterns at 12°. (D) Flow patterns in the draft tube at 43°(Q = 190 m3/s). (E) Flow patterns in the draft tube at 37°. (F) Flow patterns in the draft tube at 12°. (G) Vortex rope at t = 18 s in opening 37°. (H) Vortex rope at t = 18.08 s in opening 37°. (I) Vortex rope at t = 18.16 s in opening 37°. (J) Vortex rope at t = 18.24 s in opening 37°.
In this mode, the pressure inside the rotating vortex rope in the draft tube reduces to the saturated vapor pressure, resulting in a tongue-like spiral cavity inside the rotating vortex rope (Figure 10D). The volume of the cavitation cavity decreases as the discharge decreases; therefore, the cavity disappears for working points at 37° and 12° openings.
Due to the smooth flow without distinct impact on the runner inlet in this mode, the radial force distribution in the radar chart is regularly periodical, with the number of peaks in one cycle of runner rotation equal to the number of blades (Figures 7G,H). As the discharge decreases, the radial force also decreases. But at the small opening of 12°, the radial forces lose periodicity and fluctuate widely because of the turbulent flow.
As shown in Figure 11, at the large openings 43° and 37° (Figures 11A,B), the pressure pulsations between the guide vanes and in the vaneless space have distinct
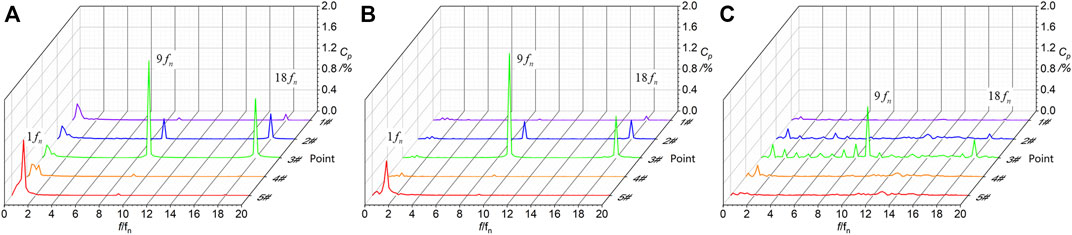
FIGURE 11. Frequency spectrums of pressure pulsations within turbine mode at three openings. (A) 43°. (B) 37°. (C) 12°.
Under the turbine-brake mode, the water flowing out of the guide-vane area first hits the blade suction surface, then partly flows forward, partly flows back, and enters the adjacent blade channel, leading to a high-speed and high-pressure transverse flow water ring formed in the vaneless space. The water in the runner flows spirally forward, forming strong flow separation and vortex structure (Figures 12A–C). Cavitation with a small cavity occurs on the pressure surfaces close to the leading edges of the runner blades (Figures 12D,E). The unbalanced flow patterns in the blade channels induce strongly and irregularly fluctuating radial forces (Figure 7E), similar to that of the pump-brake mode. These two brake modes are the most unfavorable operation conditions of the unit.
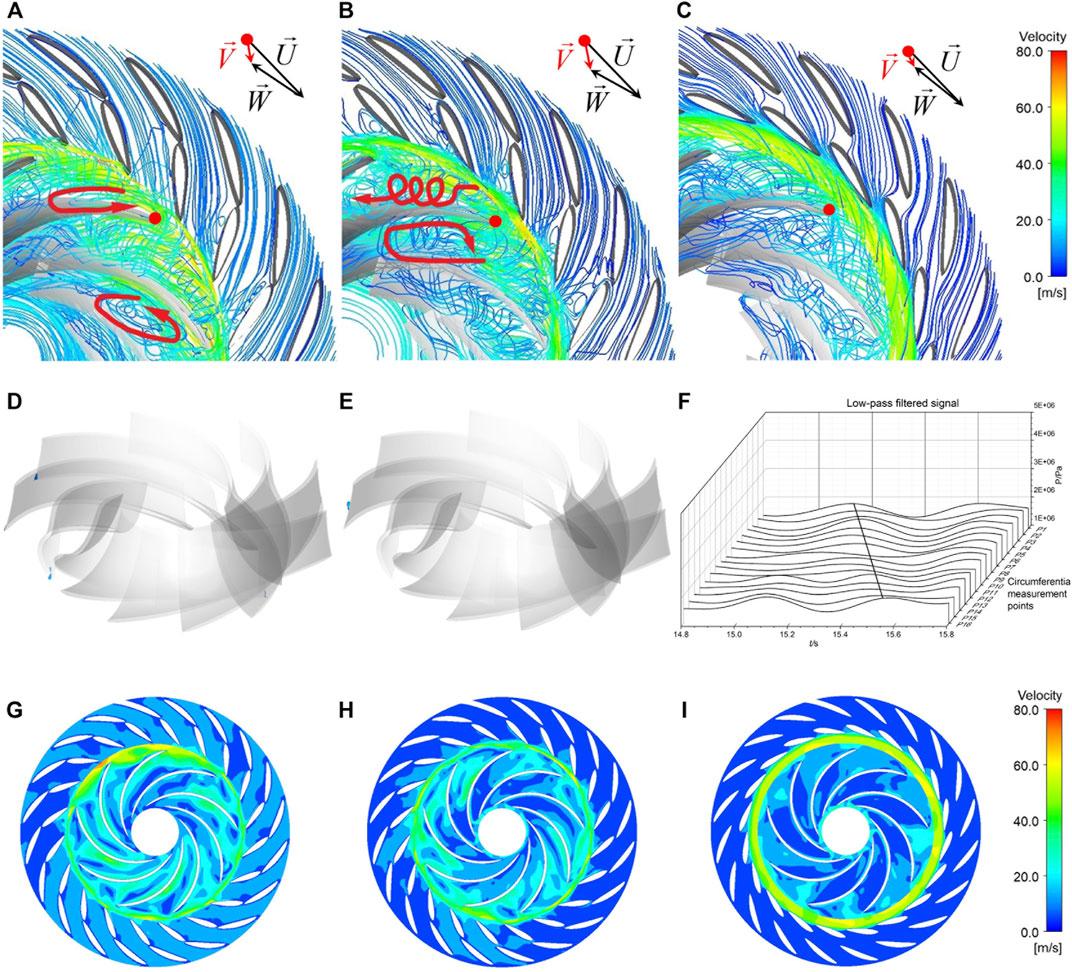
FIGURE 12. Flow patterns, cavitation cavity patterns, and internal velocity cloud of different working points within the turbine-brake mode at three openings (WVVF = 0.1). (A) Flow patterns at 43°. (B) Flow patterns at 37°. (C) Flow patterns at 12°. (D) Cavitation cavity patterns at 43°. (E) Cavitation cavity patterns at 37°. (F) Variation of pressure pulsation at the circumferential monitoring points in the vaneless space at opening 37°. (G) Internal velocity cloud at 43°. (H) Internal velocity cloud at 37°. (I) Internal velocity cloud at 12°.
The turbulent flow patterns not only affect the runner forces but also causes strong pressure pulsations (Figure 13), which are significantly higher than those under the normal operating regions. In the vaneless space, the pressure pulsations have not only strong
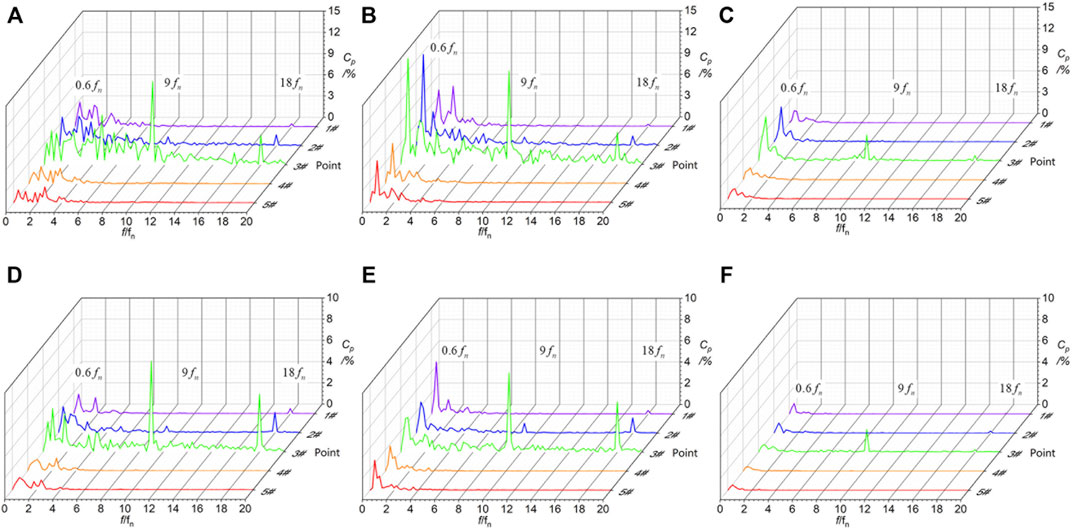
FIGURE 13. Frequency spectrums of pressure pulsations within the turbine-brake mode at three openings. (A) 43°. (B) 37°. (C) 12°. (D) 43° (Q = 0 m3/s). (E) 37° (Q = 0 m3/s). (F) 12° (Q = 0 m3/s).
As the discharge continues to decrease (Figures 13D–F), the frequency spectrums of pressure pulsations at the turbine 0-discharge point is similar to that under the turbine-brake mode, but the amplitude of the same frequency decreases and the main frequency of each opening degree in the vaneless space is
When the pump-turbine enters the reverse pump mode, the runner keeps rotating in the turbine direction, but as the speed continues to rise, the strong centrifugal force draws the water from the draft tube into the runner, pumping water upstream. The flow in the draft tube is turbulent, with the water in the center of the draft tube flowing upward but the water near the wall spiraling downward. After the water is sucked into the runner, the flow first hits the suction surface of the blades, then climbs up along the suction surface. The strong impact on the blades forms flow separations and a large number of vortex structures in the blade channels, and the streamline of each channel is similar. A high-velocity flow ring forms in the vaneless space, preventing the flow from entering the guide-vane area. Because of the small discharge, a large number of vortices generate inside the vane channels. The water entering the guide-vane area first hits the guide-vane blades, then partly flows into the vane channel along the direction of the guide-vane surface, and partly flows forward to the next vane channel. Serious flow separations and vortex structures are forming in the vane channels (Figures 14A–C).
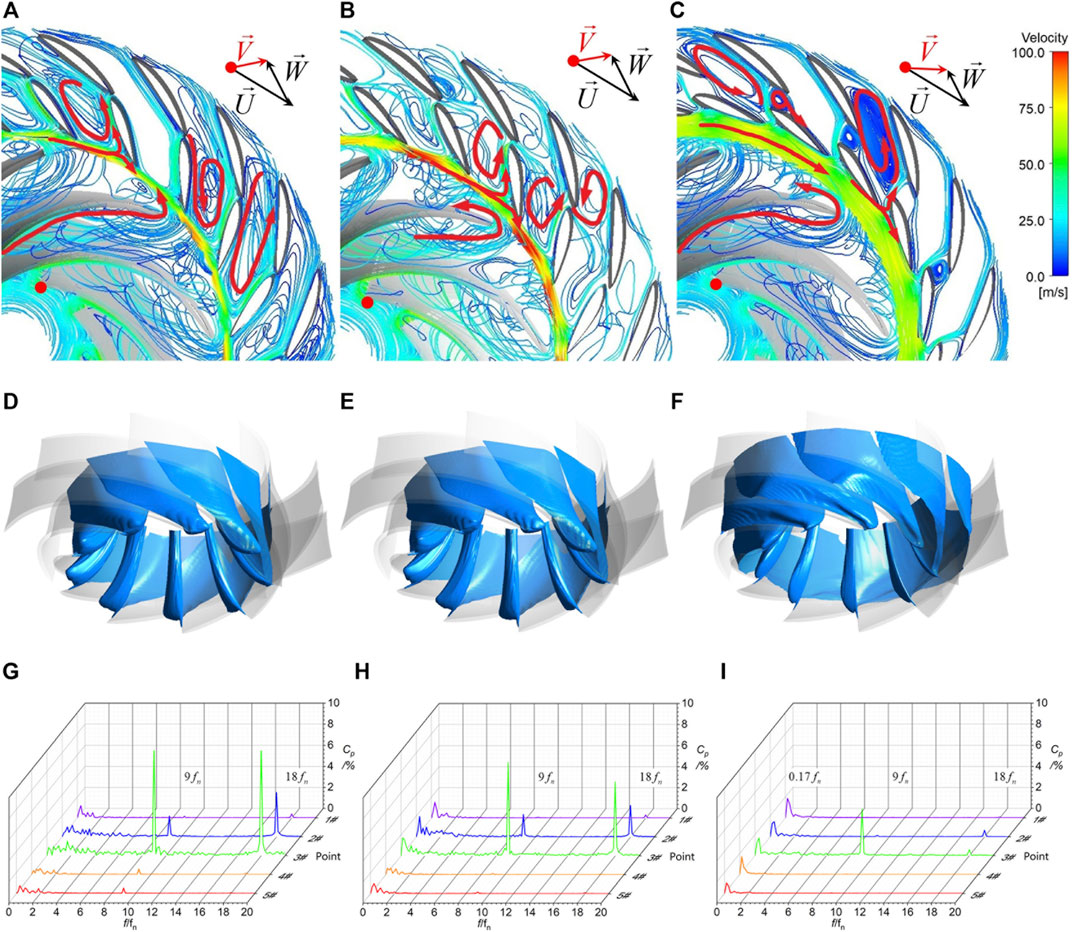
FIGURE 14. Flow patterns, cavitation cavity patterns, and frequency spectrums of pressure pulsations of different working points within reverse pump mode at different openings (WVVF = 0.1). (A) Flow patterns at 43°. (B) Flow patterns at 37°. (C) Flow patterns at 12°. (D) Cavitation cavity patterns at 43°. (E) Cavitation cavity patterns at 37°. (F) Cavitation cavity patterns at 12°. (G) Frequency spectrums at 43°. (H) Frequency spectrums at 37°. (I) Frequency spectrums at 12°.
Due to the severe flow separation inside the runner, cavitation is extremely serious under this mode. A large flag-shaped cavity forms in the rear half of the pressure surface of every blade (Figures 14D–F). The cavitation is uniformly distributed in each runner channel, with a similar distribution at each opening. As shown in Figure 7F, radial forces still have peaks in line with the number of blades under the reverse pump mode, but the fluctuation of radial force is large.
The frequency spectrums of pressure pulsations are shown in Figures 14G–I, in the vaneless space, the main frequency is still
To understand the distribution characteristics of flow patterns, pressure pulsations, cavitation characteristics, and runner forces of pump-turbine in all five operating modes, we conducted CFD simulations for a prototype pump-turbine and analyzed 29 typical working points at three typical openings. The main conclusions are as follows.
1) Near the design working points, the streamline is smooth, pressure and runner force fluctuations are small, and cavitation is not obvious. However, when the working points deviate from the optimal one, flow patterns are getting worse, leading to violent pressure and runner force fluctuations.
2) Operation in the pump-brake mode is the most unfavorable, with turbulent flow patterns, complex vortex structures, serious cavitation, and prominent low-frequency pressure pulsations. The flow hits the runner blades violently, causing extremely large runner force fluctuations and may lead to severe vibration of the unit. While in the hump region of the pump mode, the flow hits the guide vanes, causing an apparent rotating stall in the vane area. Also, in the S-shaped region, the operation is also unstable with high-pressure pulsation caused by rotor-stator interaction and developing rotating stall.
3) Pressure pulsations reach the largest in the pump-brake and turbine-brake modes, with amplitudes more than 10 times those in the normal working regions. Under similar operating conditions, the pressure pulsations increase with the opening degree; at the same working point, the pressure pulsations are greatest in the vaneless space, followed by in the guide-vane areas, and further smaller in the spiral-casing and draft-tube inlet.
4) When operating at large openings, the pump-turbine has cavitation of various sizes and forms under most operating modes. Under the turbine high-discharge point, tongue-shaped cavitation occurs in the draft tube. Under all other modes, cavitation occurs inside the runner. The cavitation is serious in the pump-brake mode and reverse pump mode, especially in the latter, with large flag-shaped cavities filling most of the runner channels.
The resulting laws and mechanism of the flow characteristics in each operating mode can provide a reference for related research and runner design, and pump turbines should avoid long-term operation in pump-brake and turbine-brake modes. In future studies, we should pay more attention to the sources of pressure pulsations at different frequencies under unfavorable operating modes and the corresponding improvement measures.
The original contributions presented in the study are included in the article/Supplementary Material, further inquiries can be directed to the corresponding author.
DH: data curation and writing—original draft preparation and editing; YC: writing—original draft preparation and investigation; PZ: formal analysis and validation; XW: writing—review and editing; JD: writing—review and editing; and XZ: assistance with analysis.
This work was supported by the National Natural Science Foundation of China (NSFC) (Grant Nos. 51839008 and 51909226).
XW was employed by Anhui Jinzhai Pumped Storage Company Ltd.; JD was employed by Pumped-Storage Power Institute of Technology and Economy, State Grid Xinyuan Company Ltd.
The remaining authors declare that the research was conducted in the absence of any commercial or financial relationships that could be construed as a potential conflict of interest.
All claims expressed in this article are solely those of the authors and do not necessarily represent those of their affiliated organizations, or those of the publisher, the editors, and the reviewers. Any product that may be evaluated in this article, or claim that may be made by its manufacturer, is not guaranteed or endorsed by the publisher.
The numerical simulations were conducted on the supercomputing system in the Supercomputing Center of Wuhan University.
Celebioglu, K., Altintas, B., Aradag, S., and Tascioglu, Y. (2017). Numerical Research of Cavitation on Francis Turbine Runners. Int. J. Hydrogen Energ. 42 (28), 17771–17781. doi:10.1016/j.ijhydene.2017.03.180
Goyal, R., and Gandhi, B. K. (2018). Review of Hydrodynamics Instabilities in Francis Turbine during Off-Design and Transient Operations. Renew. Energ. 116. 697. doi:10.1016/j.renene.2017.10.012
Hasmatuchi, V., Farhat, M., Roth, S., Botero, F., and Avellan, F. (2011). Experimental Evidence of Rotating Stall in a Pump-Turbine at Off-Design Conditions in Generating Mode. J. Fluids Eng. 133 (5), 1–8. doi:10.1115/1.4004088
Ješe, U., Fortes-Patella, R., and Antheaume, S. (2014). “High Head Pump-Turbine: Pumping Mode Numerical Simulations with a Cavitation Model for Off-Design Conditions,” in 27th IAHR Symposium on Hydraulic Machinery and Systems (IAHR) 22, 1–11. doi:10.1088/1755-1315/22/3/032048
Ješe, U., and Fortes-Patella, R. (2016). Unsteady Numerical Analysis of the Rotating Stall in Pump- Turbine Geometry. IOP Conf. Ser. Earth Environ. Sci. 49, 042005. doi:10.1088/1755-1315/49/4/042005
Ji, X. Y., and Lai, X. (2011). Numerical Simulation of the S-Shaped Characteristics of the Pump-Turbine. Chin. J. Hydrodynamics 26 (03), 318–326. doi:10.3969/j.issn1000-4874.2010.03.008
Jun-Won, S., Hyeon-Mo, Y., Jin-Hyuk, K., Won-Gu, J., Jungwan, P., and Young-Seok, C. (2021). Unstable S-Shaped Characteristics of a Pump-Turbine Unit in a Lab-Scale Model. Renew. Energ. 171. 1395. doi:10.1016/j.renene.2021.03.013
Li, D.-y., and Wang, H.-j. (2015). Fluid Flow Analysis of Drooping Phenomena in Pump Mode for a Given Guide Vane Setting of a Pump-Turbine Model. JZUS-A 16, 851–863. doi:10.1631/jzus.A1500087
Li, D., Song, Y., Lin, S., Wang, H., Qin, Y., and Wei, X. (2021). Effect Mechanism of Cavitation on the Hump Characteristic of a Pump-Turbine. Renew. Energ. 167, 369–383. doi:10.1016/j.renene.2020.11.095
Li, Q. F., Chen, X. Y., Meng, Q., Cai, T., Zhou, F., and Wei, X. Z. (2020). Analysis of Correlation Characteristics of Pump-Turbine under Different Cavitation Numbers. Trans. Chin. Soc. Agric. Machinery 51 (01), 130–138.
Li, Q. F., Wang, Y. K., Liu, C., and Han, W. (2017). Study on Unsteady Internal Flow Characteristics in Hump Zone of Mixed Flow Pump Turbine. J. Gansu Sci. 29 (04), 54–58.
Li, Y. X., Zhou, D. Q., and Yu, A. (2019). Research of Swirl Cavity Flow Performance in the Draft Tube of Pump Turbine. Renew. Energ. Resour. 37 (02), 303–309. doi:10.13941/j.cnki.21-1469/tk.2019.02.023
Liu, J., Liu, S., Wu, Y., Jiao, L., Wang, L., and Sun, Y. (2012). Numerical Investigation of the Hump Characteristic of a Pump-Turbine Based on an Improved Cavitation Model. Comput. Fluids 68, 105–111. doi:10.1016/j.compfluid.2012.08.001
Liu, K., Yang, F., Yang, Z., Zhu, Y., and Cheng, Y. (2019). Runner Lifting-Up during Load Rejection Transients of a Kaplan Turbine: Flow Mechanism and Solution. Energies 12 (24), 4781. doi:10.3390/en12244781
Liu, Z. Q., Sun, H., Xiao, R. F., and Liu, W. C. (2013). S-shaped Characteristics of Pump-Turbine and Improvement on its Performance. J. Hydroelectric Eng. 32 (02), 257–260+270.
Ran, H. J., Zhang, Y., Luo, X. W., and Xu, H. Y. (2011). Numerical Simulation of the Positive-Slope Performance Curve of a Reversible Hydro-Turbine in Pumping Mode. J. Hydroelectric Eng. 30 (03), 175–179.
Shang, C. Y. (2020). Cavitation Effect On the S-Shaped Characteristics Of Pump-Turbine. Master Master's Thesis. Harbin: Harbin Institute of Technology.
Wang, C. H., and Guo, Z. W. (2018). An Investigation of the Hump Characteristic of a Prototype Pump-Turbine at Pump Modes. China Rural Water and Hydropower. 7, 178–183.
Wang, F. J. (2016). Research Progress of Computational Model for Rotating Turbulent Flow in Fluid Machinery. Trans. Chin. Soc. Agric. Machinery 47 (02), 1–14.
Wang, L. Q., Liu, Y. Y., Liu, W. J., Qin, D. Q., and Jiao, L. (2013). Pressure Fluctuation Characteristics of Pump-Turbine at Pump Mode. J. Drainage Irrigation Machinery Eng. 31 (01), 7–10+35.
Wang, Z. P. (2020). Study On Cavitation Performance Of the "s" Characteristics Of the Pump-Turbine. Master Master's Thesis. Xi'an: Xi'an University of Technology.
Widmer, C., Staubli, T., and Ledergerber, N. (2011). Unstable Characteristics and Rotating Stall in Turbine Brake Operation of Pump-Turbines. J. Fluids Eng. 133 (4). doi:10.1115/1.4003874
Wu, Y. J., Yang, Z. B., and Tian, D. Y. (2021). Influence of Guide Vane Opening on External Characteristics and Stability of Pump Turbine at Zero Flow Condition. Water Resour. Power 39 (06), 158–160+157.
Xia, L. S., Cheng, Y. G., Cai, F., and Zhang, X. X. (2015). Numerical Analysis of Flow Characteristics of a Model Pump-Turbine in Four Operating Quadrants. J. Hydraulic Eng. 46 (07), 859–868.
Xiao, R., Sun, H., Liu, W. C., and Wang, F. J. (2012a). Analysis of S Characteristics and its Pressure Pulsation of Pump-Turbine under Pre-opening Guide Vanes. Jme 48 (08), 174–179. doi:10.3901/jme.2012.08.174
Xiao, Y. X., Sun, D. G., Wang, Z. W., Zhang, J., and Peng, G. Y. (2012b). Numerical Analysis of Unsteady Flow Behaviour and Pressure Pulsation in Pump Turbine with Misaligned Guide Vanes. IOP Conf. Ser. Earth Environ. Sci. 15 (3), 032043. doi:10.1088/1755-1315/15/3/032043
Yan, J. P., Seidel, U., and Koutnik, J. (2013). “Numerical Simulation of Hydrodynamics in a Pump-Turbine at Off-Design Operating Conditions in Turbine Mode,” in 26th Iahr Symposium on Hydraulic Machinery and Systems, Pts 1-7. Editors Y. Wu, Z. Wang, S. Liu, S. Yuan, X. Luo, and F. Wang.
Zhang, C. Z., Xia, L. S., Diao, W., and Zhou, J. Y. (2017a). Pressure Fluctuations Characteristics and Rotating Stall Propagation Mechanism of a Pump-Turbine in Pump Mode. J. Hydraulic Eng. 48 (07), 837–845.
Zhang, F., Fan, Y. L., Zhu, B. S., Xu, Y. L., and Liu, W. J. (2019). S-shape Region Pressure Pulsation Measurement of Model Reversible Pump-Turbine. Fluid Machinery 47 (06), 6–11+28.
Zhang, L. J., Wang, Z. W., and Chang, J. S. (2011). Flow of Pump-Turbine on S-Shaped Region of Complete Characteristics. Trans. Chin. Soc. Agric. Machinery 42 (01), 39–43+73.
Zhang, X. X. (2015). Three-Dimensional Transient Flow in Pumped-Storage Plant: Simulation and Analysis by Coupling One-Dimensional Water Conveyance System with Three-Dimensional Pump-Turbine.Doctor Doctoral Thesis. Wuhan: Wuhan University.
Zhang, Y., Zhang, Y., and Wu, Y. (2017b). A Review of Rotating Stall in Reversible Pump Turbine. Proc. Inst. Mech. Eng. C: J. Mech. Eng. Sci. 231 (7), 1181–1204. doi:10.1177/0954406216640579
Zhu, D., Xiao, R., and Liu, W. (2021). Influence of Leading-Edge Cavitation on Impeller Blade Axial Force in the Pump Mode of Reversible Pump-Turbine. Renew. Energ. 163, 939–949. doi:10.1016/j.renene.2020.09.002
Keywords: pump-turbine, operating modes, cavitation, pressure pulsations, runner forces, CFD simulation
Citation: Hu D, Cheng Y, Zhang P, Wang X, Ding J and Zhang X (2022) Distribution Features of Flow Patterns and Pressure Pulsations of Pump-Turbine in Five Operating Modes on the Four-Quadrant Plane. Front. Energy Res. 10:880293. doi: 10.3389/fenrg.2022.880293
Received: 21 February 2022; Accepted: 08 April 2022;
Published: 10 May 2022.
Edited by:
Umberto Desideri, University of Pisa, ItalyCopyright © 2022 Hu, Cheng, Zhang, Wang, Ding and Zhang. This is an open-access article distributed under the terms of the Creative Commons Attribution License (CC BY). The use, distribution or reproduction in other forums is permitted, provided the original author(s) and the copyright owner(s) are credited and that the original publication in this journal is cited, in accordance with accepted academic practice. No use, distribution or reproduction is permitted which does not comply with these terms.
*Correspondence: Yongguang Cheng, eWdjaGVuZ0B3aHUuZWR1LmNu
Disclaimer: All claims expressed in this article are solely those of the authors and do not necessarily represent those of their affiliated organizations, or those of the publisher, the editors and the reviewers. Any product that may be evaluated in this article or claim that may be made by its manufacturer is not guaranteed or endorsed by the publisher.
Research integrity at Frontiers
Learn more about the work of our research integrity team to safeguard the quality of each article we publish.