 Yali Wang
 Ze Ye1
 Shuangfeng Dai
- 1College of Economics and Management, Changsha University of Science and Technology, Changsha, China
- 2College of Economics and Management, Hunan University of Science and Technology, Yueyang, China
As a large number of new energy electric vehicles are retired, the sequential utilization of retired power batteries has become one of the important means to improve the economic benefits of batteries, but there is a problem of disunity between available capacity and cycle life. Therefore, a peak-load power distribution method based on the principle of equal life of retired power batteries was proposed, which could effectively avoid the life difference caused by the battery difference and reduce the replacement cost. At the same time, in order to give reasonable investment suggestions for the stepwise utilization of retired power batteries, three economic boundary value models, including the payback period, peak–valley price difference, and investment cost, were constructed based on the leveling cost. Through the simulation of a 60 MW/160 MWh lithium iron phosphate decommissioned battery storage power station with 50% available capacity, it can be seen that when the cycle number is 2000 and the peak–valley price difference is above 0.8 yuan/kWh, it has investment value.
Introduction
The state attaches great importance to the development of the new energy electric vehicle industry and actively arranges it as a national strategic emerging industry. During the 14th Five-Year Plan period, the total scale of new energy electric vehicle production and sales will reach tens of millions of vehicles. However, when the EV battery’s available capacity falls below 70–80%, it must be decommissioned (Zhao et al., 2021a; Li Y Q et al., 2021; Xie et al., 2020). At that time, the capacity of the decommissioned battery in China will be as high as 25 GWh (Zhang et al., 2021). Direct scrapping will not only increase the processing cost but also cause a waste of resources (Tian et al., 2020; Yan et al., 2019). To explicitly encourage the cascade utilization of power batteries, the five departments issued management measures for the cascade utilization of power batteries of new energy vehicles in September 2021 (Li J L et al., 2022). At the same time, the majority of academics turned their attention to retired power battery echelon utilization (Lai et al., 2021; Xu et al., 2019; Zhang H et al., 2020).
When the power battery is decommissioned, the available capacity is about 70%. If it is selected and reorganized to participate in power grid service, it can not only reduce the battery recovery pressure but also provide greater economic benefits (Jiang et al., 2021; Yu and Zhou, 2020; Gao et al., 2022; Sathrea et al., 2015; Sedighizadeh et al., 2019). According to Dipti et al. (2020), cascade lithium-ion batteries exhibit better environmental benefits than new batteries in some application scenarios, demonstrating the social value of cascade utilization of retired power batteries. Ma et al. (2021) applied decommissioned power batteries to wind power smoothing scenarios and then reduced the amount of abandoned air and improved the economic benefits of decommissioned power batteries by constructing the objective function of maximum daily returns. By establishing the cascade utilization model, Fan et al. (2021) improved the prediction accuracy of new energy and the revenue of retired batteries. The moving average method was used by Cui et al. (2020) to separate the predicted power fluctuation components of wind power, and then, retired power batteries were used to reduce wind power fluctuation and improve wind power consumption. From a demand-side management perspective, Fazelpour et al. (2014) and Finn et al. (2012) proposed that charging step utilization battery devices during off-peak load periods can reduce charging costs and studied the charging and discharging strategies of step utilization battery according to peak and valley pricing. Sun et al. (2021) proposed that the project exhibits investment value when the recovery price of step utilization battery is lower than 0.4 yuan/Wh. The normalization method is used to construct the economic boundary analysis model, according to Li and Li (2021). When the number of cycles is more than 2000 and the peak–valley price difference is 0.8 yuan/kWh, profits can be achieved.
From the above research, it is not difficult to find that it is feasible to use retired power batteries to participate in the peak load adjustment and fluctuation suppression of power grid from the perspective of economy and technology, but the available capacity and cycle life of retired batteries are not uniform (Zhang J et al., 2020), and how to construct the “peak–valley price difference” boundary value model in electricity market transactions has become a research focus (Cai and Li, 2021; Cao et al., 2021). Therefore, this paper proposes a retired power battery cascade utilization economic model and investment economic boundary model taking into account replacement cost. Compared with existing studies, this paper has the following contributions:
1) This paper proposes a peak-load power distribution method based on the principle of equal life of retired batteries to reduce the replacement cost increased by the difference in cycle life, thus improving the economy of the system.
2) This paper constructs three economic boundary models based on leveling cost, including the payback period, peak–valley price difference, and investment cost, which can provide reasonable suggestions for the investment of retired power battery’s echelon utilization.
Economic Optimization Model of Retired Power Battery Cascade Utilization
Step Utilization Cost Model of Retired Power Battery
The step utilization cost of power battery mainly includes battery recovery cost, equipment cost (power converter and management system cost), integration cost, replacement cost, operation and maintenance cost, and scrap cost.
Cost Recovery (C1)
where CB is the unit price of the recovered battery, yuan/Wh, and EN is the recovery rated capacity, Wh.
Equipment Cost (C2)
where Cp is the unit price of the power converter, yuan/W; CM is the unit price of the management system, yuan/Wh; and PN is the recovery rated power, W.
Integration Cost (C3)
Due to individual differences, charging and discharging efficiency, available capacity, rated power, etc., decommissioned power batteries need to be screened, classified, and assembled, thus increasing the cost:
where CS is the unit battery integration cost, yuan/Wh.
Replacement Cost (C4)
Based on the individual differences of retired batteries, the service life termination time is not uniform during operation, and the battery body needs to be replaced constantly (Li et al., 2022; Lu et al., 2021). In the meantime, the battery access port management system cannot be reused and must be replaced at the same time. As a result, the cost of replacement includes both the battery body and the management system:
where n is the number of replacement times expressed as
where N is the project cycle, k is the number of remaining cycles of the power battery, T is the number of operating days per year, and m is the number of cycles per day.
Operation and Maintenance Cost (C5)
where CW is the annual operation and maintenance unit price, yuan/Wh/year.
Scrap Cost (C6)
After the service life of power battery, the cost of residual body treatment is generally calculated by the residual value rate:
where β is the salvage rate.
Therefore, the power battery cost (C) can be expressed as follows:
Retired Power Battery Step Utilization Income Model
At present, the power market is not perfect, and the incomes of energy storage mainly include the following: first, direct incomes of low storage and high generation to earn power price difference and peak adjustment compensation (Chen et al., 2022; Wang et al., 2020) and, second, indirect incomes of reducing thermal power generation through energy storage to save environmental costs (Li et al., 2020).
Peak Cutting and Valley Filling
where B1 is the income from peak cutting and valley filling, η is the charge–discharge efficiency, Pprice is the real-time peak–valley price difference of power grid, △t is each charge and discharge time, PC is the charging power, and PD is the discharge quantity.
Peak Adjustment Compensation
where B2 is the annual peak regulation compensation income and e is the contract price.
Environmental Income
where B3 is the environmental benefit, H is the total number of pollutants, θh is the emission density of the hth pollutant, and Pprice,h is the unit emission cost of the hth pollutant.
Therefore, the power battery income (B) can be expressed as follows:
In summary, the net present value of successive utilization of retired power batteries can be expressed as follows:
where N is the project cycle.
Power Distribution Method of Retired Power Battery Step Utilization
Due to the difference in rated capacity loss and available power consumption (as shown in Figure 1) (Fan et al., 2021), the charging and discharging efficiency and depth of decommissioned power batteries are different. As a result, the available capacities of retired power batteries vary (Klein et al., 2016; Zhao et al., 2021b). If the even distribution principle is followed when participating in peak-load cutting and valley filling, it may result in insufficient energy supply for some batteries and redundancy for some batteries. At the same time, if the battery is charged and discharged sequentially according to the size of available capacity, it may increase the battery imbalance damage (that is, the battery charge and discharge frequency is not uniform) and then increase the replacement cost. As a result, based on the principle of decommissioned power battery life span, this paper proposes a method to allocate charging and discharging power based on battery capacity, thereby avoiding the problem of increasing replacement cost caused by inconsistent charging and discharging. The specific implementation process is as follows:

FIGURE 1. Schematic diagram of available capacity of different retired power batteries.
Step 1: Determine the required charge–discharge efficiency of the system (△P).
Step 2: Initialize the total available capacity of the current retired power battery (△PD):
where △Pk is the available capacities of retired power batteries in group K and K is the total number of groups.
Step 3: Determine the ratio coefficient of charge and discharge by the processing method of normalization (g):
Step 4: Determine the charge and discharge amount of each group:
Economic Boundary Model Based on Leveling Cost
Payback Period Boundary Model
The levelized cost of energy (LCOE) is widely used at home and abroad to evaluate the economy of power generation projects (Li and Li, 2021). The boundary of the investment payback period refers to the time required for power generation projects from investment to full investment recovery. The longer the project investment payback period, the higher the investment risk:
where Ri is the income in the ith year, Ci is the input cost in the ith year, n is the boundary life of the payback period, and r is the discount rate.
The power battery ladder utilization gains can be expressed by the sum of discounted values multiplied by the LCOE and the current year’s power production En, and then, Eq. 14 can be further expressed as follows:
where η is the charge–discharge efficiency and the depth of discharge (DOD) is the charge–discharge depth.
Investing in the LCOE Boundary Model
The investment LCOE boundary value refers to the LCOE required to recover the investment in the whole life cycle, according to formula (15):
Investment Cost Boundary Model
The boundary value of investment cost refers to the maximum acceptable recovery cost value of investment recovery within the whole life cycle according to the current LCOE value (about 0.7 yuan/kWh) (Fan et al., 2021):
Anti-Truth Analysis
Simulation Parameters
Taking 60 MW/160 MWh as an example, the usable capacity of the energy storage system is 50%, the specific parameters are shown in Table 1 (Li and Li, 2021), the peak-to-valley time-of-use electricity price of non-residential users is shown in Table 2, the capacity decay rate is calculated according to 5%/100 times (Sun et al., 2021), and the environmental cost parameters are shown in Table 3.
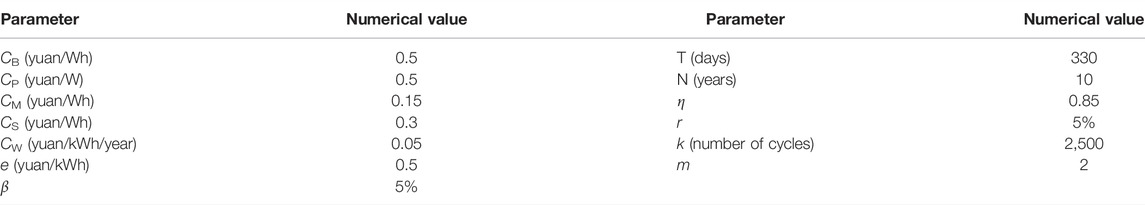
TABLE 1. Parameters of echelon energy storage.
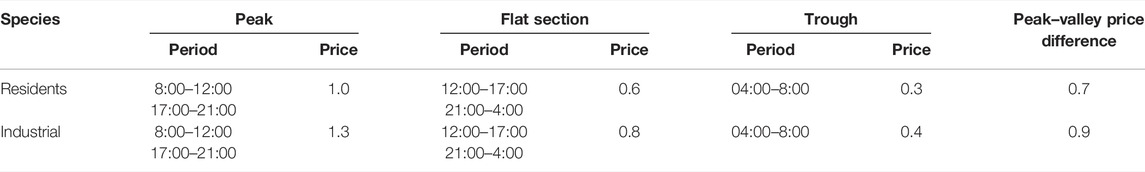
TABLE 2. Time-of-use (TOU) power price.
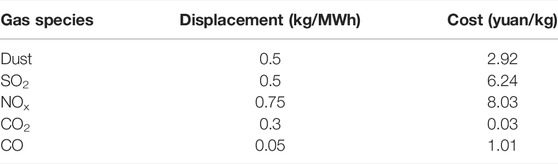
TABLE 3. Type and cost of emissions.
Economic Benefit Analysis
The decommissioned power battery model is solved by a genetic algorithm (Chen, 2016; Hlal et al., 2019; Saini and Gidwani, 2022; Jiang et al., 2019), in which the original load (Wei et al., 2021) and peak adjusted curve are shown in Figure 2, and the output curve after peak shaving of the decommissioned power battery is shown in Figure 3. Assuming that the decommissioned power battery’s service life and project life are both 5 years, no need exists for replacement costs at this time, and the annual investment cost and income of the decommissioned power battery are shown in Table 4.
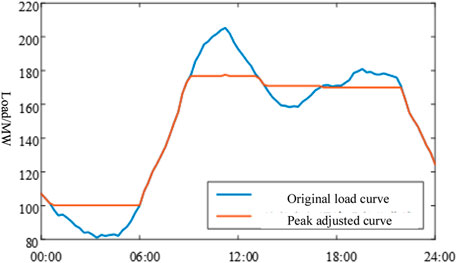
FIGURE 2. Comparison diagram of post-peak load involving original load and energy storage.
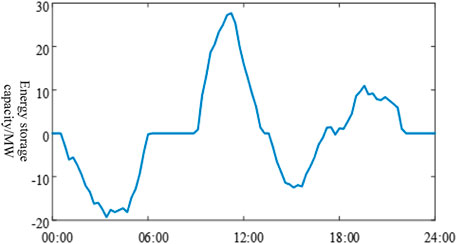
FIGURE 3. Output curve of the decommissioned power battery.
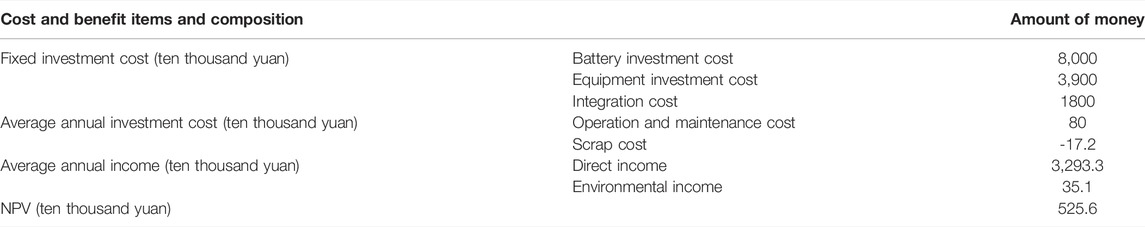
TABLE 4. Annual investment costs and benefits of decommissioning power batteries.
According to Figure 2, finding that energy storage demonstrates a good effect of “peak shaving and valley filling” is not difficult, effectively assisting the power grid to participate in peak regulation. Simultaneously, according to Table 4, it can be seen that the decommissioned power battery demonstrates certain economic benefits in participating in peak shaving, and the investment payback period is 4.2 years, which can recover the cost during the life cycle and exhibits investable value.
Profit Margin Analysis
Analysis of Economically Sensitive Parameters
According to formula (17), the current LCOE = 0.86 (yuan/kWh); however, the current peak-to-valley electricity price difference is 0.6 yuan/kWh, indicating that the decommissioned power battery ladder uses only the peak–valley electricity price difference income that relies on peak-to-valley filling, and it does not exhibit profitability. When combined with the cost of the decommissioned power battery in Table 4 and the parameters in Table 1, it is clear that the price of the recovery price, the number of cycles, and the technical cost (including equipment cost and integration cost) of the single battery result in a significant impact on the economic utilization of the decommissioned power battery ladder. Therefore, this section analyzes the relationship between battery recovery unit price, technical cost, and LCOE sensitive parameters in the case of 1,500 cycles, 2,000 cycles, and 2,500 cycles, respectively, as shown in Figures 4–6, respectively.
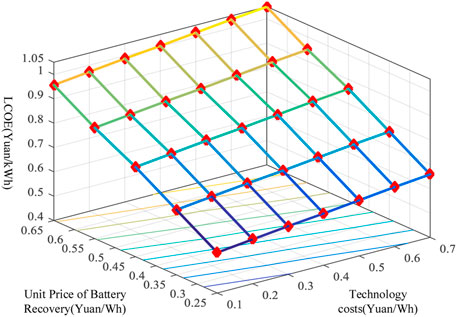
FIGURE 4. K = 1,500 times sensitive cost parameter relationship.

FIGURE 5. K = 2,000 times sensitive cost parameter relationship.
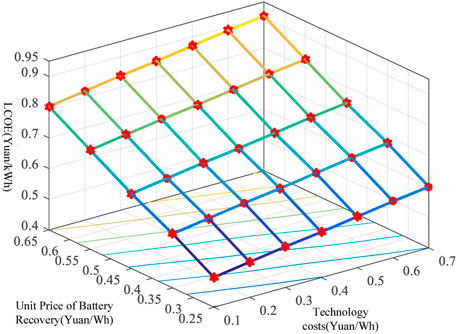
FIGURE 6. K = 2,500 times sensitive cost parameter relationship.
In Figure 4, when the number of cycles k = 1,500 times, the battery cost boundary is about 0.4 yuan/kWh, and the technical cost boundary is 0.25 yuan/kWh, or the sum of the two is about 0.65 yuan/kWh. In Figure 5, when k = 2,000 times, the battery cost boundary is about 0.5 yuan/kWh, and the technical cost boundary is 0.35 yuan/kWh, or the sum of the two is about 0.85 yuan/kWh. In Figure 6, when k = 2,500 times, the battery cost boundary is about 0.52 yuan/kWh, and the technical cost boundary is 0.35 yuan/kWh, or the sum of the two is about 0.87 yuan/kWh. However, when the number of cycles exceeds 2,000, the boundary cost change is not obvious because the charging and discharging power, depth, and usable capacity of decommissioned batteries are essentially identical, with the only difference being the difference in life.
It is not hard to see from Figures 4–6 that, under the same battery recycling unit price and technical cost, the LCOE continues to decline as the number of cycles increases. At present, the maximum peak-to-valley price difference of the electricity price of Jiangsu residents is 0.8154 yuan/kWh, while the peak-to-valley price difference of 35 kV industrial users can reach 0.89 yuan/kWh, and the peak-to-valley price difference of 1–10 kV industrial and commercial users in Beijing can reach 1.14 yuan/kWh. When the number of cycles exceeds 2,000 times, making a profit is a possibility. At the same time, the National Development and Reform Commission issued the “Notice on Further Improving the Time-Sharing Electricity Price Mechanism” (National Development and Reform Commission, 2021), which stipulates that the peak-to-valley electricity price difference reaches 4:1, further providing usable space for energy storage investment.
Economic Boundary Value Analysis
In recent years, the price of lithium iron phosphate batteries and the cost of energy storage technology have both declined, further improving the profit margins of power battery cascade utilization. As a result, this section investigates the payback period boundary value, LCOE boundary value, and investment cost (battery recovery and technical cost) boundary value based on the aforementioned economic model of cascade utilization of power batteries. For the study of the payback period boundary value, assuming that the whole life cycle of the decommissioned power battery is 8 years, the number of cycles is 2,000 times, the current LCOE is 0.7 (yuan/kWh) (Li and Li, 2021), and the investment cost changes are shown in Figure 7. Then, the relationship between the payback period boundary value and the evolution trend of energy storage cost is shown in Figure 8.
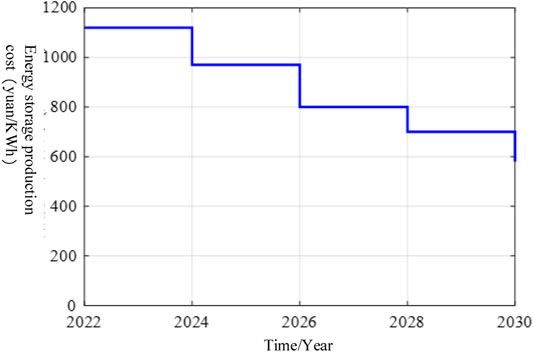
FIGURE 7. Change trend of investment cost of the retired power battery.
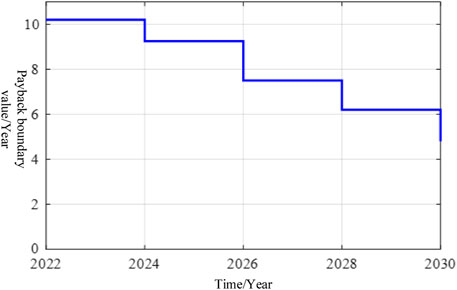
FIGURE 8. Payback boundary value.
According to Figure 8, as energy storage costs are reduced, the payback period boundary value continues to shrink. For example, in 2026, when the energy storage cost is reduced to 0.8 yuan/kWh, the payback period boundary value is approximately 7.8 years, allowing the investment cost to be recovered over the life cycle. The payback period is reduced to 4.8 years when the cost of energy storage falls to 0.58 yuan/kWh in 2030.
In the study of LCOE boundary values, according to Eq. 20, it can be seen that the current LCOE = 0.86 (yuan/kWh), making the profit difficult. Figure 9 depicts the relationship between the LCOE boundary value and the cost evolution trend of the decommissioned power battery when the total life cycle of the decommissioned power battery is 8 years and the number of cycles is 2,000.
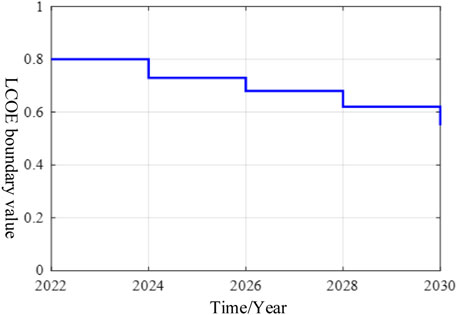
FIGURE 9. LCOE boundary value.
From Figure 9, it is not difficult to find that, with the continuous reduction of costs, the LCOE boundary value continues to decrease, which indicates that the profit space is getting larger and larger, and when it is 2028, the LCOE is reduced to 0.6 yuan/kWh, meeting the current peak-to-valley price difference in most domestic provinces. A better chance of achieving profitability before 2028 occurs if the National Development and Reform Commission is constantly formulating and releasing the peak–valley electricity price spread policy.
When the decommissioned power battery life cycle is 8 years and the number of cycles is 2000, the decommissioned power battery cost boundary study refers to the corresponding investment cost value when the LCOE boundary value changes. Figure 10 depicts the relationship between the two.
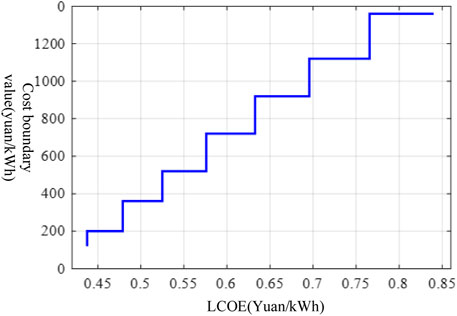
FIGURE 10. Cost boundary value.
From Figure 10, finding that the cost boundary value of decommissioned power batteries is directly proportional to LCOE is not difficult. Peak and trough electricity price spread in Jiangsu, Zhejiang, Hubei, and Shandong provinces will reach 0.7486 yuan/kWh, 0.503 yuan/kWh, 0.6116 yuan/kWh, and 0.568 yuan/kWh, respectively, under the new regulations. At this point, the national peak-to-valley electricity price difference is roughly 0.6 yuan/kWh, and if one only relies on “peak shaving and valley filling” to earn the peak-to-valley price difference income, the cost must be reduced to less than 0.8 yuan/kWh to achieve the decommissioning power battery cascade utilization profit. Combined with the cost change forecast of Figure 7, the investment recovery period needs to wait until 2026.
Conclusion
In this paper, an economic model of “peak-load cutting and valley filling” for retired batteries was established, as well as an economic boundary model based on leveling cost, to address the step utilization problem of a large number of retired power batteries. Through the simulation analysis of an actual decommissioned battery storage power station, the following can be concluded:
1) The decommissioned battery storage power station exhibits a good effect of “peak cutting and valley filling,” and it can effectively assist the power grid to participate in peak regulation. At the same time, it results in certain economic benefits, and the investment payback period is 4.2 years, which can recover the cost in the life cycle and exhibits investable value.
2) Battery recovery costs, technical costs, and cycle times all demonstrate an impact on the investment benefit and decision to decommission a battery storage power station. The retired battery cascade utilization demonstrates an investment value when the cycle number is 2,000 and the peak–valley price difference is greater than 0.8 yuan/kWh.
3) With the continuous introduction of peak–valley price difference policy and the continuous development of energy storage technology, a large space of investment value exists for the cascade utilization of retired power batteries. This paper’s analysis of an economic boundary model based on leveling costs provides a theoretical foundation for investors to make investment decisions.
In summary, the echelon utilization of decommissioned power batteries is affected by factors such as investment costs, peak-to-valley price differences, and cycle times. Therefore, when making investment decisions, investors need to make reasonable arrangements according to the actual working model.
Data Availability Statement
The original contributions presented in the study are included in the article/Supplementary Material, further inquiries can be directed to the corresponding author.
Author Contributions
ZY proposed the research direction and guided the project. YW, WW and SD were the primary writers of the manuscript. YW and AL revised the article language. All authors discussed the results and provided feedback on the manuscript.
Conflict of Interest
The authors declare that the research was conducted in the absence of any commercial or financial relationships that could be construed as a potential conflict of interest.
Publisher’s Note
All claims expressed in this article are solely those of the authors and do not necessarily represent those of their affiliated organizations, or those of the publisher, the editors, and the reviewers. Any product that may be evaluated in this article, or claim that may be made by its manufacturer, is not guaranteed or endorsed by the publisher.
References
Cai, S., and Li, Y. (2021). Incentive Policy for Battery Energy Storage Systems Based on Economic Evaluation Considering Flexibility and Reliability Benefits. Front. Energ. Res. 9, 634912. doi:10.3389/fenrg.2021.634912
Cao, S., Zhang, H., Cao, K., Chen, M., Wu, Y., and Zhou, S. (2021). Day-Ahead Economic Optimal Dispatch of Microgrid Cluster Considering Shared Energy Storage System and P2P Transaction. Front. Energ. Res. 9, 645017. doi:10.3389/fenrg.2021.645017
Chen, C. Q. (2016). Secure and Economic Dispatching on Grid-Connected Microgrid Considering Integrated of Wind energy[D]. Changsha: Hunan university.
Chen, C., Li, X., and Huang, J. (2022). Meter and Wind FM Peaceful Wave Suppression of Topology Structure Dynamic storage[J/OL]. Therm. Power generation 51 (04), 55–61. doi:10.19666/j.r.LFD.202108152
Cui, C. S., Xie, L. R., Bao, H. Y., and Zhang, H. (2020). Capacity Configuration of Retired Battery Energy Storage System for Smoothing Wind Power Fluctuations [J]. Chin. J. Power Sourc. 44 (8), 1185–1190. doi:10.3969/j.issn.1002-087X.2020.08.028
Fan, G. Q., Lyu, P., Fan, G. W., Huang, J., Chen, H., Wang, H., et al. (2021). Effect of Second-Use of Retired Batteries on New Energy Consumption [J]. Zhejiang Electric Power 40 (3), 121–126. doi:10.19585/j.zjdl.202103018
Fazelpour, F., Vafaeipour, M., Rahbari, O., and Rosen, M. A. (2014). Intelligent Optimization to Integrate a Plug-In Hybrid Electric Vehicle Smart Parking Lot with Renewable Energy Resources and Enhance Grid Characteristics. Energ. Convers. Manage. 77, 250–261. doi:10.1016/j.enconman.2013.09.006
Finn, P., Fitzpatrick, C., and Connolly, D. (2012). Demand Side Management of Electric Car Charging: Benefits for Consumer and Grid. Energy 42, 358–363. doi:10.1016/j.energy.2012.03.042
Gao, Y., Cai, Y., and Liu, C. (2022). Annual Operating Characteristics Analysis of Photovoltaic-Energy Storage Microgrid Based on Retired Lithium Iron Phosphate Batteries. J. Energ. Storage 45, 103769. doi:10.1016/j.est.2021.103769
Hlal, M. I., Ramachandaramurthy, V. K., Sarhan, A., Pouryekta, A., and Subramaniam, U. (2019). Optimum Battery Depth of Discharge for Off-Grid Solar PV/battery System. J. Energ. Storage 26, 100999. doi:10.1016/j.est.2019.100999
Jiang, F., Peng, X., Tu, C., Guo, Q., Deng, J., and Dai, F. (2021). An Improved Hybrid Parallel Compensator for Enhancing PV Power Transfer Capability. IEEE Trans. Ind. Electron., 1. doi:10.1109/TIE.2021.3121694
Jiang, F., Tu, C., Guo, Q., Shuai, Z., He, X., and He, J. (2019). Dual-Functional Dynamic Voltage Restorer to Limit Fault Current. IEEE Trans. Ind. Electron. 66 (7), 5300–5309. doi:10.1109/tie.2018.2868254
Kamath, D., Arsenault, R., Kim, H. C., and Anctil, A. (2020). Economic and Environmental Feasibility of Second-Life Lithium-Ion Batteries as Fast-Charging Energy Storage. Environ. Sci. Technol. 54 (11), 6878–6887. doi:10.1021/acs.est.9b05883
Klein, M., Tong, S., and Park, J. W. (2016). In-plane Nonuniform Temperature Effects on the Performance of a Large-Format Lithium-Ion Pouch Cell. Appl. Energ. 165, 639–647. doi:10.1016/j.apenergy.2015.11.090
Lai, X., Huang, Y., Deng, C., Gu, H., Han, X., Zheng, Y., et al. (2021). Sorting, Regrouping, and Echelon Utilization of the Large-Scale Retired Lithium Batteries: A Critical Review. Renew. Sustain. Energ. Rev. 146 (2), 111162. doi:10.1016/j.rser.2021.111162
Li, J. L., Li, Y. X., Lü, C., Zhou, W., Wu, Y. W., and Ma, S. L. (2022). Research on Key Technologies of Screening and Clustering Retired Batteries under the Target of Carbon Neutrality [J/OL]. Power Syst. Technol. 46 (02), 429–441. doi:10.13335/j.1000-3673.pst.2021.0655
Li, P., Liu, J., Deng, Z., Yang, Y., Lin, X., Jonathan, C., et al. (2022). Increasing Energy Utilization of Battery Energy Storage via Active Multivariable Fusion-Driven Balancing[J]. Energy 243, 122772. doi:10.1016/j.energy.2021.122772
Li, X., and Li, P. Q. (2021). Analysis on the Economics and Economic Boundaries of Largescale Application of Power Batteries in cascade utilization[J/OL]. Energ. Storage Sci. Technol. 11 (02), 717–725. doi:10.19799/j.cnki.2095-4239.2021.0487
Li, X. Q., Yu, H. F., Li, X. R., Zhang, D., Jiang, X., Zhu, S. R., et al. (2020). Planning Method for Multi-Functional Application Demand Considering Dynamic Life Cycle Characteristics of Energy Storage[J]. Electric Power Construction 41 (01), 45–54. doi:10.3969/j.issn.1000-7229.2020.01.006
Li, Y. Q., Peng, P., and Liu, B. J. (2021). Research on the Integration and Control Strategy of Echelon Use Battery Energy Storage System [J]. Power Elect. 55 (3), 13–16. doi:10.3969/j.issn.1000-100X.2021.03.004
Lu, L., Chen, S., Zhang, X., Pang, T., and Huang, C. X. (2021). Secondary Frequency Modulation Control Strategy for Power System Considering SOC Consistency of Large-Scale Battery Storage[J]. Therm. Power Generation 50 (07), 108–117. doi:10.19666/j.rlfd.202012296
Ma, L., Wei, C. W., Xie, L. R., and Wang, K. F. (2021). Coordinated Control Strategy for Wind Storage Active Power of Decommissioned Power Battery[J]. Acta Energiae Solaris Sinica 42 (10), 437–443. doi:10.19912/j.0254-0096.tynxb.2019fgc-0007
National Development and Reform Commission (2021). Notice of National Development and Reform Commission on Further Improving tOU Pricing Mechanism. https://www.ndrc.gov.cn/xxgk/zcfb/tz/202107/t20210729_1292067.html?code=&state=123.
Saini, P., and Gidwani, L. (2022). An Investigation for Battery Energy Storage System Installation with Renewable Energy Resources in Distribution System by Considering Residential, Commercial and Industrial Load Models. J. Energ. Storage 45, 103493. doi:10.1016/j.est.2021.103493
Sathre, R., Scown, C. D., Kavvada, O., and Hendrickson, T. P. (2015). Energy and Climate Effects of Second-Life Use of Electric Vehicle Batteries in California through 2050. J. Power Sourc. 288 (1), 82–91. doi:10.1016/j.jpowsour.2015.04.097
Sedighizadeh, M., Mohammadpour, A. H., and Alavi, S. M. M. (2019). A Two-Stage Optimal Energy Management by Using ADP and HBB-BC Algorithms for Microgrids with Renewable Energy Sources and Storages. J. Energ. Storage 21, 460–480. doi:10.1016/j.est.2018.12.010
Sun, Z., Tian, H., Wang, W. X., Pan, M. Y., and Zhang, L. (2021). Research on Economy of Echelon Utilization Battery Energy Storage System for User-Side Peak Load Shifting [J]. Acta Energiae Solaris Sinica 42 (4), 95–100. doi:10.19912/j.0254-0096.tynxb.2017-0369
Tian, J., Wang, Y., Liu, C., and Chen, Z. (2020). Consistency Evaluation and Cluster Analysis for Lithium-Ion Battery Pack in Electric Vehicles. Energy 194, 116944–116955. doi:10.1016/j.energy.2020.116944
Wang, J., Liu, W. X., Li, S. Q., Liu, Z. Q., Yang, M. Y., and Guo, H. M. (2020). A Method to Evaluate Economic Benefits of Power Side Battery Energy Storage Frequency/Peak Regulation Considering the Benefits of Reducing Thermal Power Unit Losses[J]. Power Syst. Technol. 44 (11), 4236–4245. doi:10.13335/j.1000-3673.pst.2020.0149
Wei, W., Wang, Y., Dai, S. F., Chen, C. Q., and Chen, L. (2021). Energy Storage Economic Optimization Scheduling Method for Multi-Scene Demand of Peak and Frequency Modulation[J]. Energies, 14. 8605. doi:10.3390/en14248605
Xie, B. J., Lou, W. M., Luo, Y. F., Wang, H. X., and Li, K. (2020). SOC Estimation of Decommissioned Lithium-Ion Batteries Based on H∞ Unscented Kalman Filter [J]. Zhejiang Electric Power 39 (8), 53–60. doi:10.19585/j.zjdl.202008009
Xu, X., Mi, J., Fan, M., Yang, K., Wang, H., Liu, J., et al. (2019). Study on the Performance Evaluation and Echelon Utilization of Retired LiFePO4 Power Battery for Smart Grid. J. Clean. Prod. 213, 1080–1086. doi:10.1016/j.jclepro.2018.12.262
Yan, X., Deng, H., Guo, Q., and Qu, W. (2019). Study on the State of Health Detection of Power Batteries Based on Adaptive Unscented Kalman Filters and the Battery Echelon Utilization[J]. Trans. China Electrotechnical Soc. 34 (18), 3937–3948. doi:10.19595/j.cnki.1000-6753.tces.171452
Yu, Y., and Zhou, D. W. (2020). Reheat Pressure Optimization of Secondary Reheat Unit with Cascade Cycle[J]. Therm. Power generation 49 (07), 142–146. doi:10.19666/j.rlfd.202001013
Zhang, C. L., Zhao, S. S., and Zhang, B. (2021). A Fast Classification Method Based on Factor Analysis and K-Means Clustering for Retired Electric Vehicle Batteries [J]. Power Syst. Prot. Control. 49 (12), 16–24. doi:10.19783/j.cnki.pspc.201413
Zhang, H., Huang, J., Hu, R., Zhou, D., Khan, H. u. R., and Ma, C. (2020). Echelon Utilization of Waste Power Batteries in New Energy Vehicles: Review of Chinese Policies. Energy 206, 118178. doi:10.1016/j.energy.2020.118178
Zhang, J., Guerra, O. J., Eichman, J., and Pellow, M. A. (2020). Benefit Analysis of Long-Duration Energy Storage in Power Systems with High Renewable Energy Shares. Front. Energ. Res. 8, 527910. doi:10.3389/fenrg.2020.527910
Zhao, W., Min, J., Li, Z. Y., Sun, R., and Jiang, Y. (2021b). Energy Utilization Efficiency Estimation Method for Second-Use Lithium-Ion Battery Packs Based on a Battery Consistency Model[J]. Trans. China Electrotechnical Soc. 36 (10), 2190–2198. doi:10.19595/j.cnki.1000-6753.tces.200243
Keywords: decommissioning power battery, echelon utilization, peak cutting and valley filling, power distribution, economic boundary
Citation: Wang Y, Ye Z, Wei W, Wu Y, Liu A and Dai S (2022) Economic Boundary Analysis of Echelon Utilization of Retired Power Battery Considering Replacement Cost. Front. Energy Res. 10:876299. doi: 10.3389/fenrg.2022.876299
Received: 15 February 2022; Accepted: 21 March 2022;
Published: 14 April 2022.
Edited by:
Liansong Xiong, Nanjing Institute of Technology (NJIT), ChinaReviewed by:
Ning Li, Xi’an University of Technology, ChinaZhang Lei, Capital Normal University, China
Donghai Zhu, Huazhong University of Science and Technology, China
Copyright © 2022 Wang, Ye, Wei, Wu, Liu and Dai. This is an open-access article distributed under the terms of the Creative Commons Attribution License (CC BY). The use, distribution or reproduction in other forums is permitted, provided the original author(s) and the copyright owner(s) are credited and that the original publication in this journal is cited, in accordance with accepted academic practice. No use, distribution or reproduction is permitted which does not comply with these terms.
*Correspondence: Wen Wei, d2Vpd2VuaG5AMTYzLmNvbQ==