 Xingyang Wu
 Feng Xue2
 Jianfeng Dai
95% of researchers rate our articles as excellent or good
Learn more about the work of our research integrity team to safeguard the quality of each article we publish.
Find out more
ORIGINAL RESEARCH article
Front. Energy Res. , 10 May 2022
Sec. Smart Grids
Volume 10 - 2022 | https://doi.org/10.3389/fenrg.2022.875785
This article is part of the Research Topic Innovative Methods and Techniques in New Electric Power Systems View all 17 articles
Represented by wind turbines and ultra high-voltage DC (UHVDC), the power-electronic interfaced power sources participate in fast frequency control, which has a significant impact on the power system frequency. However, the conventional under-frequency load shedding (UFLS) scheme doesn’t take into account the impact above, resulting in unreasonable load shedding after a large loss of generation. To this end, this article proposes an adaptive UFLS control strategy of power systems with wind turbines and UHVDC participating in frequency regulation. Firstly, based on the virtual inertia control model and the primary frequency control model of wind turbines and UHVDC, the study establishes the simplified frequency response model of the power system considering the participation of wind turbines and UHVDC in frequency regulation. Furthermore, the impact of the active power response characteristics of wind turbines and UHVDC participating in frequency regulation on the magnitude of the active power deficiency is comprehensively analyzed. Thus the precise estimation of the magnitude of the power deficiency can be achieved, which provides technical guidance for multi-stage UFLS. Finally, simulation results demonstrate that the proposed UFLS strategy is capable of reflecting the power system frequency more objectively after a large loss of generation event. In addition, the proposed UFLS strategy outperforms the conventional UFLS strategy in terms of shedding less amount of load when the same desired effect of frequency recovery is achieved.
The global electric power industry has been in a transition towards low-carbon sustainability in recent years. Conventional synchronous generators will be replaced by large-scale renewable energy sources connected to power systems in the future through power electronic devices (Tian et al., 2021). As a significant part of renewable energy generation, the development of wind power presents a large-scale and high-growth trend. By the end of 2020, the global installed capacity of wind power had reached approximately 743 GW, a 53% growth compared to 2019 [Global Wind Energy Council (GWEC), 2021]. The gradual replacement of the source-side synchronous generators with power electronic devices intensifies the power-electronization of power systems. Considering the characteristics of the reverse space distribution for renewable energy sources and load centers in some countries and regions, it is imperative to develop long-distance and large-capacity transmission technologies (Pérez-Molina et al., 2020). In China, advanced transmission technologies represented by UHVDC have been applied widely to the promotion of renewable energy consumption and the enhancement of the power supply capacity to load centers. The development of UHVDC transmission accelerates the growth of large-capacity grid-side power electronic devices.
The tendency towards the source- and grid-side power-electronization will dramatically decrease the total system inertia. The frequency stability issues existing in the conventional power systems are becoming more prominent, which is corroborated by incidents such as the blackout in South Australia in September 2016 and the power cut in the U.K. in August 2019 (Australian Energy Market Operator, 2016; National Grid ESO, 2019). To arrest cascading failures and blackouts after a large disturbance occurs in the power grid, UFLS is fully used as the last defense line of the frequency stability control. Generally, we can group all the UFLS schemes into three main categories: conventional UFLS, semi-adaptive UFLS, and adaptive UFLS (Kundur, 2001). In the conventional UFLS schemes, the stages of load shedding, the frequency thresholds of the stages, the time delay, and the load shedding amount are all predefined. Once the frequency drops below the frequency threshold, load shedding is implemented after a certain time delay. The settings of the conventional UFLS schemes derive from assorted presumed power grid parameters including the total system inertia (Horowitz and Phadke, 2008). The time-variant characteristics of the power systems, as well as limited stages and discreteness of load shedding, contribute to the inadaptability of the conventional UFLS schemes to all the system operating conditions. Consequently, it is prone to over- or under-shedding (Sigrist et al., 2012; Rudez and Mihalic, 2016).
To surmount the problems above, numerous scholars have been devoted to the research on semi-adaptive and adaptive UFLS schemes. The load to be shed is determined by the frequency deviation and the rate of change of frequency (RoCoF) in the semi-adaptive UFLS schemes (Anderson and Mirheydar, 1992). In the first stage of load shedding, the amount of load to be shed is calculated based on the swing equation. For the subsequent stages, however, the load shedding amount is predefined. Load shedding is triggered according to the frequency deviation. Hence, semi-adaptive UFLS schemes can not be immune to the problem of inappropriate load shedding. To fill the gap, adaptive UFLS schemes are proposed. The progress of widearea monitoring system (WAMS) technology promotes several adaptive UFLS schemes (Terzija, 2006; Abdelwahid et al., 2014; Tofis et al., 2017). The amount of load shedding is determined by taking advantage of the valuable information provided by WAMS. In addition, numerous scholars pay attention to the thorough and often mathematically complex modification of the entire UFLS (Skrjanc et al., 2021). In (Hoseinzadeh et al., 2015), a voltage deviation of load buses is used to determine the threshold of each UFLS relay. On the contrary, a continuous UFLS scheme to shed loads in proportion to the frequency deviation is proposed in (Li et al., 2020).
It can be observed from the summarization of the research results that, although massive remarkable work has been done from various angles, there are scarcely any studies on the actual impact of the power-electronic interfaced power sources represented by wind power and UHVDC participating in fast frequency control (Eriksson et al., 2018) on UFLS. In modern power systems, wind turbines mainly use rotor speed control to improve the inertia and primary frequency regulation ability of the system, while variable pitch angle control and matching energy storage system are adopted to improve the rotating reserve capacity of wind farms participating in the system frequency regulation (Vidyanandan and Senroy, 2013; Van de Vyver et al., 2016; Ye et al., 2016; Lyu et al., 2019). In (Li et al., 2017), the impact of virtual inertia response, as well as the characteristics of the under-frequency protection and the power output on the UFLS scheme, are investigated. The UFLS scheme is optimized according to the dynamic calculation of the magnitude of the power deficiency. As one of the main power supplies in the future power grid, wind turbines are required to take the responsibility for frequency regulation by many power systems operators. A UFLS scheme considering the virtual inertia response and the primary frequency control of doubly fed induction generator (DFIG)-based wind turbines is proposed in (Li et al., 2019), which reflects the frequency characteristics of the power grid more objectively. Moreover, the amount of load to be shed in the scheme is less. For UHVDC transmission systems, the characteristics of large transmission capacity and fast power regulation speed make it possible to participate in frequency regulation, which is of great significance to ensure the frequency safety of the power grid. The frequency regulation mechanism, response characteristics, parameter tuning method and limiting factors are quite different from those of wind power generation systems. In (Prakash et al., 2019), an auxiliary frequency control strategy with additional frequency control and automatic generation control for HVDC transmission is presented. In (Ambia et al., 2021), a novel adaptive droop control strategy is proposed to provide power sharing and frequency regulation in HVDC systems. Though the research results above are of great significance in supporting the system frequency stability, none of them makes an attempt to use UHVDC transmission systems to provide inertia support. To address the issue, the coordinated frequency control proposed in (Shi et al., 2021) is realized by introducing the virtual inertia control on the basis of the frequency droop control.
From the analysis above, it is obvious that the participation of wind turbines and UHVDC in frequency regulation shows a great favorable influence on the frequency characteristics of the power grid. However, none of the existing UFLS schemes take into account the actual effect of frequency regulation with the participation of wind turbines and UHVDC. On one hand, the virtual inertia response of wind turbines and UHVDC leads to the alteration of the equivalent inertia of the power grid, further influencing the calculation of the magnitude of the power deficiency. On the other hand, the primary frequency control of wind turbines and UHVDC can offset the power deficiency. Ignoring the offset will bring about the problems of over-shedding and economic loss. Therefore, the existing UFLS schemes are not applicable to the modern power system with wind turbines and UHVDC participating in frequency regulation. It is urgent to solve the issue for the sake of the frequency safety of the power grid.
This article proposes an adaptive UFLS control strategy of the power system with wind turbines and UHVDC participating in frequency regulation. Firstly, based on the virtual inertia control model and the primary frequency control model, we establish the simplified frequency response model of the power system considering the participation of wind turbines and UHVDC in frequency regulation. Then the impact of the active power response characteristics of wind turbines and UHVDC participating in frequency regulation on the magnitude of the power deficiency is comprehensively analyzed. Afterward, in light of the estimation result of the magnitude of the power deficiency, the amount of load to be shed in the multi-stage UFLS scheme is determined. Finally, simulation results are presented and discussed to illustrate the outperformance of the proposed UFLS control strategy.
After the integration of a high proportion of wind power and UHVDC, wind turbines and UHVDC participate in frequency regulation by means of virtual inertia control and primary frequency control. However, the existing UFLS schemes do not take into account the situation, which possibly causes frequency trajectory distortion and unreasonable load shedding. To address the issue, this paper proposes an adaptive UFLS control strategy of power systems with wind turbines and UHVDC participating in frequency regulation. The overall scheme of the strategy is shown in Figure 1.
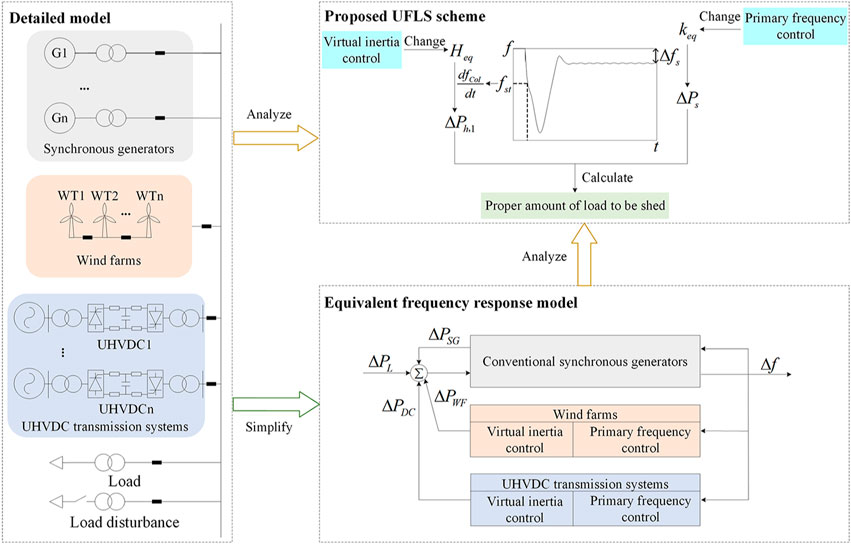
FIGURE 1. Overall scheme of the proposed UFLS control strategy.
It can be seen from Figure 1 that, this paper firstly simplifies the detailed models of synchronous generators, wind turbines, UHVDC and load. Afterward, the equivalent frequency response model of the power system considering the virtual inertia control and the primary frequency control of the wind turbines and UHVDC is obtained. Based on the detailed models and the equivalent frequency response model, this paper analyzes the two main effects which are brought about by the integration of large-scale wind power and UHVDC on the power grid. For one thing, the virtual inertia control of the wind turbines and UHVDC changes the equivalent inertia constant of the power grid
Taking DFIG-based wind turbines as an example, the control model of the wind turbines participating in frequency regulation is analyzed and established considering the virtual inertia control and the primary frequency control.
DFIG-based wind turbines lack intrinsic inertia from the system aspect for the reason that their mechanical rotor speed is decoupled with system frequency. However, by introducing an auxiliary virtual inertia control loop in the maximum power tracking loop of the DFIG rotor-side convertor, the wind turbines can also supply the power grid with the virtual inertia response. The rate of change of frequency, i.e.
Where
Similar to the droop control of synchronous generators, the primary frequency control of the wind turbines is designed in this study. The frequency deviation, i.e.
Where
The control model of the wind turbines participating in frequency regulation combines the virtual inertia control and the primary frequency control holistically. Figure 2 shows the control block diagram.
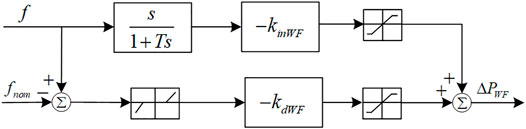
FIGURE 2. Control block diagram of wind turbines participating in frequency regulation.
In Figure 2,
At present, the participation of UHVDC transmission systems in frequency regulation mainly includes two frequency control modes based on the PI controller and the droop controller, respectively. In this article, the frequency control mode based on the droop controller is used as the primary frequency control of UHVDC. The control block diagram is shown in Figure 3.
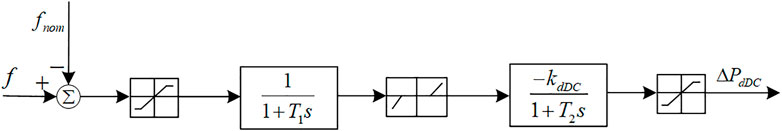
FIGURE 3. Block diagram of the primary frequency control base on the droop controller of UHVDC.
In Figure 3,
By introducing the virtual inertia control on the basis of the regular droop control, UHVDC is capable of participating in the process of the system inertia response. It helps to reduce the rate and range of the frequency deviation when the power grid suffers a huge power deficiency. The active power increment
Where
Similar to the control model of wind turbines participating in frequency regulation established in Section 3.1, the droop control of UHVDC is mainly in response to the frequency deviation, while the virtual inertia control of UHVDC is mainly in response to the frequency differential quantity. Thus UHVDC can simultaneously participate in the process of the inertia response and the primary frequency control, the same as synchronous generators.
As shown in Figure 4, typical HVDC transmission system mainly consists of rectifier station, DC tansmission line and inverter station. In this paper, the virtual inertia control and the primary frequency control of UHVDC can be realized by modifying the UHVDC control systems.

FIGURE 4. Typical HVDC transmission system with the implementation of virtual inertia control and primary frequency control.
The power regulation of UHVDC systems is rapid enough to ensure that the response time is no longer than 150 ms after a power step disturbance occurs. The frequency regulation process of the power system belongs to the electromechanical transient process, of which the timescale is usually second level. Therefore, the regulation process of the UHVDC systems can be neglected in the process of analyzing the UHVDC frequency regulation mechanism, and the UHVDC transmission power strictly tracks the reference command. In addition, the effects of the filtering link, the deadband link, and the power amplitude limiting link are further neglected to simplify the analyzing process.
Based on the analysis above, the equivalent frequency response model of the power system including the virtual inertia control and the primary frequency control of wind turbines and UHVDC is shown in Figure 5. Where
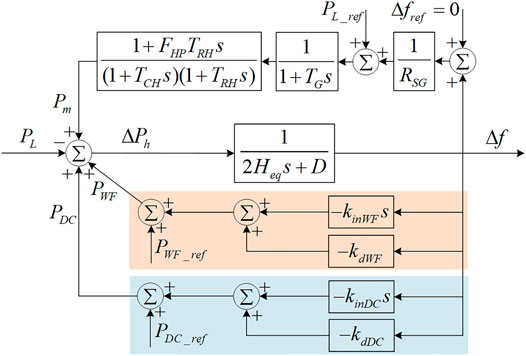
FIGURE 5. Equivalent frequency response model of the power system.
Assume that a sudden increase of load occurs and results in a power deficiency
where
The participation of the wind turbines and UHVDC in frequency regulation of the power system affects UFLS mainly from two aspects as follows: 1) The virtual inertia control provides the wind turbines and UHVDC with virtual inertia and changes the equivalent inertia of the power grid, thus influencing the calculation of the magnitude of the power deficiency. 2) The primary frequency control of the wind turbines and UHVDC offsets part of the magnitude of the power deficiency corresponding to the steady-state frequency deviation, which contributes to less amount of load to be shed. In conclusion, both the virtual inertia control and the primary frequency control influence the calculation result of the total amount of load to be shed in the UFLS scheme.
When we study the frequency characteristics of the power system integrated with wind power and UHVDC, one of the difficult problems we face with is the calculation of the system equivalent inertia constant
It is obvious from Eq. 6 that we can calculate
Furthermore, in order to reduce the error of calculating the equivalent inertia constant
After the system equivalent inertia constant
Assume that the steady-state frequency after UFLS is
where
Then the total amount of load to be shed
where
Then the total amount of the load will be shed by stages. It is obvious from Eq. 9 that the primary frequency control of the wind turbines and UHVDC leads to the increase in their active power output in steady state, thus reducing
Firstly, determine the stages, frequency thresholds, load shedding percentage in each stage, and steady-state recovery frequency in the UFLS control strategy.
In the process of UFLS, the first frequency threshold should not exceed 49.25 Hz to fully use the rotating reserve capacity of the power system. The typical frequency difference between the stages is 0.2∼0.25 Hz and 5∼8 stages are commonly set. Based on the UFLS schemes of actual power grids, this paper sets four basic stages with the corresponding frequency thresholds of 49.2, 49.0, 48.8, 48.6 Hz, and the time delay of 0.2 s. The load shedding percentages in the basic stages are 20, 25, 25, and 30%, separately.
Afterward, determine the location and the amount of load to be shed in the UFLS control strategy.
In the actual operation of UFLS, the load of the scattered nodes needs to be shed. The load shedding location can be selected and the load shedding amount can be allocated based on the load shedding sensitivity index (Yang and Cai, 2016). The load shedding amount of the
where
Finally, design the UFLS implementation strategy.
In this study, the UFLS control strategy is implemented as shown in Figure 6. The corresponding steps can be described as follows:
1) Set the frequency threshold
2) Detect the frequency state of the power system. If
3) On the basis of
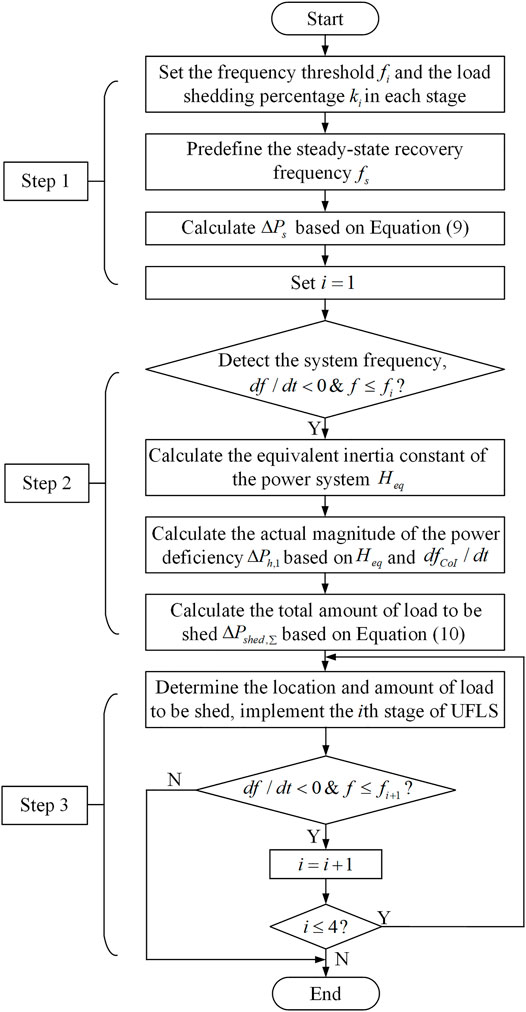
FIGURE 6. Flowchart of the proposed UFLS control strategy.
It can be seen from Figure 6 that when the system frequency reaches the threshold of the
In this section, simulations are carried out on the IEEE 39-bus test system. Power System Analysis Synthesis Program (PSASP) developed by China Electric Power Research Institute is used to conduct the simulation studies. The single-line diagram of this test system is provided in Figure 7. Suppose that DFIG-based wind turbines are connected at Bus 34 and Bus 36 replacing the thermal generators with equal active power output. A UHVDC transmission line with a rated active power output of 1000 MW is connected to the system at Bus 18, replacing the thermal generators at Bus 30 and Bus 32. To achieve the power equilibrium, we also reduce the active power output of the thermal generator at Bus 31. Both the wind turbines and UHVDC have the abilities of virtual inertia control and primary frequency control. We set the available capacity of the wind turbines for frequency regulation as 10% of their rated active power (Lyu et al., 2021). The available capacity of UHVDC for frequency regulation is set as 5% of its rated active power (Zhao, 2004).
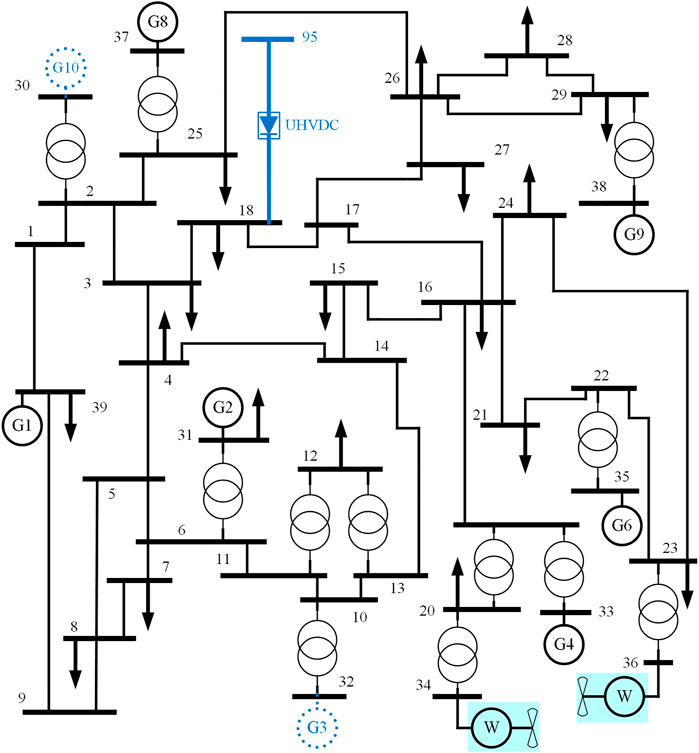
FIGURE 7. Single-line diagram of the IEEE 39-bus test system with wind turbines and UHVDC.
In this case, when
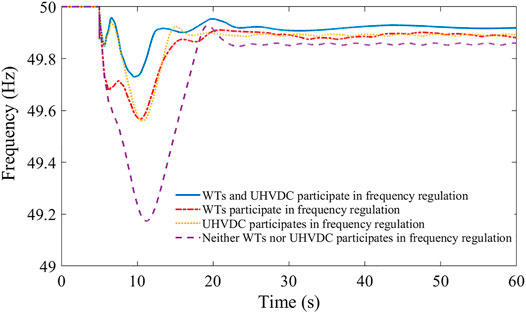
FIGURE 8. Frequency curves under different frequency control modes.
It is revealed from Figure 8 that when neither the wind turbines nor UHVDC participates in frequency regulation, the maximum frequency deviation is the largest and the steady-state frequency is the lowest of the four frequency control modes. Besides, the frequency nadir drops below 49.2 Hz, violating the frequency threshold of the first stage. Once the wind turbines or UHVDC participates in frequency regulation, the absolute maximum frequency deviation decreases by 0.4 Hz, and the steady-state frequency is higher. When both the wind turbines and UHVDC participate in frequency regulation, the maximum frequency deviation and the steady-state frequency deviation are the minima. It can be inferred that the participation of the wind turbines and UHVDC in frequency regulation can effectively ameliorate the system frequency characteristics. The combined action of the virtual inertia control and the primary frequency control significantly decreases the maximum frequency deviation and the steady-state frequency deviation. Thus the dynamic process and the trajectory of the system frequency are notably impacted by the participation of the wind turbines and UHVDC in frequency regulation.
For cases in Sections 5.2, 5.3, and 5.4, a 780 MW load surge at Bus 21 at the time
In this case, both the wind turbines and UHVDC in the test system possess the capability of virtual inertia control actually. However, to illustrate the impact of the virtual inertia control of the wind turbines and UHVDC on UFLS, we consider four different situations in the process of formulating four UFLS schemes respectively: 1) both the wind turbines and UHVDC participate in virtual inertia control; 2) only the wind turbines participate in virtual inertia control; 3) only UHVDC participates in virtual inertia control; 4) neither the wind turbines nor UHVDC participates in virtual inertia control. Then the four UFLS schemes are implemented on the same test system in which both the wind turbines and UHVDC participate in virtual inertia control, separately. The simulation results are shown in Figure 9 and Table 1.

FIGURE 9. Frequency curves under different UFLS schemes considering different virtual inertia control modes.

TABLE 1. Results of different UFLS schemes considering different virtual inertia control modes.
It can be seen from Figure 9 and Table 1 that, the steady-state recovery frequency in scheme 1 is the highest, followed by scheme 3 and scheme 2, while in scheme 4 is the lowest. The reason is that for one thing, the virtual inertia control of the wind turbines and UHVDC is considered in scheme 1 so that the calculated inertia constant
The simulation results in this case also demonstrate that when the virtual inertia control of the wind turbines and UHVDC is taken into consideration, scheme 1 can calculate the actual magnitude of the power deficiency more precisely and reflect the effect of the virtual inertia control on UFLS more objectively. Obviously, the effect is significant.
In this case, to illustrate the impact of the primary frequency control of the wind turbines and UHVDC on UFLS, design and contrast four different UFLS schemes: 1) UFLS scheme considering the primary frequency control of both the wind turbines and UHVDC; 2) UFLS scheme only considering the primary frequency control of the wind turbines; 3) UFLS scheme only considering the primary frequency control of UHVDC; 4) UFLS scheme without considering the primary frequency control of wind turbines or UHVDC. Then each of the four schemes is implemented on the test system with the primary frequency control mode corresponding to the scheme itself. The simulation results are shown in Figure 10 and Table 2.

FIGURE 10. Frequency curves under different UFLS schemes considering different primary frequency control modes.
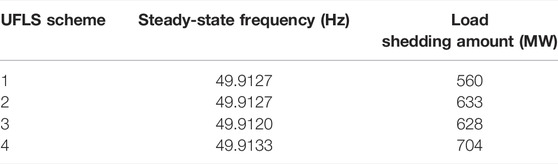
TABLE 2. Results of different UFLS schemes considering different primary frequency control modes.
It can be observed from Figure 10 and Table 2 that, the steady-state recovery frequency is almost the same in the four schemes. However, the amount of load to be shed
In this case, simulations are conducted to compare three different UFLS schemes. Scheme 1 is the scheme proposed in this paper, which is performed according to the implementation strategy of UFLS in Figure 5. Scheme 2 is the conventional UFLS scheme in literature (Rudez and Mihalic, 2011). Scheme 3 is the adaptive UFLS scheme in literature (Song et al., 2014) without considering the virtual inertia control and the primary frequency control of the wind turbines and UHVDC. Compare the frequency response curves and the steady-state results of all the schemes in the process of UFLS. The simulation results are shown in Figure 11 and Table 3.
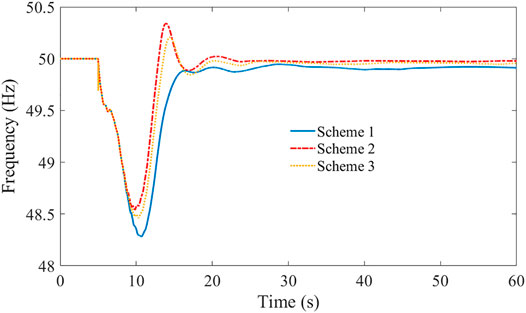
FIGURE 11. Comparison of different UFLS schemes.
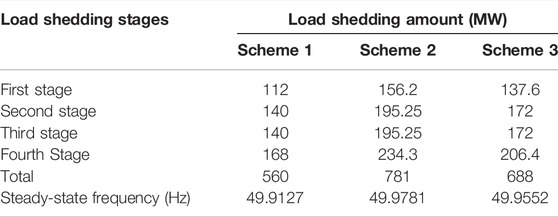
TABLE 3. Load shedding amount and steady-state frequency of different UFLS schemes.
It can be seen from Figure 11 and Table 3 that all the schemes complete the action process of UFLS through four stages of load shedding, and the steady-state recovery frequency is close. However, the load shedding amount in scheme 1 is evidently less than that in scheme 2 and scheme 3 in each stage and in total. The reasons for the difference in the load shedding amount are as follows. On one hand, the actual magnitude of the power deficiency
This paper proposes an adaptive UFLS control strategy of power systems with wind turbines and UHVDC participating in frequency regulation. The following conclusions are obtained through theoretical research and simulation verification.
1) The virtual inertia control of the wind power and UHVDC has a significant impact on the frequency dynamic process and trajectory, resulting in the obvious differences in the calculation results of the magnitude of the power deficiency and the amount of load to be shed, which makes the steady-state recovery frequency higher.
2) The primary frequency control of the wind power and UHVDC can effectively offset part of the power deficiency magnitude and reduce the load shedding amount.
3) Compared with the existing typical UFLS strategies, on the premise of reaching the same level of steady-state recovery frequency, the strategy proposed in this paper can shed the least amount of load. Moreover, it can better adapt to the UFLS process of the power grid with the wind turbines and UHVDC participating in frequency regulation.
This paper takes DFIG-based wind turbines and UHVDC as examples to discuss the UFLS control strategy. In the future, we will further study other UFLS improvement strategies considering frequency regulation of other types of renewable energy, flexible DC, and energy storage, so as to provide a better guarantee for the safety and stability of the power grid frequency.
The original contributions presented in the study are included in the article/Supplementary Material, further inquiries can be directed to the corresponding author.
XW: Methodology, Software, Validation, Investigation, Data curation, Writing—original draft preparation, Visualization. FX: Methodology, Formal analysis, Supervision. JD: Conceptualization, Validation, Writing—review and editing. YT: Resources, Writing—review and editing.
Author FX was employed by the NARI Group Corporation (State Grid Electric Power Research Institute).
The remaining authors declare that the research was conducted in the absence of any commercial or financial relationships that could be construed as a potential conflict of interest.
All claims expressed in this article are solely those of the authors and do not necessarily represent those of their affiliated organizations, or those of the publisher, the editors and the reviewers. Any product that may be evaluated in this article, or claim that may be made by its manufacturer, is not guaranteed or endorsed by the publisher.
The Supplementary Material for this article can be found online at: https://www.frontiersin.org/articles/10.3389/fenrg.2022.875785/full#supplementary-material
Abdelwahid, S., Babiker, A., Eltom, A., and Kobet, G. (2014). Hardware Implementation of an Automatic Adaptive Centralized Underfrequency Load Shedding Scheme. IEEE Trans. Power Deliv. 29 (6), 2664–2673. doi:10.1109/TPWRD.2014.2331495
Ambia, M. N., Meng, K., Xiao, W., Al-Durra, A., and Dong, Z. Y. (2021). Adaptive Droop Control of Multi-Terminal HVDC Network for Frequency Regulation and Power Sharing. IEEE Trans. Power Syst. 36 (1), 566–578. doi:10.1109/TPWRS.2020.2999443
Anderson, P. M., and Mirheydar, M. (1992). An Adaptive Method for Setting Underfrequency Load Shedding Relays. IEEE Trans. Power Syst. 7 (2), 647–655. doi:10.1109/59.141770
Australian Energy Market Operator (2016). Black System South Australia 28 September 2016—Third Preliminary Report. Australia: Australian Energy Market Operator Limited.
Eriksson, R., Modig, N., and Elkington, K. (2018). Synthetic Inertia versus Fast Frequency Response: A Definition. IET Renew. Power Generation 12 (5), 507–514. doi:10.1049/iet-rpg.2017.0370
Global Wind Energy Council (GWEC) (2021). Global Wind Report 2021. Brussels, Belgium: Global Wind Energy Council.
Hoseinzadeh, B., da Silva, F. M. F., and Bak, C. L. (2015). Adaptive Tuning of Frequency Thresholds Using Voltage Drop Data in Decentralized Load Shedding. IEEE Trans. Power Syst. 30 (4), 2055–2062. doi:10.1109/TPWRS.2014.2351015
Li, C., Wu, Y., Sun, Y., Zhang, H., Liu, Y., Liu, Y., et al. (2020). Continuous Under-frequency Load Shedding Scheme for Power System Adaptive Frequency Control. IEEE Trans. Power Syst. 35 (2), 950–961. doi:10.1109/TPWRS.2019.2943150
Li, S. C., Lyu, X. S., Zhong, H., Long, Q. W., Xie, W. J., and Shu, Z. Y. (2019). Adaptive Under-frequency Load Shedding Strategy of Power Grid with Large-Scale DFIG Wind Turbines Participating in Frequency Regulation. Automation Electric Power Syst. 43 (15), 109–120. doi:10.7500/AEPS2018112800
Li, S., Liao, Q. F., Tang, F., Zhao, H. S., and Shao, Y. G. (2017). Adaptive Underfrequency Load Shedding Strategy Considering High Wind Power Penetration. Power Syst. Tech. 41 (4), 1084–1090. doi:10.13335/j.1000-3673.pst.2016.3029
Lyu, X., Jia, Y., and Dong, Z. (2021). Adaptive Frequency Responsive Control for Wind Farm Considering Wake Interaction. J. Mod. Power Syst. Clean Energ. 9 (5), 1066–1075. doi:10.35833/MPCE.2020.000237
Lyu, X., Zhao, J., Jia, Y., Xu, Z., and Wong, K. P. (2019). Coordinated Control Strategies of PMSG-Based Wind Turbine for Smoothing Power Fluctuations. IEEE Trans. Power Syst. 34 (1), 391–401. doi:10.1109/TPWRS.2018.2866629
National Grid ESO. (2019). Technical Report on the Events of 9 August. Available at: https://www.nationalgrideso.com/document/152346/download (Accessed September 6, 2019).
Pérez-Molina, M. J., Larruskain, D. M., López, P. E., and Buigues, G. (2020). Challenges for Protection of Future HVDC Grids. Front. Energ. Res. 8, 33. doi:10.3389/fenrg.2020.00033
Prakash, A., Murali, S., Shankar, R., and Bhushan, R. (2019). HVDC Tie-Link Modeling for Restructured AGC Using a Novel Fractional Order cascade Controller. Electric Power Syst. Res. 170, 244–258. doi:10.1016/j.epsr.2019.01.021
Rudez, U., and Mihalic, R. (2011). Monitoring the First Frequency Derivative to Improve Adaptive Underfrequency Load-Shedding Schemes. IEEE Trans. Power Syst. 26 (2), 839–846. doi:10.1109/TPWRS.2010.2059715
Rudez, U., and Mihalic, R. (2016). WAMS-based Underfrequency Load Shedding with Short-Term Frequency Prediction. IEEE Trans. Power Deliv. 31 (4), 1912–1920. doi:10.1109/TPWRD.2015.2503734
Shi, Q. M., Guo, M. Q., Liu, K., Wang, Y., Zou, X., Zou, Q., et al. (2021). Coordinated Frequency Control for UHVDC Considering Inertia Response. Power Syst. Tech. 45 (9), 1084–1090. doi:10.13335/j.1000-3673.pst.2021.0015
Sigrist, L., Egido, I., and Rouco, L. (2012). A Method for the Design of UFLS Schemes of Small Isolated Power Systems. IEEE Trans. Power Syst. 27 (2), 951–958. doi:10.1109/TPWRS.2011.2174448
Skrjanc, T., Mihalic, R., and Rudez, U. (2021). A Non-Intrusive Approach for Enhancing Power-System Frequency Stability. IEEE Trans. Power Syst., 1. doi:10.1109/TPWRS.2021.3131098
Song, Z. O., Liu, J. Y., Liu, Y., Masoud, B., and Liang, W. (2014). WAMS-based Adaptive UFLS Considering Dynamic Correction. Electric Power Automation Equipment 34 (4), 95–100. doi:10.3969/j.issn.1006-6047.2014.04.017
Terzija, V. V. (2006). Adaptive Underfrequency Load Shedding Based on the Magnitude of the Disturbance Estimation. IEEE Trans. Power Syst. 21 (3), 1260–1266. doi:10.1109/TPWRS.2006.879315
Tian, Z., Xiao, Q.-W., and Ren, F.-R. (2021). Assessing the Efficiency and CO2 Reduction Performance of China's Regional Wind Power Industry Using an Epsilon-Based Measure Model. Front. Energ. Res. 9, 672183. doi:10.3389/fenrg.2021.672183
Tofis, Y., Timotheou, S., and Kyriakides, E. (2017). Minimal Load Shedding Using the Swing Equation. IEEE Trans. Power Syst. 32 (3), 2466–2467. doi:10.1109/TPWRS.2016.2614886
Van de Vyver, J., De Kooning, J. D. M., Meersman, B., Vandevelde, L., and Vandoorn, T. L. (2016). Droop Control as an Alternative Inertial Response Strategy for the Synthetic Inertia on Wind Turbines. IEEE Trans. Power Syst. 31 (2), 1129–1138. doi:10.1109/TPWRS.2015.2417758
Vidyanandan, K. V., and Senroy, N. (2013). Primary Frequency Regulation by Deloaded Wind Turbines Using Variable Droop. IEEE Trans. Power Syst. 28 (2), 837–846. doi:10.1109/TPWRS.2012.2208233
Yang, D. Y., and Cai, G. W. (2016). The Sensitivity of Load Shedding Control and its Application in Wide-Area Low Frequency Protection. Electric Power Automation Equipment 36 (3), 124–128. doi:10.16081/j.issn.1006-6047.2016.03.019
Ye, H., Pei, W., and Qi, Z. (2016). Analytical Modeling of Inertial and Droop Responses from a Wind Farm for Short-Term Frequency Regulation in Power Systems. IEEE Trans. Power Syst. 31 (5), 3414–3423. doi:10.1109/TPWRS.2015.2490342
Keywords: wind turbines, ultra high-voltage DC, under-frequency load shedding, virtual inertia control, primary frequency control, equivalent inertia constant, actual magnitude of power deficiency
Citation: Wu X, Xue F, Dai J and Tang Y (2022) Adaptive Under-Frequency Load Shedding Control Strategy of Power Systems With Wind Turbines and UHVDC Participating in Frequency Regulation. Front. Energy Res. 10:875785. doi: 10.3389/fenrg.2022.875785
Received: 14 February 2022; Accepted: 11 April 2022;
Published: 10 May 2022.
Edited by:
Xiao Wang, Wuhan University, ChinaReviewed by:
Rafael Mihalič, University of Ljubljana, SloveniaCopyright © 2022 Wu, Xue, Dai and Tang. This is an open-access article distributed under the terms of the Creative Commons Attribution License (CC BY). The use, distribution or reproduction in other forums is permitted, provided the original author(s) and the copyright owner(s) are credited and that the original publication in this journal is cited, in accordance with accepted academic practice. No use, distribution or reproduction is permitted which does not comply with these terms.
*Correspondence: Xingyang Wu, d3V4aW5neWFuZ0BoaHUuZWR1LmNu
Disclaimer: All claims expressed in this article are solely those of the authors and do not necessarily represent those of their affiliated organizations, or those of the publisher, the editors and the reviewers. Any product that may be evaluated in this article or claim that may be made by its manufacturer is not guaranteed or endorsed by the publisher.
Research integrity at Frontiers
Learn more about the work of our research integrity team to safeguard the quality of each article we publish.