 Hanghang He
 Yanghong Xia
 Wei Wei
95% of researchers rate our articles as excellent or good
Learn more about the work of our research integrity team to safeguard the quality of each article we publish.
Find out more
ORIGINAL RESEARCH article
Front. Energy Res. , 12 April 2022
Sec. Solar Energy
Volume 10 - 2022 | https://doi.org/10.3389/fenrg.2022.875654
This article is part of the Research Topic Smart Solar Photovoltaic Inverters with Grid-Supportive Services View all 9 articles
As dominant power sources, the safe and reliable operation of photovoltaic (PV) generators is crucial for the DC distribution network. This study analyzes the transient stability of PV generators under large disturbances and proposes a variable parameter control strategy to suppress the transient instability. First, the transient stability of the PV generators is analyzed using the proposed power–voltage evolution curve. It is found that the PV side easily suffers undervoltage faults during the transient process, which will cause instability of the system. Based on the revealed unstable mechanism, the variable parameter control is proposed to enhance the transient stability of PV generators. Finally, all the findings have been validated by hardware-in-loop tests.
In recent years, the demand for clean renewable energy sources has attracted the worldwide attention in order to alleviate the environmental degradation and the traditional fossil fuel energy depletion crisis (Chaiyatham and Ngamroo, 2017). As one of the most important renewable energy sources, solar energy is of great significance to energy security (Zhao et al., 2019), and photovoltaic (PV) power generation is the major form to utilize solar energy. Thanks to the technological advancements in solar cell manufacturing and semiconductors, the inexhaustible PV generators have been developed into one of the most prospective sources (Farsi and Liu, 2020) (Safayatullah et al., 2021).
PV generation technology has been developing rapidly all over the world; many scholars have conducted extensive and in-depth research on current issues such as PV system modeling (Li et al., 2011; Liu et al., 2011; Li, 2013), power generation (Eftekharnejad et al., 2015; Sangwongwanich et al., 2016; Fathabadi, 2019), materials (Uprety et al., 2018;Bosco et al., 2020), and control strategies (Shadmand et al., 2014; Weckx et al., 2014; Quan et al., 2020), and many achievements have been obtained. However, with the expansion of the PV power generation scale, especially as the role of PV power generation changes from auxiliary power to dominant power, its dynamic characteristics play an important role in the stable operation of power system. Due to the intermittent and fluctuation characteristics of PV power generation, its large-scale grid connection brings great challenges to the stability of the power system (Kawabe and Tanaka, 2015) (Wang et al., 2016).
PV generators show DC characteristics, and if they can be connected to the DC distribution, additional DC/AC conversion stages will be saved compared to being connected to the traditional AC distribution network (Azeem et al., 2020). On the other hand, the DC distribution network can also avoid additional DC/AC conversion stages when providing power for DC loads. Therefore, the development of the DC distribution network can obviously improve system efficiency when the power system integrates DC sources and DC loads (Song et al., 2013). Nevertheless, with the high penetration of PV generators, the dynamics and characteristics of DC distribution network will be changed profoundly, and the system stability is greatly influenced (Eftekharnejad et al., 2013; Lammert et al., 2019).
Shah et al. (2015) extensively reviewed the stability challenges for the integration of large-scale PV generators. The existing studies on the stability analysis of PV generators can be divided into small-signal stability (Majumder, 2013; Coelho et al., 1999) and transient stability (or large-signal stability) (Ishchenko et al., 2006; Chen et al., 2010; Xiao and Fang, 2010; Fu et al., 2014). The former topic focuses on the system dynamics under small disturbances, while the latter topic mainly pays attention to the system dynamics under large disturbances. Much attention is paid to small-signal stability, and relevant research on different problems such as power harmonic stability (Wang and Blaabjerg, 2019; Wang et al., 2014), harmonic resonance (Hong et al., 2019; He et al., 2013), and weak grid (Xia et al., 2019; Dahal et al., 2011) are mature. Moreover, related analysis methods such as impedance analysis (Sun, 2011; Zeng et al., 2011; Zhou et al., 2018), modal analysis (Kouki et al., 2020), and state space method (Davari and Mohamed, 2017; Huang et al., 2015) have been discussed in depth. However, if large disturbances occur, the small-signal stability analysis is no longer applicable, and the transient stability analysis is indispensable. Transient stability refers to the ability of the system to resume normal operation after a sudden and serious failure occurs (Kundur, 1994), while only a few research studies can be found on this field, especially for the PV generators in the DC distribution network.
In Yagami and Tamura (2012), the influence of PV generators on transient stability of the power system has been analyzed using a single-machine infinite bus system. Furthermore, Liu et al. (2011) revealed the key factors that influence the transient stability including fault locations, disturbance types, topologies, and high PV penetration levels. In Priyamvada and Das (2020), a transient stability criterion for PV generators with DC-link control and reactive power control is proposed, and this criterion is applicable to all kinds of short circuit faults. Huang et al. (2019) explained the transient stability behavior of the droop-controlled voltage source converters (VSC) theoretically. This study shows that transient instability will occur to the droop-controlled VSC when its current is saturated under large disturbances. Then, a modified P-f droop control is proposed to deal with this problem and to enhance the system transient stability. In Zhang et al. (2017), the transient stability of the grid-connected VSC is analyzed by the modified equal area criterion. However, the conventional equal area criterion-based stability analysis is not applicable for PV generators connected to the DC distribution network.
The aforementioned research studies on transient stability analysis mainly focus on the AC distribution network which mainly draw lessons from the stability analysis of synchronous generators. Based on the power–angle relationships, the transient stability of PV generators connected to the AC distribution network can be analyzed effectively. Nevertheless, for the DC distribution network, there is no mature experience that can be referred to; hence, much fundamental research should be developed.
Wang et al. (2013) proposed a voltage hierarchical coordination control strategy. The operating state is switched in real time according to the DC bus voltage deviation value, which can maintain the system stability. However, it is difficult to give a good support if a sudden change occurs in DC bus voltage. Many scholars (Griffo and Jiabin Wang, 2012) (Jiang et al., 2019) constructed corresponding Lyapunov functions in order to analyze the convergence of the system trajectory and to determine the attraction domain of the system. Griffo and Jiabin Wang (2012) employed Brayton–Moser mixed potential functions to confirm the transient stability boundary of the whole system. Kabalan et al. (2017) reviewed the Lyapunov-based large-signal stability studies and proposed the direction for future research. In Jiang et al. (2019), an improved analysis method for transient response characteristics of the load converter is proposed, and a more precise stability criterion is obtained. However, the results of the Lyapunov direct method tend to be conservative, and there does not exist a widely accepted theory on how to construct Lyapunov functions. Compared with the full-fledged linear system analysis method, the information obtained from the Lyapunov function is very limited, which is not conducive to revealing the essential stability mechanism.
Focusing on the aforementioned challenges, this article proposes a new paradigm to analyze the transient stability of PV generators under large disturbances when they are connected to the DC distribution network. First, the large-signal model of a single-PV generator connected to the DC bus is established. Then, the transient stability of the PV generator during the DC bus voltage sag and recovery stages is analyzed using the proposed power–voltage evolution curve, which contrasts with the power–angle curve in the AC power system. The influence of corresponding control parameters is carefully studied, and the unstable mechanism is revealed. It is found that the PV side easily suffers undervoltage faults during the transient process, which will cause instability of the system. Next, the variable parameter control is proposed to enhance the transient stability based on the revealed unstable mechanism. The effectiveness of the proposed transient stability analysis and control methods is validated through related hardware-in-loop tests.
The remainder of this article is organized as follows: In Large-Signal Model of PV Generators Connected to DC Distribution Network section, the large-signal model of a single PV generator connected to the DC bus is established. Then, Transient Stability Analysis Based on the Power–Voltage Evolution Curve section analyzes the transient stability using the power–voltage evolution curve in detail. After that, the proposed variable parameter control method is introduced in Variable Parameter Control for the Transient Stability Enhancement section. The related real-time hardware-in-loop (HIL) tests are conducted in Hardware-in-loop Tests section. At last, Conclusion section concludes this article.
The topology of a PV generator connected to the DC distribution network is shown in Figure 1. The buck DC/DC converter is connected the PV generator and the DC distribution network. The capacitor on the PV side is

FIGURE 1. Topology and control of a PV generator connected to the DC distribution network.
There is a breaker between the PV generator and the DC distribution network. If serious faults occur, the breaker will be triggered and the PV generator will be disconnected, especially when the input voltage of the buck DC/DC converter is lower than its output voltage, that is,
Figure 1 also shows the control method, which is a typical multi-loop control strategy (Tafti et al., 2018). The whole control strategy can be divided into three parts, namely, the outermost loop, the middle loop, and the innermost loop. The outermost loop is a PV power control loop based on the perturbation and observation (P&O) method, which generates reference PV voltage
Usually, the bandwidth of the innermost current loop is 10 times larger than that of the outer loop, as shown in Figure 1. Therefore, the system dynamics during large disturbances are mainly dominated by the slow outer loops. To simplify the analysis, the current loop can be viewed as a unity gain (Wu and Wang, 2020), and the output inductor current
where
Furthermore, if the loss of the switch tubes and filters is ignored (Severino and Strunz, 2019), that is,
Then, the PV side model can be established as follows:
where
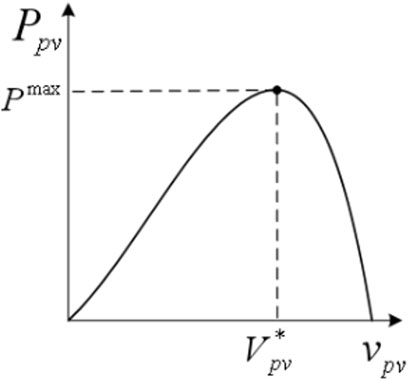
FIGURE 2. Output model of a PV generator.
Combining (1)–(3), the simplified large-signal model of the PV generator can be derived as shown in Figure 3. The PI controller of the PV voltage loop is equivalent to a parallel form consisting of a resistor and an inductor. The corresponding resistance and inductance are
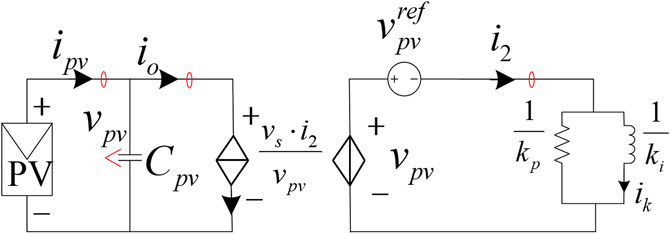
FIGURE 3. Equivalent topology when analyzing the transient stability.
In this section, the transient stability of the PV generator is analyzed when it suffers the DC bus voltage sag faults of the outer DC distribution network based on the established large-signal model in Large-Signal Model of PV Generators Connected to DC Distribution Network Section.
Figure 4 shows the typical DC bus voltage profile when sag faults occur. The voltage sag occurs at the time
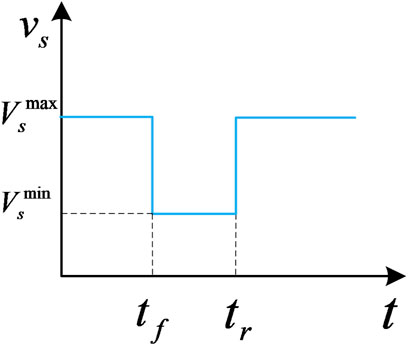
FIGURE 4. Variation process of DC source voltage.
For the traditional AC distribution network, it is required that PV generators output maximum reactive currents to support the AC bus voltage. Hence, the PV side voltage is not tightly related to the AC bus voltage. However, for the DC distribution network, only the active power is considered and PV generators should output maximum active currents to support the DC bus voltage, and the active power will influence the dynamics of the PV side voltage. Therefore, the PV side voltage is tightly related to the DC bus voltage, as shown in Figure 3. This is the nature difference between DC grid-connected PV generators and AC grid-connected PV generators.
When the DC bus voltage sag occurs, the original active power balance on both sides of the capacitor
From Eqs 2, 3, it can be seen that the output power
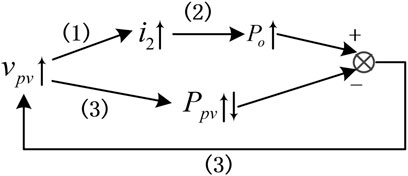
FIGURE 5. Logical relation diagram of changes about
In the analysis of this study, when the DC distribution network encounters a large disturbance, the transient evolution process can be divided into two stages, namely, the voltage sag stage and the voltage recovery stage of the DC bus. The whole system transient dynamics during the voltage sag and the recovery process using the power–voltage evolution curve are illustrated in Figure 6. The black curve describes the changing process of
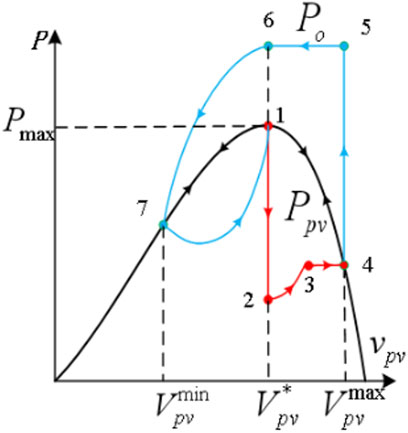
FIGURE 6. Power–voltage evolution curve of the PV generator and the DC distribution network during the transient voltage sag and the recovery process.
In the normal state, the PV panel tracks the maximum power point, that is, works at point 1 in Figure 6. In this state,
where
When the DC distribution network suddenly suffers large disturbances,
According to (1), when
On the other hand, an increase in
After the DC bus voltage sag lasts for a period of time, the fault is cleared and the DC bus voltage returns to normal. The voltage recovery stage can be subdivided into three substages. Concretely, substage Ⅰ:
In substage Ⅰ, the fault disappears and
During this period,
Since
In substage Ⅱ,
where
However, the system does not reach the steady state because the value of
Following the analysis of the transient dynamic process during and after voltage sag, the influence of parameters is analyzed in this section.
First, from the perspective of small-signal stability, the bandwidth of voltage loop and current loop should be matched with each other. If the control parameters
Furthermore, as mentioned in Large-Signal Model of PV Generators Connected to DC Distribution Network section, the buck DC/DC converter, which is a step-down converter, connects the PV generator and the DC distribution network. Hence, the input voltage
During the voltage recovery stage,
Rewriting (3) yields the following equation:
where
Considering substage Ⅱ of the voltage recovery phase mentioned earlier, taking the derivation on both sides of Eq. 5 and combining it with Eq. 2 yields the following equation:
Combining Eqs. 1–7 and Figure 6, it is found that parameters
Figure 7 shows the influences of different parameters. The blue curve represents the relationship between
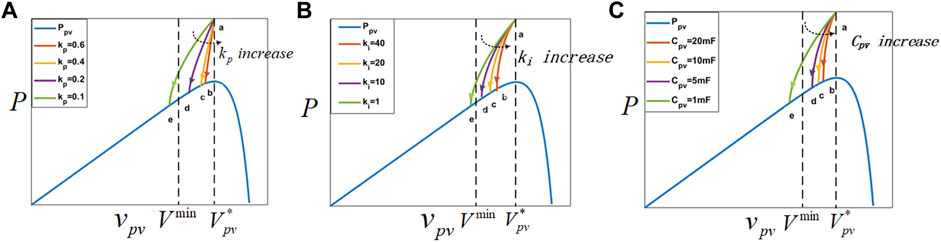
FIGURE 7.
From the perspective of the system stability, the input PV voltage
Substituting (6) and (7) yields the following equation:
Eq. 8 gives the slope of the
Proposition 1. During the dynamic process shown in Figure 6, the following equation holds:
Proof. During the dynamic process shown in Figure 7,
From the analysis presented in Transient Stability Analysis Based on the Power–Voltage Evolution Curve section, the system will lose its stability, and the tripping of circuit breaker may take place when
Figure 8A shows the proposed variable parameter control structure, and its switching logic is displayed in Figure 8B. Compared to the conventional control, as shown in Figure 1, only a switching logic mode is added. The subscripts 1 and 2 of the control parameters
In the voltage recovery stage, the DC bus voltage increases sharply from
where
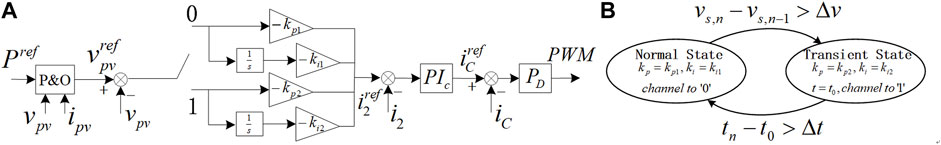
FIGURE 8. Proposed variable parameter control. (A) Control structure. (B) Switching logic mode.
After a period of time,
where
With the power–voltage evolution curve shown in Figure 6, the proposed variable parameter control method can increase the slope of the blue curve from point 6 to point 7 by increasing
In order to further evaluate the effectiveness of the proposed power–voltage evolution curve analysis and variable parameter control strategy, the corresponding (HIL) experimental tests are conducted using the RT-LAB and TMS320F28335 DSP. The experimental setup of HIL tests is shown in Figure 9. The PV generator circuit studied in the experiment, which is identical to that of Figure 1, is simulated in RT-LAB, and the control algorithm is realized using TMS320F28335 DSP.
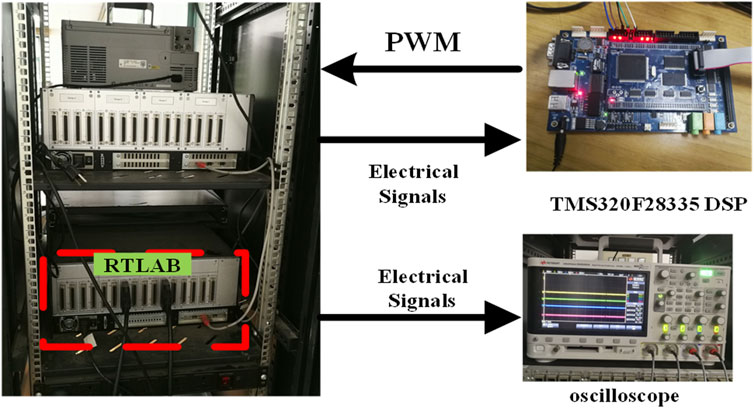
FIGURE 9. HIL tests setup.
The whole experiment has experienced four stages: normal stage → fault stage → recovery stage →normal stage. During the normal stage, the DC bus voltage is

TABLE 1. Parameters of the system and the PV generator.
In the following experiments, we test the influence of different parameters and the proposed variable parameter control strategy on the stability of the whole system. These results are shown in Figure 10. Figure 14 contains the voltage and power dynamic processes during the whole process. Fig. (a) of each graph shows the voltage dynamics of
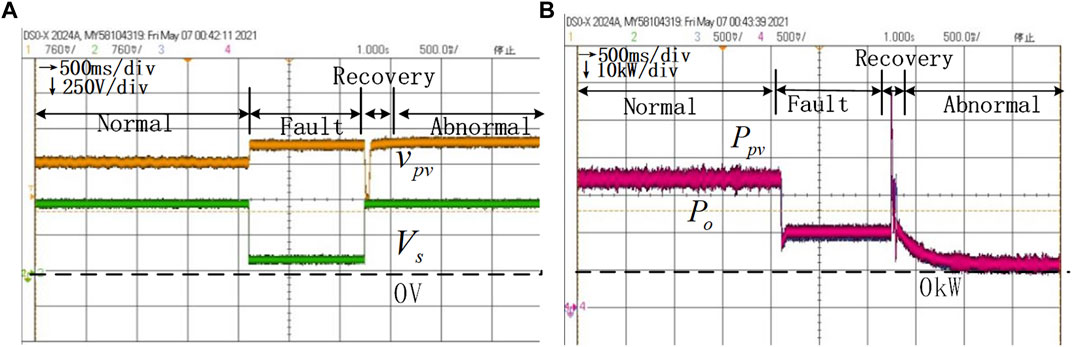
FIGURE 10. HIL results of voltage dynamics and power dynamics without the variable parameter control under the conditions of
Figure 10A and Figure 10B show the dynamic process with the initial parameters, that is,
Then, increasing the values of different parameters in turn with all other parameters being equal, that is,
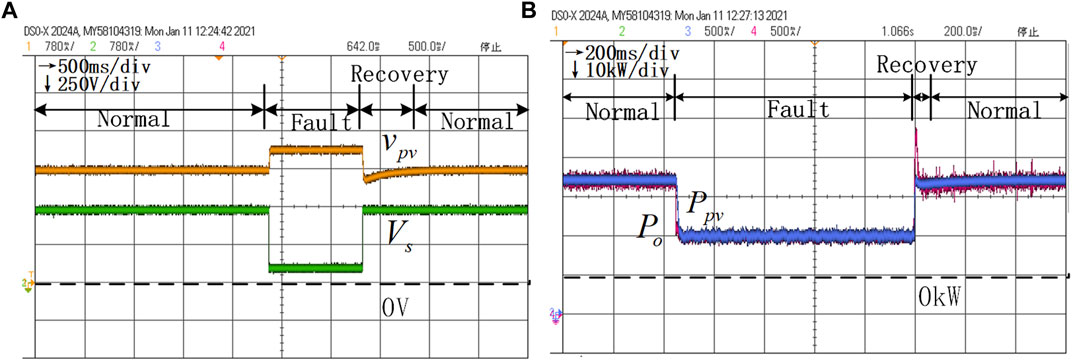
FIGURE 11. HIL results of voltage dynamics and power dynamics without the variable parameter control under the conditions
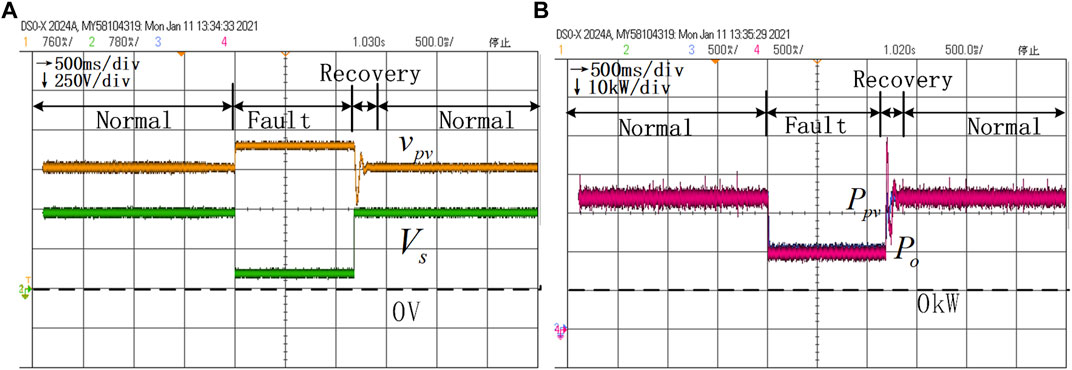
FIGURE 12. HIL results of voltage dynamics and power dynamics without the variable parameter control under the conditions
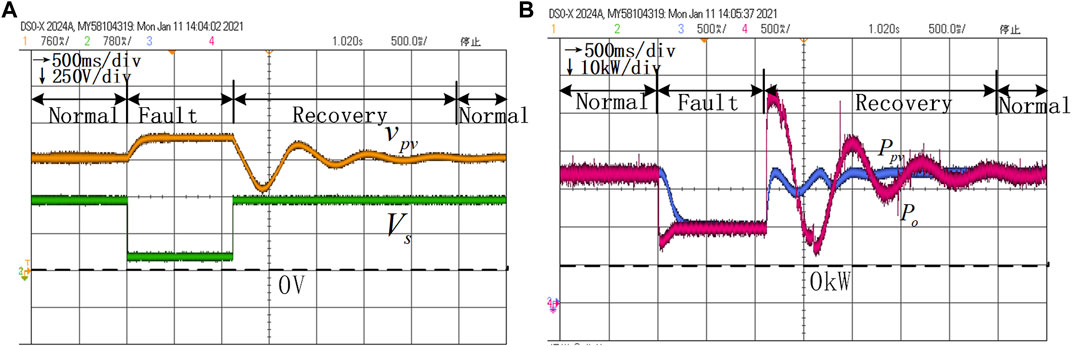
FIGURE 13. HIL results of voltage dynamics and power dynamics without the variable parameter control under the conditions
Figure 14 shows the voltage dynamics with the proposed variable parameter control under the circumstance of initial parameters, that is,
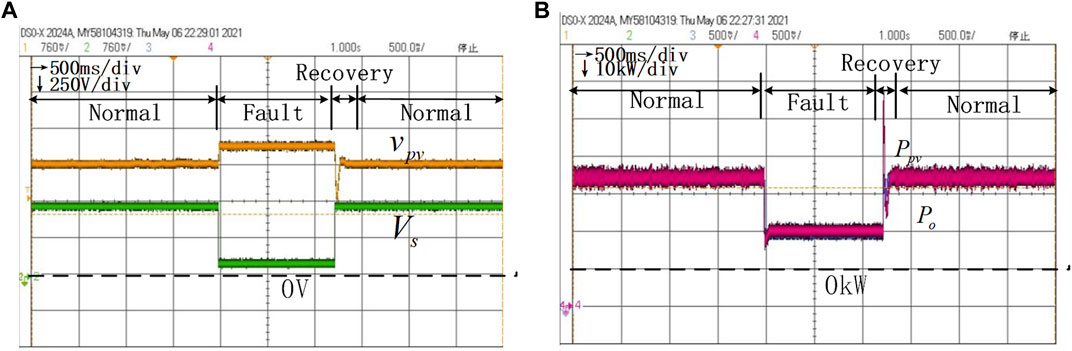
FIGURE 14. HIL results of voltage dynamics and power dynamics with the variable parameter control under the conditions
It should be noted that in this HIL test, the control parameters, that is,
This article has analyzed the transient stability of the distributed PV generator connected to the DC distribution network and proposed the variable parameter control method. First, the mathematic model is established when analyzing the transient stability. Then, the transient stability during the DC bus voltage sag and the recovery stage is analyzed using the power–voltage evolution curve. It is shown that the PV side easily suffers undervoltage faults during the transient process, and then the system will lose stability. Moreover, the influence of corresponding control parameters is carefully studied. Next, the variable parameter control is proposed according to the revealed unstable mechanism. Finally, all the findings have been confirmed by hardware-in-loop tests.
The raw data supporting the conclusions of this article will be made available by the authors, without undue reservation.
All authors listed have made a substantial, direct, and intellectual contribution to the work and approved it for publication. The writing of this article was mainly completed by HH, YX and WW provided ideas and guidance for the writing of this article, and PY mainly participated in the experiment.
This work is supported in part by the National Key R&D Program of China (2020YFB1506801), in part by the Science and Technology Project of the State Grid Corporation of China (52110421005H), in part by the National Natural Science Foundation of China (52007162), and in part by the Key R&D Program of Zhejiang Province (2022C01161).
The authors declare that the research was conducted in the absence of any commercial or financial relationships that could be construed as a potential conflict of interest.
All claims expressed in this article are solely those of the authors and do not necessarily represent those of their affiliated organizations, or those of the publisher, the editors, and the reviewers. Any product that may be evaluated in this article, or claim that may be made by its manufacturer, is not guaranteed or endorsed by the publisher.
Azeem, S. W., Chen, W., Tariq, I., Ye, H., and Kaija, D. (2020). A Hybrid Resonant ZVZCS Three-Level Converter Suitable for Photovoltaic Power DC Distribution System. IEEE Access 8, 114981–114990. doi:10.1109/access.2020.3002338
Bosco, N., Springer, M., and He, X. (2020). Viscoelastic Material Characterization and Modeling of Photovoltaic Module Packaging Materials for Direct Finite-Element Method Input. IEEE J. Photovoltaics 10 (5), 1424–1440. doi:10.1109/jphotov.2020.3005086
Cai, H., Xiang, J., and Wei, W. (2018). Decentralized Coordination Control of Multiple Photovoltaic Sources for DC Bus Voltage Regulating and Power Sharing. IEEE Trans. Ind. Electron. 65 (7), 5601–5610. doi:10.1109/tie.2017.2779412
Chaiyatham, T., and Ngamroo, I. (2017). Improvement of Power System Transient Stability by PV Farm with Fuzzy Gain Scheduling of PID Controller. IEEE Syst. J. 11 (3), 1684–1691. doi:10.1109/jsyst.2014.2347393
Chen, X., Pei, W., and Tang, X. (2010). “Transient Stability Analyses of Micro-grids with Multiple Distributed Generations,” in Proceedings of the 2010 Int. Conf. Power Syst. Technol., Hangzhou, Oct. 2010 (IEEE), 1–8. doi:10.1109/powercon.2010.5666120
Coelho, E. A. A., Cortizo, P. C., and Garcia, P. F. D. (1999). “Small Signal Stability for Single Phase Inverter Connected to Stiff AC System,” in Conference Record of the 1999 IEEE Industry Applications Conference. Thirty-Forth IAS Annual Meeting (Cat. No.99CH36370), Phoenix, AZ, USA, Oct. 1999 (Phoenix, AZ, USA: IEEE), 2180–2187. vol.4.
Dahal, S., Mithulananthan, N., and Saha, T. (2011). “An Approach to Control a Photovoltaic Generator to Damp-Frequency Oscillations in an Emerging Distribution System,” in Proceedings of the 2011 IEEE Power and Energy Society General Meeting, Detroit, MI, USA, July 2011 (IEEE), 1–8.
Davari, M., and Mohamed, Y. A.-R. I. (2017). Robust Vector Control of a Very Weak-Grid-Connected Voltage-Source Converter Considering the Phase-Locked Loop Dynamics. IEEE Trans. Power Electron. 32 (2), 977–994. doi:10.1109/tpel.2016.2546341
Eftekharnejad, S., Vittal, V., Heydt, G. T., Keel, B., and Loehr, J. (2013). Impact of Increased Penetration of Photovoltaic Generation on Power Systems. IEEE Trans. Power Syst. 28 (2), 893–901. doi:10.1109/tpwrs.2012.2216294
Eftekharnejad, S., Heydt, G. T., and Vittal, V. (2015). Optimal Generation Dispatch with High Penetration of Photovoltaic Generation. IEEE Trans. Sustain. Energ. 6 (3), 1013–1020. doi:10.1109/tste.2014.2327122
Farsi, M., and Liu, J. (2020). Nonlinear Optimal Feedback Control and Stability Analysis of Solar Photovoltaic Systems. IEEE Trans. Contr. Syst. Technol. 28 (6), 2104–2119. doi:10.1109/tcst.2019.2929149
Fathabadi, H. (2019). Improving the Power Efficiency of a PV Power Generation System Using a Proposed Electrochemical Heat Engine Embedded in the System. IEEE Trans. Power Electron. 34 (9), 8626–8633. doi:10.1109/tpel.2018.2883790
Fu, Q., Nasiri, A., Bhavaraju, V., Solanki, A., Abdallah, T., and Yu, D. C. (2014). Transition Management of Microgrids with High Penetration of Renewable Energy. IEEE Trans. Smart Grid 5 (2), 539–549. doi:10.1109/tsg.2013.2286952
Griffo, A., and Jiabin Wang, J. (2012). Large Signal Stability Analysis of 'More Electric' Aircraft Power Systems with Constant Power Loads. IEEE Trans. Aerosp. Electron. Syst. 48 (1), 477–489. doi:10.1109/taes.2012.6129649
He, J., Li, Y. W., Bosnjak, D., and Harris, B. (2013). Investigation and Active Damping of Multiple Resonances in a Parallel-Inverter-Based Microgrid. IEEE Trans. Power Electron. 28 (1), 234–246. doi:10.1109/tpel.2012.2195032
Hong, L., Shu, W., Wang, J., and Mian, R. (2019). Harmonic Resonance Investigation of a Multi-Inverter Grid-Connected System Using Resonance Modal Analysis. IEEE Trans. Power Deliv. 34 (1), 63–72. doi:10.1109/tpwrd.2018.2877966
Huang, Y., Yuan, X., Hu, J., and Zhou, P. (2015). Modeling of VSC Connected to Weak Grid for Stability Analysis of DC-Link Voltage Control. IEEE J. Emerg. Sel. Top. Power Electron. 3 (4), 1193–1204. doi:10.1109/jestpe.2015.2423494
Huang, L., Xin, H., Wang, Z., Zhang, L., Wu, K., and Hu, J. (2019). Transient Stability Analysis and Control Design of Droop-Controlled Voltage Source Converters Considering Current Limitation. IEEE Trans. Smart Grid 10 (1), 578–591. doi:10.1109/tsg.2017.2749259
Ishchenko, A., Myrzik, J. M. A., and Kling, W. L. (2006). “Transient Stability Analysis of Distribution Network with Dispersed Generation,” in Proceedings of the 41st International Universities Power Engineering Conference, Sept. 2006 (Newcastle-upon-Tyne: IEEE), 227–231. doi:10.1109/upec.2006.367749
Jiang, J., Liu, F., Pan, S., Zha, X., Liu, W., Chen, C., et al. (2019). A Conservatism-free Large Signal Stability Analysis Method for DC Microgrid Based on Mixed Potential Theory. IEEE Trans. Power Electron. 34 (11), 11342–11351. doi:10.1109/tpel.2019.2897643
Kabalan, M., Singh, P., and Niebur, D. (2017). Large Signal Lyapunov-Based Stability Studies in Microgrids: A Review. IEEE Trans. Smart Grid 8 (5), 2287–2295. doi:10.1109/tsg.2016.2521652
Kawabe, K., and Tanaka, K. (2015). Impact of Dynamic Behavior of Photovoltaic Power Generation Systems on Short-Term Voltage Stability. IEEE Trans. Power Syst. 30, 3416–3424. doi:10.1109/tpwrs.2015.2390649
Kouki, M., Marinescu, B., and Xavier, F. (2020). Exhaustive Modal Analysis of Large-Scale Interconnected Power Systems with High Power Electronics Penetration. IEEE Trans. Power Syst. 35, 2759–2768. doi:10.1109/tpwrs.2020.2969641
Lammert, G., Premm, D., Ospina, L. D. P., Boemer, J. C., Braun, M., and Van Cutsem, T. (2019). Control of Photovoltaic Systems for Enhanced Short-Term Voltage Stability and Recovery. IEEE Trans. Energ. Convers. 34 (1), 243–254. doi:10.1109/tec.2018.2875303
Li, H. H. (2013). “Dynamic Modeling of Photovoltaic Grid-Connected System,”. M.S. dissertation in School of Elec. Eng. (Chongqing, China: Chongqing University). (in Chinese).
Li, N. Y., Liang, J., and Zhao, Y. S. (2011). Research on Dynamic Modeling and Stability of Grid-Connected Photovoltaic Power Station. Proc. CSEE 31, 12–18. (in Chinese). doi:10.13334/j.0258-8013.pcsee.2011.10.005
Liu, D. R., Chen, S. R., Ma, M., Wang, H. H., Hou, J. X., and Ma, S. Y. (2011). A Review on Models for Photovoltaic Generation System. Power Syst. Tech. 35, 47–52. (in Chinese). doi:10.13335/j.1000-3673.pst.2011.08.017
Majumder, R. (2013). Some Aspects of Stability in Microgrids. IEEE Trans. Power Syst. 28 (3), 3243–3252. doi:10.1109/tpwrs.2012.2234146
Priyamvada, I. R. S., and Das, S. (2020). Transient Stability of Vdc - Q Control-Based PV Generator with Voltage Support Connected to Grid Modelled as Synchronous Machine. IEEE Access 8, 130354–130366. doi:10.1109/access.2020.3008942
Quan, X., Yu, R., Zhao, X., Lei, Y., Chen, T., Li, C., et al. (2020). Photovoltaic Synchronous Generator: Architecture and Control Strategy for a Grid-Forming PV Energy System. IEEE J. Emerg. Sel. Top. Power Electron. 8 (2), 936–948. doi:10.1109/jestpe.2019.2953178
Safayatullah, M., Rezaii, R., Elrais, M. T., and Batarseh, I. (2021). “Review of Control Methods in Grid-Connected PV and Energy Storage System,” in Proceeding of the 2021 IEEE Energy Conversion Congress and Exposition (ECCE), Vancouver, BC, Canada, Oct. 2021 (IEEE), 951–958.
Sangwongwanich, A., Yang, Y., and Blaabjerg, F. (2016). High-Performance Constant Power Generation in Grid-Connected PV Systems. IEEE Trans. Power Electron. 31 (3), 1822–1825. doi:10.1109/tpel.2015.2465151
Severino, B., and Strunz, K. (2019). Enhancing Transient Stability of DC Microgrid by Enlarging the Region of Attraction through Nonlinear Polynomial Droop Control. IEEE Trans. Circuits Syst. 66 (11), 4388–4401. doi:10.1109/tcsi.2019.2924169
Shadmand, M. B., Balog, R. S., and Abu-Rub, H. (2014). Model Predictive Control of PV Sources in a Smart DC Distribution System: Maximum Power Point Tracking and Droop Control. IEEE Trans. Energ. Convers. 29 (4), 913–921. doi:10.1109/tec.2014.2362934
Shah, R., Mithulananthan, N., Bansal, R. C., and Ramachandaramurthy, V. K. (2015). A Review of Key Power System Stability Challenges for Large-Scale PV Integration. Renew. Sustain. Energ. Rev. 41, 1423–1436. ISSN 1364-0321. doi:10.1016/j.rser.2014.09.027
Song, Q., Zhao, B., Liu, W., and Zeng, R. (2013). An Overview of Research on Smart DC Distribution Power Network. Proc. CSEE 33 (25), 9–19. doi:10.13334/j.0258-8013.pcsee.2013.25.009
Sun, J. (2011). Impedance-Based Stability Criterion for Grid-Connected Inverters. IEEE Trans. Power Electron. 26 (11), 3075–3078. doi:10.1109/tpel.2011.2136439
Tafti, H. D., Maswood, A. I., Konstantinou, G., Pou, J., and Blaabjerg, F. (2018). A General Constant Power Generation Algorithm for Photovoltaic Systems. IEEE Trans. Power Electron. 33 (5), 4088–4101. doi:10.1109/tpel.2017.2724544
Uprety, P., Wang, C., Koirala, P., Sapkota, D. R., Ghimire, K., Junda, M. M., et al. (2018). Optical Hall Effect of PV Device Materials. IEEE J. Photovoltaics 8 (6), 1793–1799. doi:10.1109/jphotov.2018.2869540
Villalva, M. G., Gazoli, J. R., and Filho, E. R. (2009). Comprehensive Approach to Modeling and Simulation of Photovoltaic Arrays. IEEE Trans. Power Electron. 24 (5), 1198–1208. doi:10.1109/tpel.2009.2013862
Wang, X., and Blaabjerg, F. (2019). Harmonic Stability in Power Electronic-Based Power Systems: Concept, Modeling, and Analysis. IEEE Trans. Smart Grid 10 (3), 2858–2870. doi:10.1109/tsg.2018.2812712
Wang, Y., Zhang, L., Li, H., and Liu, J. (2013). Hierarchical Coordinated Control of Wind Turbine-Based DC micro-Grid[J]. Proc. CSEE 33 (4), 16–24. doi:10.13334/j.0258-8013.pcsee.2013.04.001
Wang, X., Blaabjerg, F., and Wu, W. (2014). Modeling and Analysis of Harmonic Stability in an AC Power-Electronics-Based Power System. IEEE Trans. Power Electron. 29 (12), 6421–6432. doi:10.1109/tpel.2014.2306432
Wang, Y., Silva, V., and Lopez-Botet-Zulueta, M. (2016). Impact of High Penetration of Variable Renewable Generation on Frequency Dynamics in the continental Europe Interconnected System. IET Renew. Power Generation 10, 10–16. doi:10.1049/iet-rpg.2015.0141
Weckx, S., Gonzalez, C., and Driesen, J. (2014). Combined Central and Local Active and Reactive Power Control of PV Inverters. IEEE Trans. Sustain. Energ. 5 (3), 776–784. doi:10.1109/tste.2014.2300934
Wu, H., and Wang, X. (2020). Design-Oriented Transient Stability Analysis of PLL-Synchronized Voltage-Source Converters. IEEE Trans. Power Electron. 35 (4), 3573–3589. doi:10.1109/tpel.2019.2937942
Xia, Y., Yu, M., Wang, X., and Wei, W. (2019). Describing Function Method Based Power Oscillation Analysis of LCL-Filtered Single-Stage PV Generators Connected to Weak Grid. IEEE Trans. Power Electron. 34 (9), 8724–8738. doi:10.1109/tpel.2018.2887295
Xiao, Z., and Fang, H. (2010). “Impacts of Motor Load on the Transient Stability of the Microgrid,” in Proceedings of the 8th world congress on intelligent control automation, Jinan, China, July 2010 (IEEE), 2623–2627. doi:10.1109/wcica.2010.5554440
Yagami, M., and Tamura, J. (2012). “Impact of High-Penetration Photovoltaic on Synchronous Generator Stability,” in Proceeding of the 2012 XXth Int. Conf. Electrical Machines, Marseille, Sept. 2012 (IEEE), 2092–2097.
Zeng, Z., Yang, H., and Zhao, R. (2011). Study on Small Signal Stability of Microgrids: A Review and a New Approach. Renew. Sustain. Energ. Rev. 15 (Issue 9), 4818–4828. ISSN 1364-0321. doi:10.1016/j.rser.2011.07.069
Zhang, C., Cai, X., and Li, Z. (2017). Transient Stability Analysis of Wind Turbines with Full-Scale Voltage Source Converter. Proc. CSEE 37 (14), 4018–4026.
Zhao, D., Ge, L., Qian, M., Jiang, D., Qu, L., Han, H., et al. (2019). “Review on Modeling of Photovoltaic Power Generation Systems,” in Proceeding of the 2019 IEEE Innovative Smart Grid Technologies - Asia (ISGT Asia), Chengdu, China, May 2019 (IEEE), 1943–1946. doi:10.1109/isgt-asia.2019.8881254
Keywords: DC distribution network, photovoltaic generators, transient stability, variable parameter control, power–voltage evolution curve
Citation: He H, Xia Y, Wei W and Yang P (2022) Transient Stability Analysis and Control of Distributed Photovoltaic Generators in the DC Distribution Network. Front. Energy Res. 10:875654. doi: 10.3389/fenrg.2022.875654
Received: 14 February 2022; Accepted: 14 March 2022;
Published: 12 April 2022.
Edited by:
Ariya Sangwongwanich, Aalborg University, DenmarkReviewed by:
Rui Wang, Northeastern University, ChinaCopyright © 2022 He, Xia, Wei and Yang. This is an open-access article distributed under the terms of the Creative Commons Attribution License (CC BY). The use, distribution or reproduction in other forums is permitted, provided the original author(s) and the copyright owner(s) are credited and that the original publication in this journal is cited, in accordance with accepted academic practice. No use, distribution or reproduction is permitted which does not comply with these terms.
*Correspondence: Yanghong Xia, cm95eGlheWhAemp1LmVkdS5jbg==
Disclaimer: All claims expressed in this article are solely those of the authors and do not necessarily represent those of their affiliated organizations, or those of the publisher, the editors and the reviewers. Any product that may be evaluated in this article or claim that may be made by its manufacturer is not guaranteed or endorsed by the publisher.
Research integrity at Frontiers
Learn more about the work of our research integrity team to safeguard the quality of each article we publish.