 Xinwen Wang
 Xiaoqing Bai
 Puming Wang1,2
- 1School of Electrical Engineering, Guangxi University, Nanning, China
- 2Key Laboratory of Guangxi Electric Power System Optimization and Energy-Saving Technology, Guangxi University, Nanning, China
Traditional energy consumers gradually change to the new form of aggregation of prosumers (AOP) in the integrated energy microgrid (IEM) on the demand side. The emergence of the AOPs has led to the IEM’s structure changes, resulting in the emergence of two major stakeholders, the integrated energy microgrid service providers (IEMSPs) and the AOPs. The primary studies of this study are to configure the capacity for devices managed by IEMSP and AOPs with minimal costs. To achieve satisfaction for both IEMSP and AOPs, the approach of the non-cooperative game is used to allocate the capacity of devices managed by IEMSP and devices of AOPs. In detail, the IEMSP acts as a leader who determines the electricity pricing to minimize the cost, while the AOPs respond with electricity purchase or sales as the followers according to the price information provided by IEMSP. Moreover, electricity trading between AOPs is considered to reduce transmission losses and promote energy consumption nearby. To investigate the application of the multi-market mechanism in the optimal capacity allocation of IEM, a coupling mechanism of green certificate trading, carbon emission trading, and the electricity market is built in the proposed model. The cases are studied to verify the effectiveness of the proposed model in terms of saving the configuration capacity, reducing carbon emissions, and increasing the environmental benefits.
1 Introduction
A large amount of greenhouse gas emissions has created an enormous burden on the earth’s environment, and the power system has the most carbon emissions of all industrial systems (Chen et al., 2010). The integrated energy microgrid (IEM) provides a new way to realize energy conservation and emission reduction (Wang et al., 2019). There are substantial studies to solve challenges in the optimal capacity allocation of the IEM. Akram et al. (2018) proposed two constraint-based iterative search algorithms to size the devices in a wind/solar/battery grid-connected microgrid in an optimal way. Atia and Yamada (2016) presented a model based on mixed-integer linear programming to optimize an energy system with battery storage in its residential microgrids. Quashie et al. (2018) proposed bilevel planning of microgrids and optimized storage capacity under the management of a distribution system operator. Clairand et al. (2019) discussed the generation planning problem in diesel-based island microgrids with renewable energy sources. However, based on the abovementioned studies, the research on the capacity allocation of the IEM needs to pay attention to the introduction of emerging things in the IEM, such as prosumers which can not only consume but also produce energy (Parag and Sovacool, 2016).
Distributed energy sources in the IEM have the natural ability to act as prosumers because they are located on the demand side. Some studies have paid attention to the energy sharing and trading among adjacent prosumers. The interaction and optimization solution technology of the prosumer management system are introduced by Zafar et al. (2018). Chen et al. (2018) pointed out that the local energy sharing mode of the interaction between the prosumers in the distribution network has research value. Wang et al. (2020) proposed the P2P energy trading based on the urban community microgrid and considered the differentiated characteristics of prosumers so as to realize the coordination and complementarity of resources. Multiple prosumers can aggregate together to be the aggregation of prosumers (AOPs). In terms of the study of the AOP, Shafie-Khah et al. (2017) proposed an operational household energy management system to deal with the problem of operation of the production and consumer groups, and Liu et al. (2017) put forward the dispatch strategy of the prosumers to encourage users to participate in energy sharing by a lower price than the internal electricity price than the grid electricity price. A multi-microgrid hybrid energy sharing framework is presented for a heat-electricity IEM with combined heat and power by Liu et al. (2019). However, the abovementioned questions do not discuss the impact of the emergence of AOPs on the capacity allocation of the IEM.
At present, the most of existing traditional optimization models only focus on the benefits of the comprehensive IEM or the AOPs, lacking research on the optimization of the IEM considering AOPs. This study introduces the AOPs into the capacity allocation of IEM and considers the internal transactions between AOPs. The emergence of the AOPs has led to the IEM’s structure changes, resulting in the emergence of the game between the IEMSP and the AOPs. The energy trading process between the IEMSP and AOPs conforms to the game situation of the non-cooperative game, so the non-cooperative game is used to allocate the capacity of devices managed by IEMSP and devices of AOPs.
Game-theoretic methods have been widely applied in the interactions between prosumers (Teotia et al., 2020) and the interactions between power companies and consumers (Yu and Hong (2016) and Maharjan et al. (2013)). There has been some research on the non-cooperative game in the integrated energy system and demand response; for example, Yang et al. (2019) constructed a multi-investor dynamic decision-making game model for integrated energy system joint planning. Hu et al. (2020) established a non-cooperative game model with the power supplier as the main party and the electricity consumer as the slave party and formulated the optimal time-of-use price strategy with the goal of reducing the peak-to-valley difference. Demand response is described as a Stackelberg game in the energy pricing and dispatch problem for smart grid retailers by Wei et al. (2015). Pan et al. (2021) developed a multi-retail e-commerce retailer based on non-cooperative game package design and multi-level market power purchase strategy analysis.
In addition, with the proposal of carbon neutrality goals and the establishment of a new renewable portfolio standards policy in the document (National Energy Administration, 2021), it is urgent to study the flexible application of market mechanisms for carbon emission reduction of IEMs. An optimal planning model was proposed by Ge et al. (2021) for IEMs considering both distributed generators’ output uncertainties and carbon emission punishments. Lu et al. (2021) established a bilayer scheduling method for the community-integrated energy service system based on carbon trading. Helgesen and Tomasgard (2018) constructed a multi-regional comprehensive green certificate and electricity market model and analyzed the economic impact of tradable green certificates on promoting renewable energy power generation. Cai et al. (2020) put forward the implementation scheme of the green certificate trading platform and built the underlying network and application environment of blockchain. To sum up, the research on the multi-market mechanism has attracted the attention of the academic community, but there is a lack of research on how to apply it in the capacity allocation of the IEM.
To investigate the application of the multi-market mechanism in the optimal capacity allocation of IEM, the study proposes a coupling mechanism of green certificate trading, carbon emission trading, and the electricity market as an example to introduce the multi-market mechanism into the capacity allocation model. The contributions of this study mainly include the following:
1) AOPs are considered in the capacity allocation of IEM, which can save the configuration capacity of the device under the same load and avoid waste of energy in IEM.
2) The approach of the non-cooperative game is used to solve the optimal capacity allocation model for IEM considering AOPs, thus obtaining the optimal capacity allocation results of the capacity of devices managed by IEMSP and devices of AOPs in IEM.
3) The multi-market mechanism is built based on the coupling mechanism of green certificate trading, carbon emission trading, and the electricity market to stimulate renewable energy equipment and increase environmental benefits in the IEM in the study.
The rest of this study is organized as follows: Section 2 introduces the AOPs in IEM and presents a model for devices managed by IEMSP and devices of AOPs in IEM, respectively. Section 3 describes the modeling of the multi-market mechanism. Section 4 establishes the optimal capacity allocation method model for IEMSP and AOPs. The IEMSP-AOPs non-cooperative capacity allocation method is proposed in Section 5. In Section 6, the effectiveness of the proposed method is verified by cases. Conclusions are in Section 7. Section 8 deals with future work.
2 Integrated Energy Microgrid Considering Aggregation of Prosumers
2.1 Modeling of Aggregation of Prosumers
With the development and further promotion of distributed generation, small-scale energy users participate in energy market transactions as prosumers in an IEM. Multiple prosumers are aggregated together to form an AOP. Electricity transactions can be made between AOPs. Figure 1 shows the process of AOP transactions
where
where
where
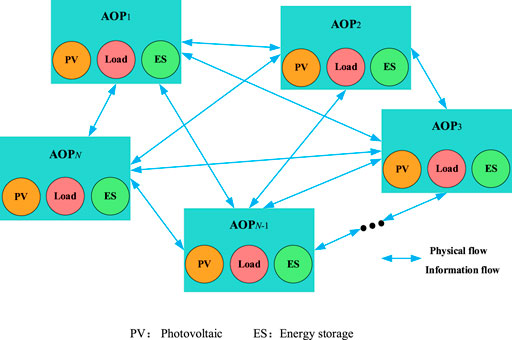
FIGURE 1. The frame of AOP transactions and modeling the devices in the AOP.
AOPs include inflexible load (IL) and translatable load (TL):
where
2.2 Integrated Energy Microgrid Architecture Considering Aggregation of Prosumers
Figure 2 shows a typical schematic diagram of an IEM structure considering AOPs.
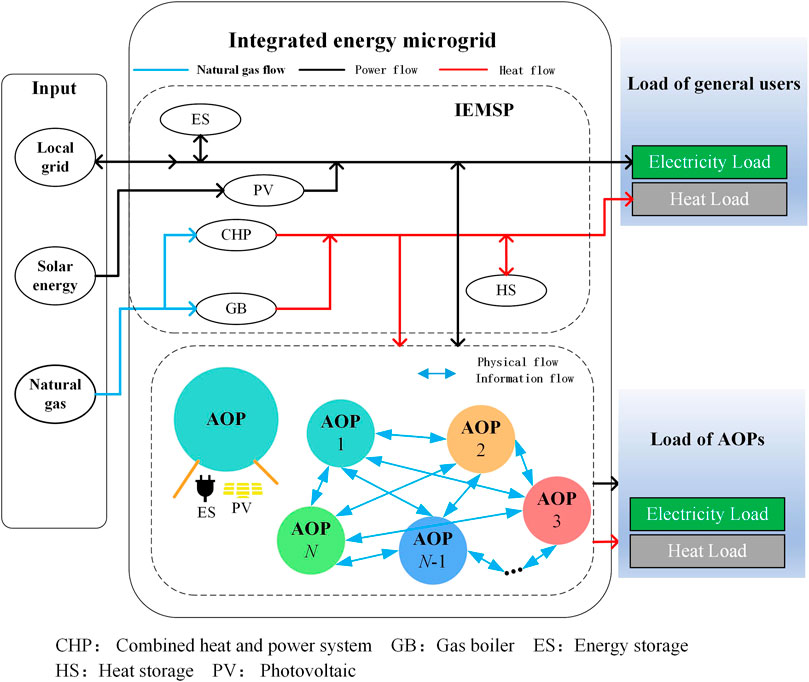
FIGURE 2. IEM architecture considering AOPs.
The components involved in Figure 2 are IEMSP, AOPs, general users, and so on. IEMSPs purchase electricity/natural gas from the superior electricity/gas network, cooperate with their own energy supply (PV, CHP, GB) and energy storage equipment (ES, HS), and supply energy to various users and obtain benefits in this way. AOPs install energy supply (PV) and energy storage equipment (ES) according to their conditions and purchase heat from IEMSP. General users purchase electricity and heat from IEMSP according to their electric and heating load needs.
2.3 Modeling of devices managed by IEMSP
1 Combined heat and power system model
CHP uses gas as fuel and high-quality thermal energy to drive gas turbines for power generation. The thermal energy and electric energy of CHP are obtained by consuming natural gas, and the mathematical model is
where
2 Photovoltaic Model
Based on data of a typical day, the actual power consumed by the PV at time t cannot exceed the maximum predicted output at that time
where
3 Gas Boiler Model
As systematic heat-generating equipment, GB can convert the chemical energy generated by natural gas combustion into high-grade heat energy, and its mathematical relationship is
where
4 Electric Boiler Model
The thermal output and electric consumption of EB are constrained as follows:
where
5 Energy Storage Device Model
There are two types of energy storage devices in the microgrid structure in this study, namely, the electricity storage unit (ES) and the heat storage unit (HS).
1 Electricity Storage Unit Model
Since the state of battery charge is related to the state of charge at the last moment and the power of the device, its mathematical model is described as follows:
where
2 Heat Storage Unit Model
Similarly, the current heat storage capacity of the heat storage device is related to the previous heat storage state and the charging and discharging heat of the device. The mathematical model is described as follows:
where
3 Modeling of the Multi-Market Mechanism
The flexible application of market mechanisms has become an essential means to break through the bottleneck of new energy development in China, and the IEM can not only participate in green electricity trading, carbon emission trading, and green certificate trading but also use the electricity market mechanism and other multi-market mechanisms to promote renewable energy consumption and reduce carbon emissions. The study considers three of these market mechanisms: the green certificate transactions among AOPs, the linear ladder carbon trading (LLCT) considered in the IEMSP, and the electricity market, which are described below.
3.1 Green Certificate Transactions Considered in the Aggregation of Prosumers
3.1.1 Green Certificate Transactions
It is assumed that the AOPs can participate in green certificate transactions. Some researchers used green certificate cross-chain transactions according to the number of green certificates obtained by the AOPs (Luo et al., 2021), and cross-chain transactions will be carried out on three blockchains of AOPs, green certificate transactions, and renewable energy.
The three blockchains constitute a chain group, which belongs to the category of alliance chains. Blockchains are only open to members participating in the green certificate trading market and provide a guarantee for the information security of participants. Smart contracts are contracted programs composed of Turing complete program codes, and chain code technology is a further development of smart contracts. As shown in Figure 3, new energy generators, AOPs, green certificate transaction platforms, and administrative supervision departments operate jointly through the blockchain green certificate transaction chain code.
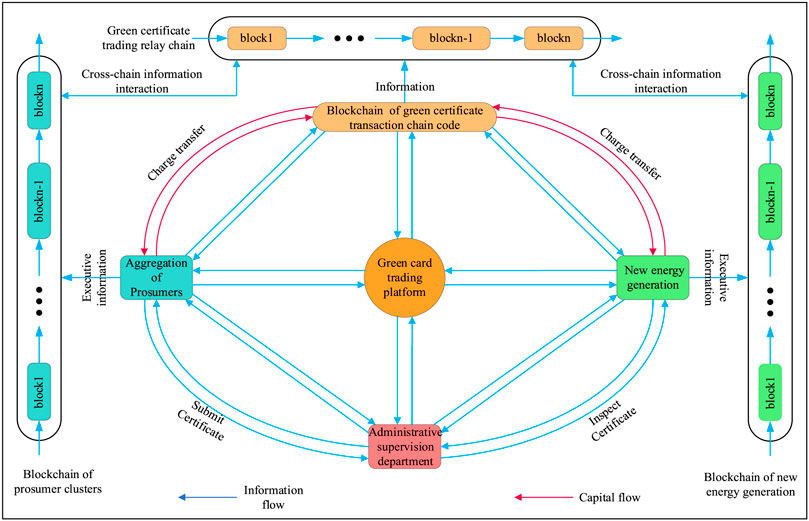
FIGURE 3. Green certificate transaction framework.
First of all, a unified green certificate trading market should be established, in which the number of green certificates is shown in Eq. 13:
where
The green certificate transaction model is shown in Eq. 14. According to the comparison of realistic renewable energy power generation and the prescribed quota, the model is as follows:
where
Green certificate quota constraints:
where
3.2 The Linear Ladder Carbon Trading Considered in the IEMSP Capacity Allocation
The initial assignation of carbon emission rights in the IEMSP mainly includes gas boilers and CHP. A ladder carbon price can increase the carbon trading cost of large emission units, and the ladder carbon price model in this study is as follows:
where
where
When the carbon emission is less than the free allocation of carbon emissions, the energy supply company can sell excess carbon emission quotas in the carbon trading market. The lower the carbon emission, the higher the carbon trading price; when the carbon emission is greater than the carbon emission amount allocated for free, the energy supply company needs to purchase carbon emission rights in the carbon trading market. The total cost of carbon trading is a linear function and the linear function of the total carbon transaction cost
where
3.3 Grid Time-Of-Use Tariff Model
Time-of-use (TOU) refers to the power grid encouraging users to arrange the electricity time reasonably. Different electricity prices are formulated for each time period according to the load change
where
3.4 IEMSP Electricity Price Model
where
4 Optimal Capacity Allocation Model for Integrated Energy Microgrid Considering Aggregation of Prosumers
4.1 Optimal Capacity Allocation Model of IEMSP
The optimization objective of the IEMSP capacity allocation model proposed in the study is to minimize the net present value of the total cost within the capacity allocation period, in which the total cost includes investment costs, operation costs, maintenance costs, equipment residual value, and carbon transaction costs. The carbon transaction costs are from the linear ladder carbon trading (LLCT) considered in the IEMSP capacity allocation as shown in Section 3.2
where
The average age method is used to calculate the depreciation of equipment in the study. Suppose that the life of the ith device is
where n indicates the nth typical daily operation scenario;
4.2 IEMSP Operation Constraints
1 Electric Power Balance Constraint
where
2 Thermal Power Balance Constraint
where
3 Natural Gas Bus Constraint
where
4 The Upper Output Limit of the Equipment and Investment Capacity Constraints Are Shown in the Following Equation
where
5 The Power Constraint of the Contact Line Between the Grid and the IEMSP Is as Follows
where
4.3 Aggregation of Prosumer Capacity Configuration Model
where
4.4 Aggregation of Prosumer Trading Constraints
1 Power Balance
where
2 Tie Line Power Constraints
Tie line power constraints are introduced in the following formula:
where
5 IEMSP-AOPs Non-Cooperative Capacity Allocation Method
IEMSPs purchase electricity/natural gas from the superior electricity/gas network, cooperate with their own equipment, supply energy to various users, and obtain benefits in this way. According to the abovementioned description, the optimization of IEMSP and AOPs is based on the quoted price of IEMSP, and their optimization results will react to the IEMSP quotation. This energy trading process conforms to the game situation of the non-cooperative game, so the non-cooperative game theory is used to solve the problem of considering both AOP profits and IEMSP profits in the study. The game is performed frequently in each iteration.
Algorithm 1. IEMSP-AOPs non-cooperative capacity allocation algorithm1. Initialize all relevant parameters of the IEM. IEMSP receives grid electricity prices, gas prices, load information, and PV information.2. IEMSP sends
The optimization capacity allocation model is implemented in MATLAB R2019b. For AOPs, the calculation of strategies and cost is solved by GUROBI, and the nonlinear programming problems need to be solved as shown in Eq. 38:
6 Simulation and Results
6.1 Simulation Settings
Simulation data come from a certain northern electric, gas, and thermal coupling IEM (Cao et al., 2020) to study the optimal capacity allocation model for IEM considering AOPs. The load curve of IEM is shown in Figure 4. The capacity allocation period is 8 years, and seven candidate devices can be selected for IEMSP, which are shown in the Supplementary Appendix. This study only discusses the purchase and sale prices of electricity; the heat demand of the AOP is provided by IEMSP, the heat sale price of IEMSP is still $0.07/kWh, and the grid electricity price is shown in the Supplementary Appendix. The fixed price for natural gas is $0.39/m3, the low calorific value of gas is 9.7 kW h/m3, and the converted natural gas grid is $0.04/kWh. The coefficient of the present value is 8%. The carbon trading cost is settled at the end of each year. The carbon emission of GB and CHP units is 0.065 t/GJ (Qu et al., 2018), the carbon transaction price is $38/t, and the incentive coefficient and carbon price increment are 0.2; the carbon quota increment
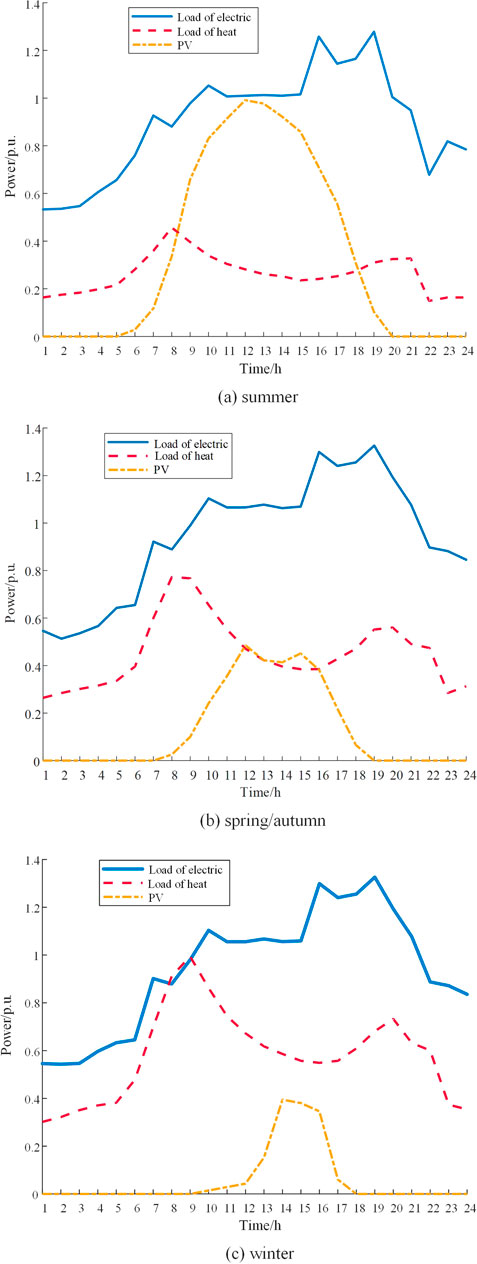
FIGURE 4. Load curve.
To demonstrate the superiority of the proposed capacity allocation method for IEM considering AOPs under the multi-market mechanism in the study, four cases are compared in Section 6.2.
Case 1: Traditional capacity allocation for IEM without considering AOPs or the green certificate and carbon trading.
Case 2: Capacity allocation for IEM considering green certificate and carbon trading, but electricity trading between AOPs is not considered.
Case 3: Capacity allocation for IEM considering electricity trading between AOPs, but without considering green certificate and carbon trading.
Case 4: Capacity allocation for IEM considering trading between AOPs and the green certificate and carbon trading using the proposed model.
Among the cases, case 1 is the base case in which neither AOPs nor green certificates and carbon trading are considered. AOPs in the IEM are considered in the other three cases; the electricity and heat load demand of the AOPs account for 15% of the total load, and the general user load demand accounts for 85% of the total load in cases 2–4. Case 4 uses the proposed model in this study.
6.2 Optimal Result Analysis
Tables 1, 2 show the optimal allocation results and costs for four cases. First of all, it can be seen from Tables 1, 2 that the overall configuration capacity of IEM and carbon emissions in case 1 is the most, and these in case 4 are the least under the same load; the comprehensive costs for capacity allocation in case 1 are the highest and that in case 4 is the lowest, proving the superiority of the proposed model in case 4. Next, the impact of trading between AOPs on the capacity allocation of IEM considering AOPs is analyzed by comparing case 2 and case 4, and the impact of green certificate and carbon trading on the capacity allocation of IEM considering AOPs is analyzed by comparing case 3 and case 4.
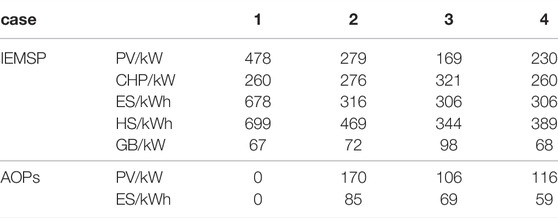
TABLE 1. Capacity allocation result of four cases.
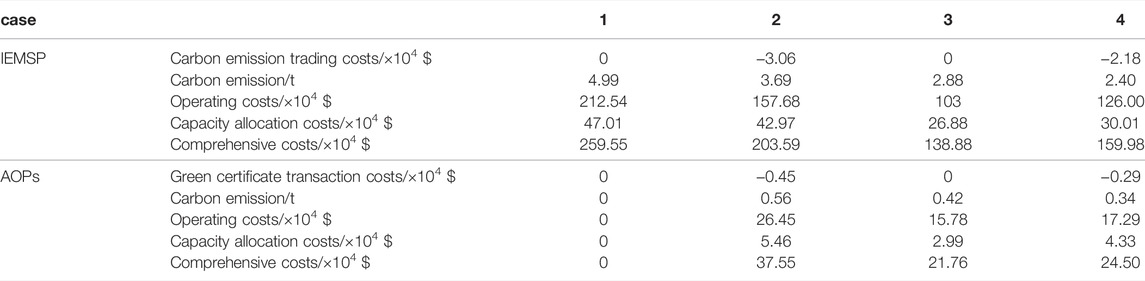
TABLE 2. Cost of four cases.
6.2.1 Comparative Analysis of IEM Capacity Allocation Considering Trading Between Aggregation of Prosumers or Not
This section compares case 2 with case 4.
1 Optimization game results of the purchase and sell prices
Based on the proposed method, when the AOP and the IEMSP reach game equilibrium, the final electricity price adjustment coefficient (PAC) is 0.895, the purchase PAC is 0.10 in case 4, the sale PAC in case 2 is 0.893, and the purchase PAC is 0.09. By formula (20), we can obtain the corresponding IEMSP electricity sell and purchase prices as shown in Figure 5.
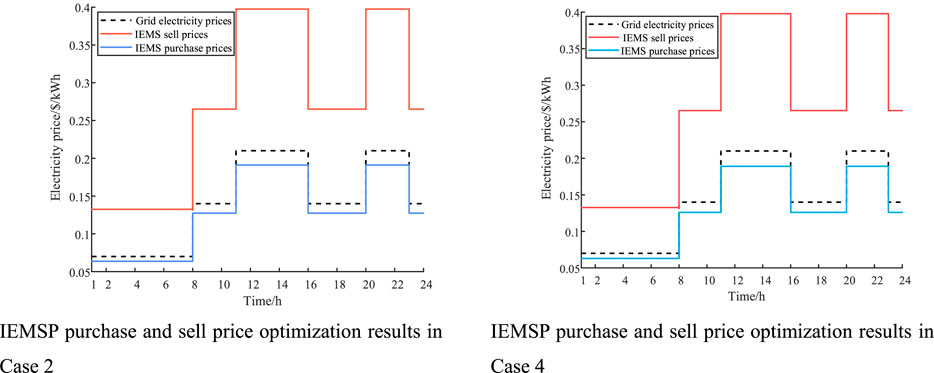
FIGURE 5. IEMSP purchase and sell price optimization results in case 2 and case 4.
IEMSP purchase and sell price optimization results in case 2 and IEMSP purchase and sell price optimization results in case 4 are provided.
2 Equipment Selection and Capacity Configuration Results
Comparing case 2 and case 4 in Table 1, we can obtain that when the electricity trading between AOPs is not considered, both the capacity configurations of AOPs and IEMSP have increased significantly. For example, the PV capacity configuration has increased from 230 kW to 279 kW in IEMSP, and AOP’s PV capacity configuration increases from 116 to 170 kW. To conserve the equipment configuration capacity, the electricity trading between AOPs should be considered on the AOP-involved optimal capacity allocation method for IEM.
3 Economic Results
Comparing case 2 and case 4 from Table 2, when the electricity trading between AOPs is not considered, both comprehensive costs of AOP and IEMSP have increased, IEMSP’s comprehensive costs have increased by 26.9%, and AOPs’ comprehensive costs have increased by 53.2%, which illustrates that the consideration of the electricity trading between AOPs will save a lot of costs and improve the economy of the capacity configuration.
6.2.2 Analysis of the Impact of the Green Certificate and Carbon Trading
This section compares case 3 with case 4.
1) Equipment Selection and Capacity Configuration Results
Case 3 did not consider green certificates and carbon trading compared with case4; comparing case 3 and case 4 in Table 1, it can be seen that for IEMSP, the PV configuration capacity decreases from 230 kW in case 4 to 169 kW in case 3, and the CHP configuration capacity increases from 260 kW in case 4 to 321 kW in case 3. For AOPs, the PV configuration capacity decreases from 116 to 106 kW. Due to the high cost and small carbon emissions of PV units compared to CHP units, the green certificates and the carbon trading model used in case1 select the PV configuration with small carbon emissions, which demonstrates that the participation of the multi-market mechanism proposed in this study improves the enthusiasm of green equipment and reducing carbon emissions.
2) Economic Results
Comparing case 3 and case 4 from Table 2, we can first get that the carbon emission trading costs and green certificate transaction costs are zero when carbon emission trading and green certificate transactions are not considered. Second, both costs of IEMSP and AOP decrease in case 3, and IEMSP’s comprehensive costs decrease by 13.2%; AOP’s comprehensive costs decrease by 11.2% due to the fact that the system tends to choose devices with small costs but large carbon emissions when not considering market mechanisms. However, both carbon emissions of IEMSP and AOP decrease in case 4 compared to case 3, IEMSP’s carbon emission decreases by 16.7%, and AOP’s carbon emission decreases by 20%.
6.3 Comparative Analysis of Different Penetrations of Aggregation of Prosumers in the Integrated Energy Microgrid
Penetration of AOPs refers to the proportion of AOPs that exist in IEM. The penetration rate of case 4 is 15%. In this section, the penetration rate is increased to 50 and 85% on the basis of case 4 for comparison. The corresponding IEMSP electricity sell and purchase prices are shown in Figure 6. With the change of penetration of AOPs in IEM, the optimization results of the purchase and sale price game and capacity configuration results are also changing.
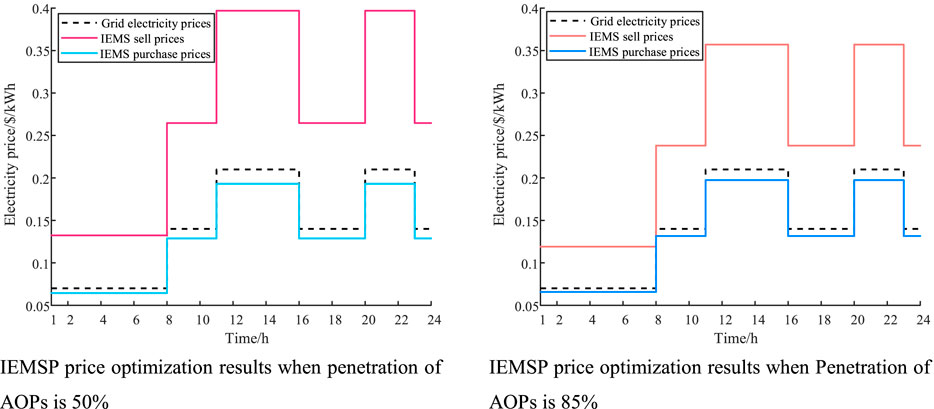
FIGURE 6. IEMSP purchase and sell price optimization results of different penetrations of AOPs.
1) Optimization Game Results of the Purchase and Sell Prices
The selling PAC is 0.895 and the purchase PAC is 0.10 in case 4 when the penetration of AOPs is 15%. When the penetration is 50%, the selling PAC is 0.89 and the purchase PAC is 0.08. When the penetration is 85%, the selling PAC is 0.7 and the purchase PAC is 0.06. With the increase in penetration of AOPs, the IEMSP purchase prices gradually increase, gradually approaching the grid price. Increased penetration of the AOP makes it more advantageous for them to fight for their interests in the price game, while the sell prices of IEMSP are slightly lowered.
2) Capacity Configuration Results
As shown in Table 3, with the increase of penetration of AOPs, the capacity configuration of AOPs has gradually increased and the capacity configuration of IEMSP has gradually decreased. From the perspective of the overall IEM, the overall capacity allocation is greatly reduced with the increase of penetration of AOPs under the same load of the overall IEM, which demonstrates that the increase of penetration of AOPs can effectively reduce the allocation of capacity in the IEM and save resources, which also proves that it is necessary to take the behavior of AOPs in the configuration of IEM into account.
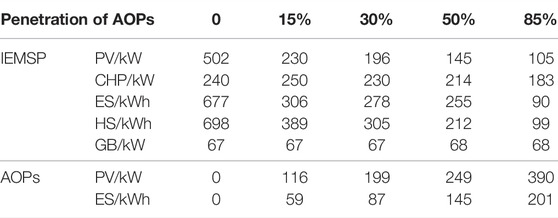
TABLE 3. Capacity allocation results of different penetrations of AOPs.
6.4 Impact of Carbon Trading Price on Operation Costs of IEMSP
From Figure 7, we can see that the carbon trading price has little impact on the operation cost under the low price. When the carbon trading price rises to $35, the IEMSP operation cost increases obviously and the carbon trading cost decreases significantly. With the continuous growth of carbon trading prices, the system can profit through carbon trading. The photovoltaic device reaches the upper limit when the carbon trading price reaches $45/T. As the carbon trading price rises, the carbon emission of the system will not change significantly, and the operation state of the system tends to be stable. The analysis shows that the carbon trading price fluctuation impacts the system operation cost and carbon trading cost. Reasonable carbon prices are beneficial for the capacity allocation of IEMSP.
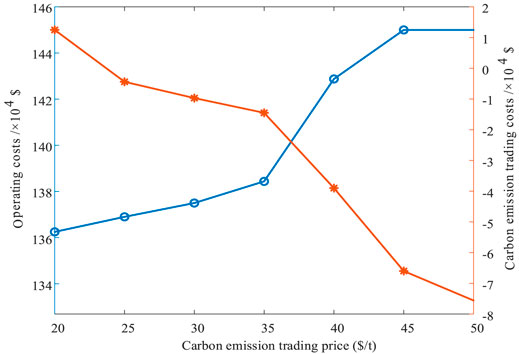
FIGURE 7. Operating costs and carbon emission trading costs of IEMSP under different carbon emission trading prices.
6.5 Analysis of Earnings of Aggregation of Prosumers Under Different Green Certificate Prices
The price of the green certificate is adjusted from $6 to $12 and the change in the income of the green certificate of the AOPs is observed as shown in Figure 8.
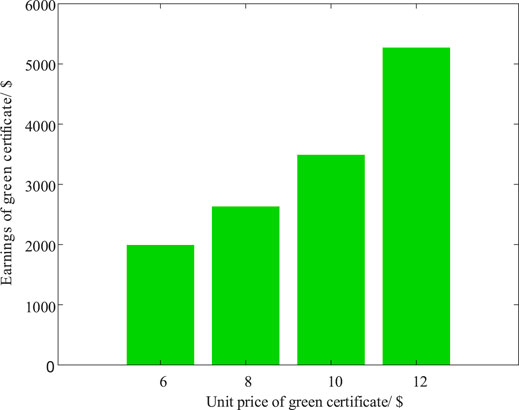
FIGURE 8. Earnings under different green certificate prices.
It is assumed that the AOPs can participate in green certificate transactions and green certificate cross-chain transactions according to the number of green certificates obtained by the AOPs to get a green income. It can be found from Figure 8 that the higher the unit price of the green certificate, the more the earnings obtained through cross-chain transactions.
7 Conclusion
To configure capacity for devices managed by IEMSP and devices of AOPs in IEM with minimal costs, an IEMSP capacity configuration cost model considering LLCT and an AOP capacity configuration cost model considering green cross-chain transactions are established. Electricity trading between AOPs is considered to reduce transmission losses and promote energy consumption nearby. The IEMSP-AOPs non-cooperative capacity allocation algorithm is used to consider electricity price trading between IEMSP and AOPs.
When trading between AOPs is considered under the 15% penetration of AOPs in the IEM, IEMSP’s comprehensive costs have decreased by 26.9% and AOPs’ comprehensive costs have reduced by 53.2%, which illustrates that the consideration of the electricity trading between AOPs will save a lot of costs and improve the economy of the capacity configuration under the same load; participation of the multi-market mechanism improves the enthusiasm of green equipment and reduces carbon emissions. When the multi-market mechanism is considered under the 15% penetration of AOPs, both the carbon emission of IEMSP and AOP decrease, IEMSP’s carbon emission decreases by 16.7% and AOP’s carbon emission decreases by 20%. In addition, simulation results demonstrate that the increase of the penetration of AOPs enables the allocation capacity of devices in IEM to decrease under the same load.
8 Future Work
The heating and gas network constraints will be considered in the next research work; subsequent research will consider enhancing the originality and complexity of device modeling of IEM considering AOPs; this study uses the particle swarm algorithm to solve the proposed game model, which may cause the solution results to fall into local optimum. How to make the solution the result of the game model faster and more accurate will be further studied in the future.
Data Availability Statement
The original contributions presented in the study are included in the article/Supplementary Material, further inquiries can be directed to the corresponding author.
Author Contributions
1. AOPs are considered in the capacity allocation of IEM, which can save the configuration capacity of the device under the same load and avoid waste of energy in IEM. 2. The approach of the non-cooperative game is used to solve the optimal capacity allocation model for IEM considering AOPs, thus obtaining the optimal capacity allocation results of the capacity of devices managed by IEMSP and devices of AOPs in IEM. 3. The multi-market mechanism is built based on the coupling mechanism of green certificate trading, carbon emission trading, and the electricity market to stimulate renewable energy equipment and increase environmental benefits in the IEM in the study.
Conflict of Interest
The authors declare that the research was conducted in the absence of any commercial or financial relationships that could be construed as a potential conflict of interest.
Publisher’s Note
All claims expressed in this article are solely those of the authors and do not necessarily represent those of their affiliated organizations or those of the publisher, the editors, and the reviewers. Any product that may be evaluated in this article or claim that may be made by its manufacturer is not guaranteed or endorsed by the publisher.
Supplementary Material
The Supplementary Material for this article can be found online at: https://www.frontiersin.org/articles/10.3389/fenrg.2022.875499/full#supplementary-material
References
Akram, U., Khalid, M., and Shafiq, S. (2018). Optimal Sizing of a Wind/solar/battery Hybrid Grid‐connected Microgrid System. IET Renew. Power Generation 12, 72–80. doi:10.1049/iet-rpg.2017.0010
Atia, R., and Yamada, N. (2016). Sizing and Analysis of Renewable Energy and Battery Systems in Residential Microgrids. IEEE Trans. Smart Grid 7, 1204–1213. doi:10.1109/TSG.2016.2519541
Cai, Y., Gu, Y., Luo, G., Zhang, X., and Chen, Q. (2020). Blockchain Based Trading Platform of Green Power Certificate: Concept and Practice. Dianli Xitong Zidonghua/automation Electr. Power Syst. 44, 1–9. doi:10.7500/AEPS20200222003
Cao, Y., Mu, Y., Jia, H., Yu, X., Song, Y., and Wu, K. (2020). Multi-stage Planning of Park-Level Integrated Energy System Considering Construction Time Sequence. Zhongguo Dianji Gongcheng Xuebao/proceedings Chin. Soc. Electr. Eng. 40, 6815–6827. doi:10.13334/j.0258-8013.pcsee.200622
Chen, Q., Kang, C., Xia, Q., and Zhong, J. (2010). Power Generation Expansion Planning Model towards Low-Carbon Economy and its Application in china. IEEE Trans. Power Syst. 25, 1117–1125. doi:10.1109/TPWRS.2009.2036925
Chen, Q., Wang, K., Chen, S., and Xia, Q. (2018). Transactive Energy System for Distributed Agents: Architecture, Mechanism Design and Key Technologies. Dianli Xitong Zidonghua/automation Electr. Power Syst. 42, 1–7+31. doi:10.7500/AEPS20171031002
Clairand, J.-M., Arriaga, M., Canizares, C. A., and Alvarez-Bel, C. (2019). Power Generation Planning of Galapagos' Microgrid Considering Electric Vehicles and Induction Stoves. IEEE Trans. Sustain. Energ. 10, 1916–1926. doi:10.1109/TSTE.2018.2876059
Ge, L., Liu, H., Yan, J., Zhu, X., Zhang, S., and Li, Y. (2021). Optimal Integrated Energy System Planning with DG Uncertainty Affine Model and Carbon Emissions Charges. IEEE Trans. Sustain. Energ. 3029, 1. doi:10.1109/tste.2021.3139109
Helgesen, P. I., and Tomasgard, A. (2018). An Equilibrium Market Power Model for Power Markets and Tradable green Certificates, Including Kirchhoff's Laws and Nash-Cournot Competition. Energ. Econ. 70, 270–288. doi:10.1016/j.eneco.2018.01.013
Hu, P., Ai, X., Zhang, S., and Pan, X. (2020). Modelling and Simulation Study of TOU Stackelberg Game Based on Demand Response. Dianwang Jishu/power Syst. Technol. 44, 585–592. doi:10.13335/j.1000-3673.pst.2019.0387
Li, H., Liu, D., and Yao, D. (2021). Analysis and Reflection on the Development of Power System towards the Goal of Carbon Emission Peak and Carbon Neutrality. Zhongguo Dianji Gongcheng Xuebao/proceedings Chin. Soc. Electr. Eng. 41, 6245–6258. doi:10.13334/j.0258-8013.pcsee.210050
Liu, N., Wang, J., and Wang, L. (2019). Hybrid Energy Sharing for Multiple Microgrids in an Integrated Heat-Electricity Energy System. IEEE Trans. Sustain. Energ. 10, 1139–1151. doi:10.1109/TSTE.2018.2861986
Liu, N., Yu, X., Wang, C., Li, C., Ma, L., and Lei, J. (2017). Energy-Sharing Model with Price-Based Demand Response for Microgrids of Peer-To-Peer Prosumers. IEEE Trans. Power Syst. 32, 3569–3583. doi:10.1109/TPWRS.2017.2649558
Lu, Q., Guo, Q., and Zeng, W. (2021). Optimization Scheduling of an Integrated Energy Service System in Community under the Carbon Trading Mechanism: A Model with Reward-Penalty and User Satisfaction. J. Clean. Prod. 323, 129171. doi:10.1016/j.jclepro.2021.129171
Luo, Z., Qin, J., Liang, J., Zhao, M., Wang, H., and Liu, K. (2021). Operation Optimization of Integrated Energy System with Green Certificate Cross-Chain Transaction. Dianwang Jishu/power Syst. Technol. 45, 1311–1319. doi:10.13335/j.1000-3673.pst.2020.1940
Maharjan, S., Zhu, Q., Zhang, Y., Gjessing, S., and Basar, T. (2013). Dependable Demand Response Management in the Smart Grid: A Stackelberg Game Approach. IEEE Trans. Smart Grid 4, 120–132. doi:10.1109/TSG.2012.2223766
National Energy Administration (2021). Notice of the National Energy Administration on Issuing the “Key Points of Energy Supervision Work in 2021.
Pan, H., gao, H., Yanhong, y., Wang, m., Yinbo, z., and Junyong, l. (2021). “Multi-type Retail Packages Design and Multi-Level Market Power purchase Strategy for Electricity Retailers Based on Master-Slave Game,” in Zhongguo Dianji Gongcheng Xuebao/Proceedings Chinese Soc. Electr. Eng., 1–16. Available at: https://kns.cnki.net/kcms/detail/11.2107.TM.20210728.1035.006.html.
Parag, Y., and Sovacool, B. K. (2016). Electricity Market Design for the Prosumer Era. Nat. Energ. 1. doi:10.1038/nenergy.2016.32
Qu, K., Huang, L., Yu, T., and Zhang, X. (2018). Decentralized Dispatch of Multi-Area Integrated Energy Systems with Carbon Trading. Zhongguo Dianji Gongcheng Xuebao/proceedings Chin. Soc. Electr. Eng. 38, 697–707. doi:10.13334/j.0258-8013.pcsee.170602
Quashie, M., Marnay, C., Bouffard, F., and Joós, G. (2018). Optimal Planning of Microgrid Power and Operating reserve Capacity. Appl. Energ. 210, 1229–1236. doi:10.1016/j.apenergy.2017.08.015
Shafie-Khah, M., Javadi, S., Siano, P., and Catalao, J. P. S. (20172017). Optimal Behavior of Smart Households Facing with Both price-based and Incentive-Based Demand Response Programs. IEEE Manchester PowerTech. doi:10.1109/PTC.2017.7981248
Teotia, F., Mathuria, P., and Bhakar, R. (2020). Peer‐to‐peer Local Electricity Market Platform Pricing Strategies for Prosumers. IET Generation, Transm. Distribution 14, 4388–4397. doi:10.1049/iet-gtd.2019.0578
Wang, Y., Wang, Y., Huang, Y., Yang, J., Ma, Y., Yu, H., et al. (2019). Operation Optimization of Regional Integrated Energy System Based on the Modeling of electricity-thermal-natural Gas Network. Appl. Energ. 251, 113410. doi:10.1016/j.apenergy.2019.113410
Wang, Z., Yu, X., Mu, Y., and Jia, H. (2020). A Distributed Peer-To-Peer Energy Transaction Method for Diversified Prosumers in Urban Community Microgrid System. Appl. EnergyEnergy 260, 114327. doi:10.1016/j.apenergy.2019.114327
Wei, W., Liu, F., and Mei, S. (2015). Energy Pricing and Dispatch for Smart Grid Retailers under Demand Response and Market Price Uncertainty. IEEE Trans. Smart Grid 6, 1364–1374. doi:10.1109/TSG.2014.2376522
Yang, N., Huang, Y., Dong, B., Xin, P., Liu, S., Ye, D., et al. (2019). Research on the Joint Planning Method of Electricity-Gas Integrated Energy System Based on Multi-Agent Game. Zhongguo Dianji Gongcheng Xuebao/proceedings Chin. Soc. Electr. Eng. 39, 6521–6532. doi:10.13334/j.0258-8013.pcsee.182021
Yu, M., and Hong, S. H. (2016). Supply-demand Balancing for Power Management in Smart Grid: A Stackelberg Game Approach. Appl. Energ. 164, 702–710. doi:10.1016/j.apenergy.2015.12.039
Keywords: aggregation of prosumers, integrated energy microgrid, integrated energy microgrid service provider, linear ladder carbon trading, non-cooperative game capacity allocation, multi-market mechanism
Citation: Wang X, Bai X and Wang P (2022) Optimal Capacity Allocation Model for Integrated Energy Microgrids Considering Aggregation of Prosumers Under Multi-Market Mechanisms. Front. Energy Res. 10:875499. doi: 10.3389/fenrg.2022.875499
Received: 14 February 2022; Accepted: 17 March 2022;
Published: 25 April 2022.
Edited by:
Tao Chen, Southeast University, ChinaReviewed by:
Guifu Du, Soochow University, ChinaYunting Yao, Cardiff University, United Kingdom
Xiaoling Su, Qinghai University, China
Copyright © 2022 Wang, Bai and Wang. This is an open-access article distributed under the terms of the Creative Commons Attribution License (CC BY). The use, distribution or reproduction in other forums is permitted, provided the original author(s) and the copyright owner(s) are credited and that the original publication in this journal is cited, in accordance with accepted academic practice. No use, distribution or reproduction is permitted which does not comply with these terms.
*Correspondence: Xiaoqing Bai, YmFpeHFAZ3h1LmVkdS5jbg==