 Wei Li
 Chaoran Guan
 Xiang Chai
95% of researchers rate our articles as excellent or good
Learn more about the work of our research integrity team to safeguard the quality of each article we publish.
Find out more
ORIGINAL RESEARCH article
Front. Energy Res. , 02 September 2022
Sec. Nuclear Energy
Volume 10 - 2022 | https://doi.org/10.3389/fenrg.2022.875371
This article is part of the Research Topic Numerical Methods and Computational Sciences Applied to Nuclear Energy View all 12 articles
The design of a nuclear thermal propulsion (NTP) reactor based on low-enriched uranium (LEU) requires additional moderator elements in the core to physically meet the critical requirements. This design softens the core energy spectrum and can provide more thermal neutrons for the fission reaction, but the heat transfer characteristics between the fuel and moderator assembly are more complex. Aiming at the typical LEU unit design, the heat transfer mathematical model is established using the principle of heat flow diversion and superposition. The model adopts the heat transfer relationship based on STAR-CCM+ simulation rather than the empirical expression used in the past literature to improve the applicability of the model. The heat transfer coefficients in the proposed model are evaluated under different Reynolds numbers and thermal power. The deviations between the proposed model and CFD simulation are analyzed. The results show that the calculation of the heat transfer coefficient between the proposed model and the CFD simulation maintains a good consistency, most of which are within 10%. It may provide a reliable and conservative temperature estimation model for future LEU core design.
The nuclear thermal propulsion (NTP) reactor has become a potential leading power option for NASA’s crewed landing on Mars due to its much shorter transit time in a long-distance space mission (Hibberd and HEIN, 2021). NTP reactor designs are grouped into high-enriched uranium (HEU) and low-enriched uranium (LEU) designs according to the different enrichment of the nuclear fuel used. A few decades of the cold war between the United States and the Soviet Union had witnessed the amount of mature and effective numerical and experimental work (Belair et al., 2013; Khatry et al., 2019; Graham, 2020) on HEU design. However, recent efforts focus on designing a feasible engine that relies on LEU fuel due to its lower cost and nuclear proliferation risk (Venneri and KIM, 2015a; Venneri and KIM, 2015b; Gates et al., 2018). In LEU design, moderator assembly is employed to cooperate with fuel assembly to support the whole structure and take some heat away. What is more, this design can slow down the fast neutrons produced from the latter and keep the system critical. These new LEU-based generations of NTP require geometrical modifications associated with the assemblies’ thickness and pitch, as well as the core’s length and configuration. These modifications may bring large uncertainties in using empirical models or correlations based on HEU design. Hence, it is essential to understand the influence of moderator assembly on heat transfer, which is required for a core design using a comprehensive analysis method involving neutronics, thermal-hydraulics, and dynamic characteristics of the NTP system.
Several numerical methods have been proposed to model NTP sub-elements over a few decades. Hall et al. (1992) analyzed the thermal-hydraulic performance of the gaseous flow using the KLAXON code. This was among the first computational sequences developed to study an NTP system. Nevertheless, only a simple 1D model was used to predict pressure distribution from the inlet of the reactor core to the exit of the converging-diverging nozzle. Cheng and Yen-Sen (2015) conducted 3D numerical simulations on NERVA-type engine FE using self-developed computational fluid dynamic code (UNIC). The simulation implemented a conjugate heat transfer (CHT) routine to couple the solid and flow regions. Husemeyer (2016) conducted the coupled neutronic-thermal-hydraulic analysis on a Pewee-type engine. The calculation routine relied on a self-developed 3D finite element method to capture temperature distributions across the core. However, most of the work above relied on empirical heat transfer correlations and focused on HEU objects instead of LEU ones. Recently, Wang and Kotlyar (2021) utilized a reduced-order 1.5D semi-analytic solution to implant the legacy heat transfer correlations for a 3D CHT numerical solver on the OpenFOAM platform. Moreover, the in-house 1.5D reduced-order solver, namely, THERMO, uses an inaccurate heat transfer model between fuel assembly and moderator assembly due to the current implementation limitation within THERMO (Krecicki and Kotlyar, 2020).
The purpose of this work is to introduce the heat transfer model of the LEU nuclear thermal propulsion assembly. The flow heat transfer in each coolant channel is simplified into one-dimensional axial heat transfer, characterized by the Newton cooling formula. The radial solid heat conduction is accurately expressed by a three-dimensional heat conduction equation. The heat conduction equation provides heat flux boundary conditions for axial convective heat transfer. The temperature distribution in the fuel assembly and moderating assembly can be obtained by solving the two heat transfer processes. This model can provide thermo-hydraulic compliance for the subsequent conceptual design of the core. Still, the accuracy of the model largely depends on the heat transfer coefficient in the expression. Therefore, referring to the empirical expression of legacy experimental data (Walton, 1992) and utilizing a large number of numerical simulations conducted by STAR-CCM+, the fitted heat transfer coefficient expressions are obtained, which covers as many working conditions as possible to improve the applicability of the correlation.
The mathematical models in the calculation process comprise a continuity equation, a momentum equation, and an energy equation:
where
In the current study, the model proposed by Kays (1994) is employed to evaluate the value of the turbulent Prandtl number.
The realizable k-ε two-layer model (Volkov, 2007) with all y + wall treatment is adopted due to its robustness, accuracy, and computational efficiency. More details about the turbulence models and the corresponding wall treatment can be found in the user guide of STAR-CCM (Siemens Digital Industries Software, 2021).
In the NTP system, as shown in Figure 1, part of the coolant (around 40% of total mass flow rate) flows out of the liquid hydrogen storage tank, first enters the supply channel at the lowest temperature, 35 K, and then flows back through the return channel from the bottom to top. After that, this part of the heated coolant merges with most of the initial coolant (around 60% of total mass flow rate) and flows through the fuel channel. Finally, the fully heated gas is ejected from the tail nozzle to generate thrust. It has been recognized that both fuel center temperature peaks and the moderator temperature peaks vary with the mass flow rate of hydrogen and heat power of the fuel assembly. However, an accurate prediction of peak temperature in the sensitive region remains a significant challenge due to the complex heat transfer mechanism involved in the two kinds of assemblies.
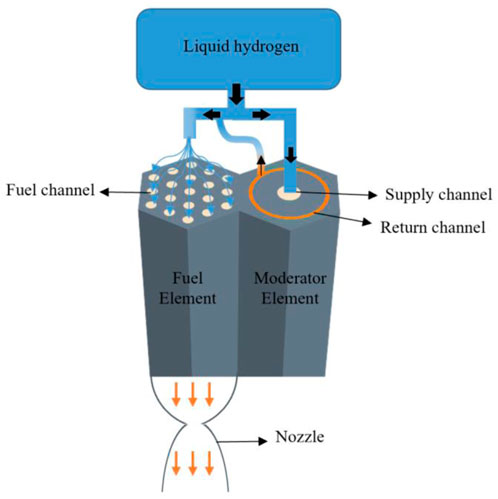
FIGURE 1. Schematic diagram of assemblies’ structure and coolant flow within it.
This study’s fuel and moderator assembly geometry is based on the NERVA-derived design (Belair et al., 2013). The fuel assembly features 19 coolant channels with a diameter of 0.257 cm. The moderator assembly has seven layers from inside to outside: supply channel, inner cladding, ZrHx, return channel, outer cladding, ZrC, and graphite, respectively. Figure 2 presents the fuel and moderator assembly geometry in detail, and Tables 1, 2 list their equivalent annulus dimensions.
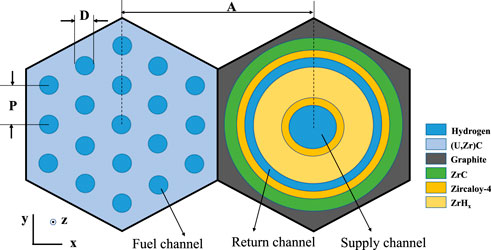
FIGURE 2. Schematic diagram of a hexagonal fuel and moderator assembly.

TABLE 1. Assembly geometric dimensions.
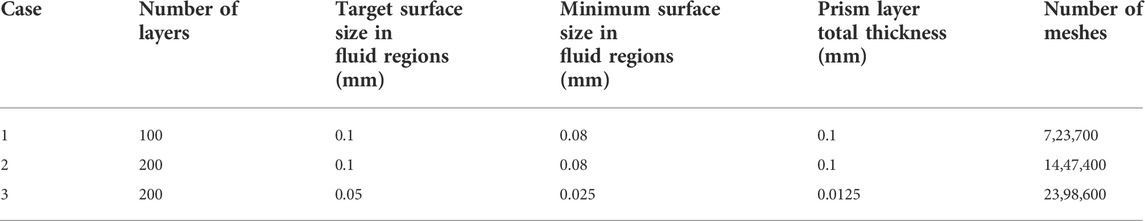
TABLE 2. Mesh independence analysis settings.
Three different meshes were employed in the current study to consider the influence of the mesh resolution. As shown in Table 2, the number of meshes varied from 0.74 to 2.4 million, whereas the meshing diagram of case 2 is shown in Figure 3. The predicted results of the surface temperature of the diagonal line (z = 0.4445 m), as Figure 4 shows, clearly indicated that the influence of the mesh resolution could be neglected when the total number of meshes is more than 1.45 million. The third mesh is chosen in the current study. The total number of meshes is set to around 2.4 million. Based on this current mesh, the iteration convergence is analyzed in Figure 5. Figure 5A shows the fuel channel coolant temperature along with the line probes in the axial direction (x = 0.0001, y = 0) with different iterations by STAR-CCM+, whereas Figure 5B shows the temperature along with the diagonal line probes with different iterations by the software. Each case requires about 20,000 iteration steps to achieve a stable residual smaller than 10−4 for both momentum and energy equations.
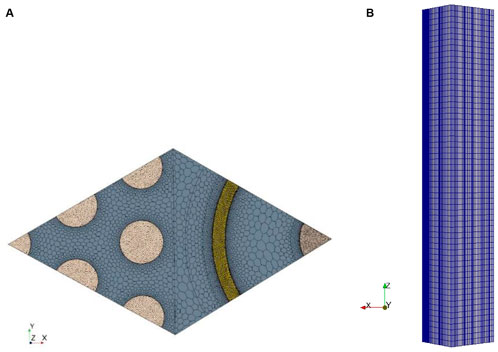
FIGURE 3. Mesh grids layout. (A) radial perspective. (B) axial perspective.
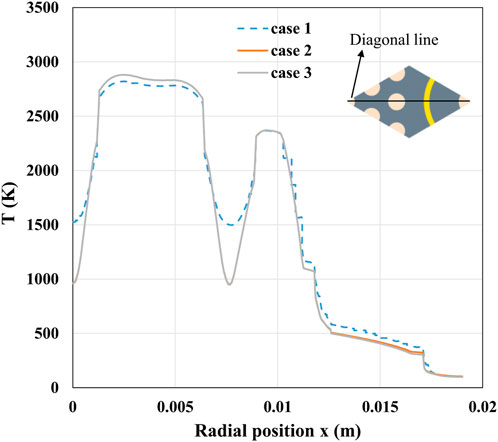
FIGURE 4. Temperature distribution on diagonal line at the half-length of the assemblies.
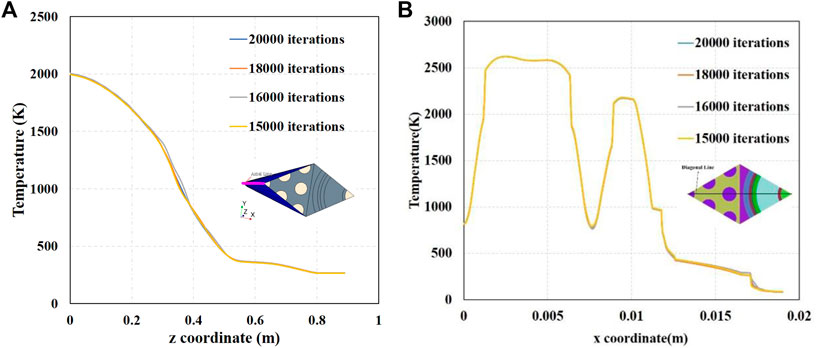
FIGURE 5. Temperature versus iterations. (A) axial distribution. (B) radial distribution.
The conductivity of graphite, ZrHx, ZrC, and Zr was adapted from the work of Krecicki and Kotlyar (2020), (U, Zr)C, the nuclear fuel that we used in this study. Its density and conductivity come from Kubin and Presley (1964). The hydrogen material properties play a significant role in the simulation. Thus, almost all the properties are functions of temperature and pressure. The density of the hydrogen is referenced in Lyon (1973), and the other hydrogen properties such as dynamic viscosity, conductivity, and specific heat capacity were adapted by Bradley (2012).
The boundary conditions involved in coolant flow and solid heat conductions shown above are summarized in Table 3, which come from a typical case (Belair et al., 2013). As shown in Figure 6, 39.14% of the coolant first flows through the supply channel and return channels to protect the moderating assembly from overheating and ablating. Most coolant passes through fuel channels simultaneously and is heated to about 2,800 K (outlet temperature) in a small space and distance. The temperature span is so large that the influence of physical properties changing with temperature on the heat transfer process must be considered. Among them, hydrogen density and hydrogen-specific heat greatly influence the accuracy of the results. The specific heat as a function of temperature has been given in Bradley (2012). As for the density, this study uses the field function of STAR-CCM+ to accurately provide the density of hydrogen in the temperature range with drastic changes in physical properties.
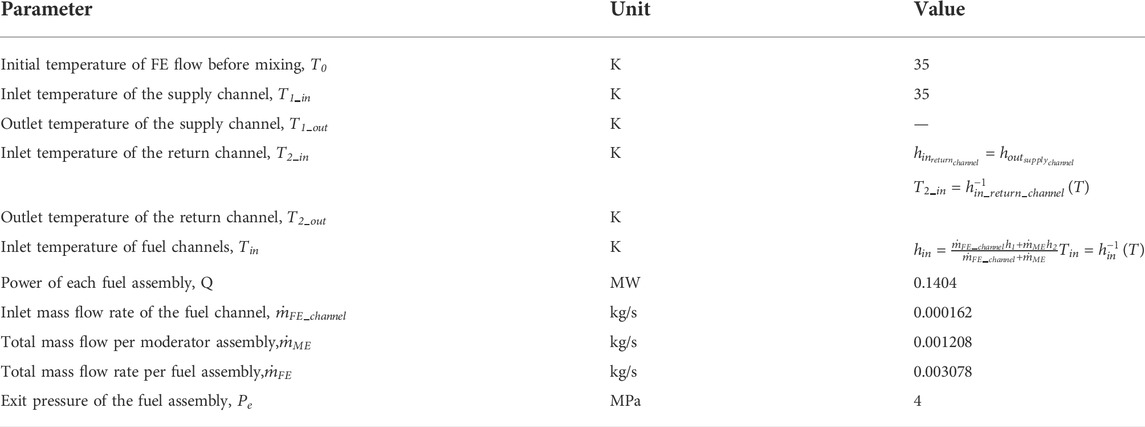
TABLE 3. Summary of the boundary conditions.
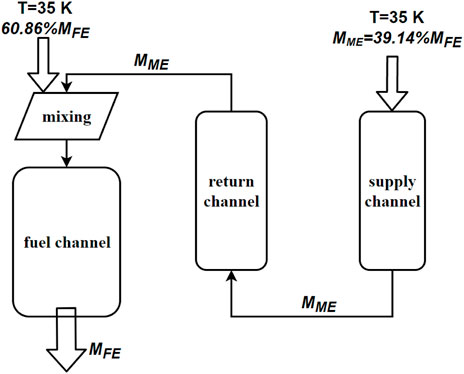
FIGURE 6. Flow distribution among the channels.
In the current case, the outlet temperature of the core is expected to be 2,800 K. Therefore, the power of the fuel assembly is 0.1404 MW based on energy conservation. Besides, a volumetric heat source with cosine distribution in the axial direction is employed in the simulation, which is considered closer to the reactor’s actual power distribution.
where
For NTP reactors, cores with different power levels are usually designed according to the mission to meet different mission requirements, such as a crewed lunar landing or crewed Mars landing. Different tasks correspond to different core power levels, and the fuel assembly as the basic unit of output power may operate at different power. It is essential to ensure that the fuel and moderator assembly operate safely within a reasonable power range. In order to ensure that the temperature does not exceed the limit, different output powers of components correspond to different flow characteristics (i.e., Reynolds number). As a typical case, the inlet Reynolds number of the simulation domain is around 1,00,000. According to this typical reference case (case 2), the other four cases are expanded, as shown in Table 4. In cases 1 and 3, the inlet Reynolds number is decreased and increased by 20%, respectively. In cases 4 and 5, 20% reduction and increment will occur, respectively, when the heating power is modified with other parameters of case 2.
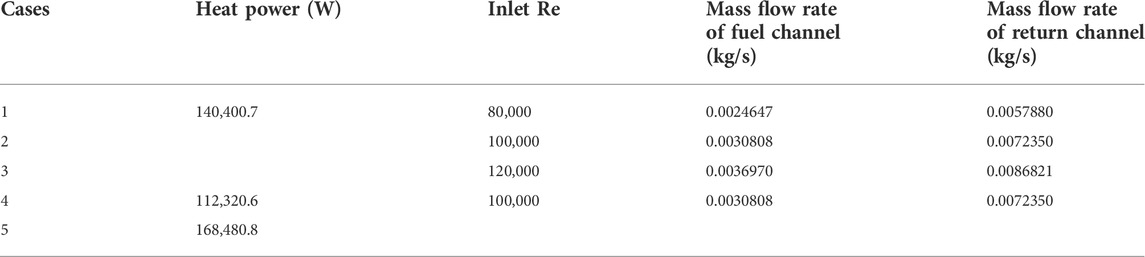
TABLE 4. Simulation case settings considering different Reynolds numbers and heat power.
Based on case 2, preliminary simulation can be first carried out by STAR-CCM+ to understand heat transfer between assemblies. Figures 7, 8 give the cross-sectional profiles of velocity (axial direction) and temperature at two assembly heights. They show that the velocity and temperature vary significantly among the channels, ranging from 23 to 537 m/s and from 45 to more than 2,200 K, respectively. The negative values shown in Figure 7 indicates that the fluid flow direction is perpendicular to the paper surface outward. The temperature of the coolant varies significantly in the axial direction. Therefore, the density, pressure, and speed vary greatly, and the speed of the drastic change, in turn, affects the temperature distribution. The influence between them is a two-way intense coupling process.
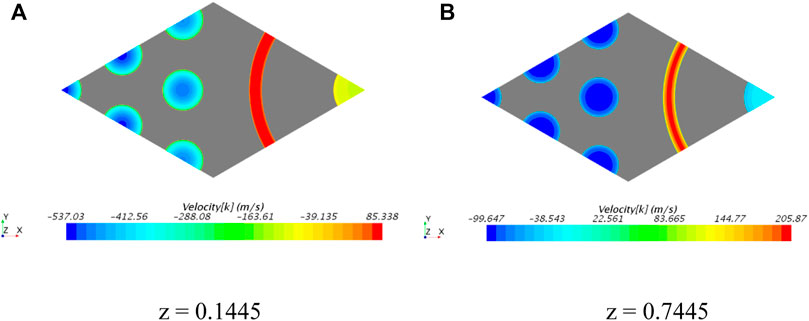
FIGURE 7. Cross-sectional profiles of velocity magnitude in case 2. (A) cross-sectional profile while height is equal to 0.1445. (B) cross-sectional profile while height is equal to 0.7445.
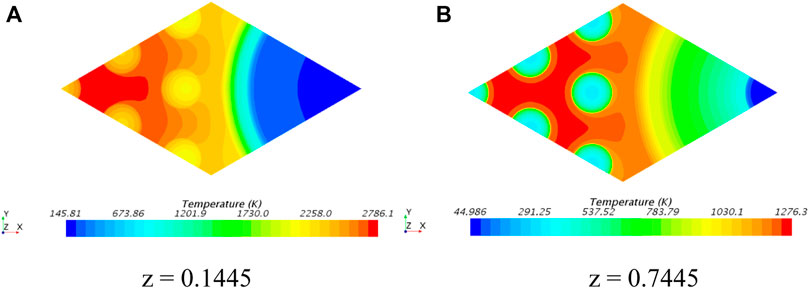
FIGURE 8. Cross-sectional profiles of temperature in case 2. (A) cross-sectional profile while height is equal to 0.1445. (B) cross-sectional profile while height is equal to 0.7445.
Significant temperature changes can be confirmed by the heat flow distribution in each component, as shown in Figure 9. It shows axial linear heat power distribution of all channels, and it can be seen that most of the heat is taken away by the coolant in the fuel channel, so its temperature changes most violently, which can also be further confirmed by the axial temperature distribution of the fuel assembly, as shown in Figure 10. Besides, Figure 9 shows that the fuel assembly transfers heat to both the return channel and supply channel of the moderating assembly. The quantitative results show that this part of heat accounts for about 11.6% of the total. Moreover, the heating power of the return channel has some negative values near the outlet section, indicating that the coolant has an outward heat transfer process.
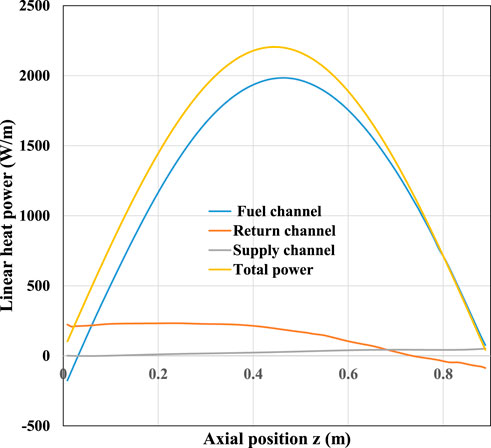
FIGURE 9. Axial linear heat power distribution of each channel in case 2.
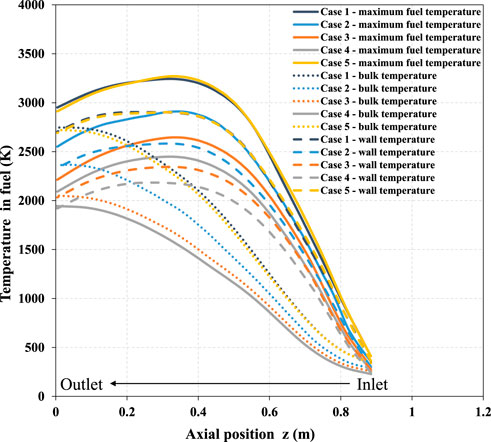
FIGURE 10. Maximum fuel center temperature, bulk temperature, and wall temperature in fuel channel vary among different cases.
The reverse heat transfer can be seen from the axial distribution of the bulk and wall temperatures in the return channel, as shown in Figure 11, which also shows that the bulk temperature in the return channel increases and then decreases along the flow direction because the coolant flow direction of the return channel is contrary to that of other channels, which adds the complexity of finding the heat exchange law between assemblies. In case of the possible failure of the existing empirical correlation of heat transfer coefficient, it is necessary to establish a new inter-assembly heat transfer model. This model can be regarded as reliable for future core design by accurately predicting the fuel and moderator peak temperature. The above analysis reveals the general phenomenon of heat transfer between assemblies. However, the heat distribution in each channel and peak temperature inside the assembly under different working conditions still need more profound concern. Before further discussion, a new heat transfer model between assemblies must be established. The following part will carefully deduce the heat transfer function based on the simplified axial convective heat transfer model and radial thermal resistance.
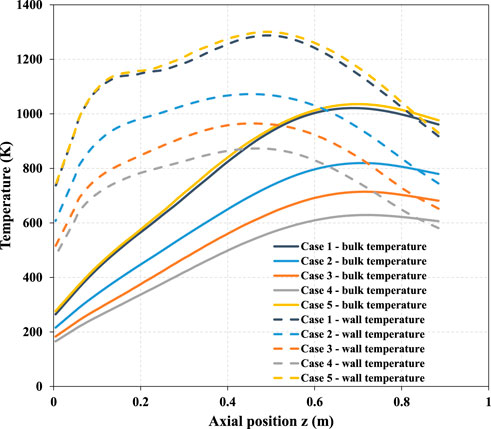
FIGURE 11. Bulk and wall temperatures in the return channel vary among different cases.
Figure 12 displays the equivalent FE and full ME model that preserves the hydraulic parameter and fuel volume. The equivalent FE model draws on the method by Wang and Kotlyar (2021). The method uses 1/19 of the full explicit FE model to get a conservative but quick result, although it is more suited for solving circular and annular pins instead of hexagonal prisms. As for the heat transfer mechanism between assemblies, different from the 1.5D conduction–convection solution (Krecicki and Kotlyar, 2020; Wang and Kotlyar, 2021), the current research focuses on deriving the heat transfer equations between the two assemblies according to the principle of heat flow diversion and superposition (Holman, 2010). Heat flux
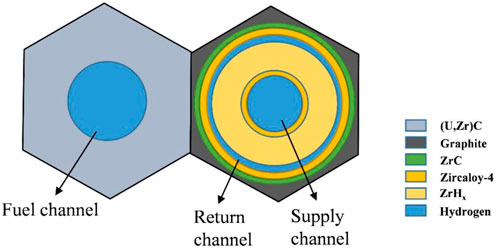
FIGURE 12. Schematic diagram of simplified assemblies.
Eqs 9, 12 are only functions of the fuel center and bulk temperatures. If Eq. 13 is simultaneously used when the inlet and outlet temperature of the fuel channel and fuel assembly power (this is usually considered as boundary conditions) are known, the fuel center and bulk temperatures of the return channel can be calculated more conveniently. The maximum temperature limit of the fuel center is one of the criteria for future core design. Moreover, it is also essential to predict the maximum temperature of the moderator assembly, which can release the design margin of the coolant flow rate in the current LEU core design. Therefore, it is necessary to establish the relationship between the return channel’s bulk temperature and the moderator’s maximum temperature through STAR-CCM+ simulation so that the maximum temperature of the moderator can be predicted once the bulk temperature is known. Eqs 9, 12 provide an effective way to predict temperature, but the accuracy of the prediction depends on the selection of heat transfer coefficient. The usual practice is to select the empirical correction based on legacy experimental data. Nevertheless, it may not apply to LEU assembly, especially the flow and heat transfer of the return channel. In this work, the CFD method is used to simulate different working conditions, and the heat transfer coefficients are fitted from the simulation results concerning the form of general legacy empirical correction. The evaluated formula is substituted into Eqs 9, 12 for further calculations. The prediction effect evaluation will also be discussed subsequently.
Firstly, based on the CFD simulation, the Nusselt number distribution in the axial direction of the fuel channel under various working conditions is calculated, as shown in Figure 13. With the increase in height, the Nusselt number in the fuel channel increases gradually. The increase in Nu can be explained by the coolant flowing through the fuel assembly from top to bottom. With the decrease in height, the temperature difference between coolant and fuel gradually decreases, and the heat exchange process slows down. It is worth mentioning that when the coolant approaches the outlet, the Nusselt number first decreases and then increases, which is due to the outlet effect, and the bulk temperature of the fuel channel also presents a similar phenomenon.
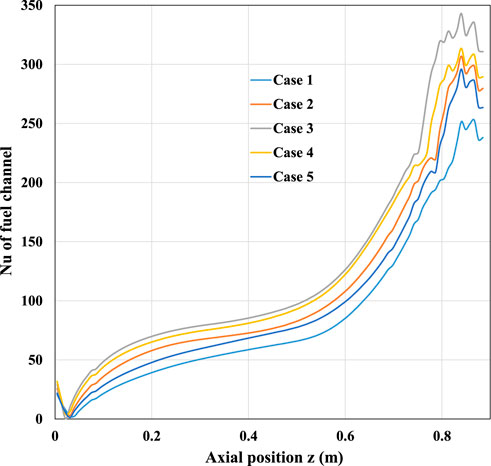
FIGURE 13. Axial distribution of the Nusselt number in fuel channel considering different Reynolds numbers and heat power.
Figure 14 shows that the Nusselt number in the return channel decreases slowly along the flow direction. However, when approaching the outlet section of the return channel, there is distortion in the Nusselt number curve due to the propellant flowing in two opposite directions in the fuel and return channels. The coolant in the fuel channel cools the fuel assembly from top to bottom. Thus, its temperature rises from top to bottom, as Figure 10 shows. Because the fuel power presents a cosine distribution in the axial direction, the fuel center temperature increases and decreases from top to bottom. Moreover, the fuel channel’s coolant will make the fuel center’s maximum temperature shift downstream along the axis. The coolant in the return channel cools the moderator assembly from bottom to top, and the temperature rises first and then decreases in Figure 11. Therefore, the so-called reverse heat transfer process will occur when the fuel center temperature drops below the return channel bulk temperature. This process occurs after about z = 0.8. Figure 15 shows that the linear heat flux has a negative value. Once reverse heat transfer occurs, the bulk temperature will continue to decrease, which can protect the moderator on the right from high-temperature damage. Further, for evaluating the heat transfer coefficient, only the heat transfer coefficient in the height range of 0–0.8 m can be considered without affecting the conservative estimation of the maximum temperature of the bulk temperature in the return channel.
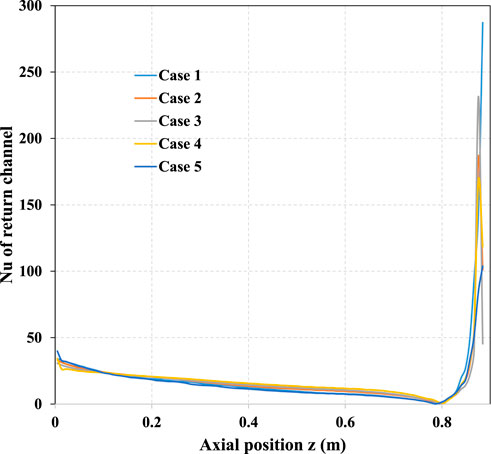
FIGURE 14. Axial distribution of the Nusselt number in the return channel considering different Reynolds numbers and heat power.
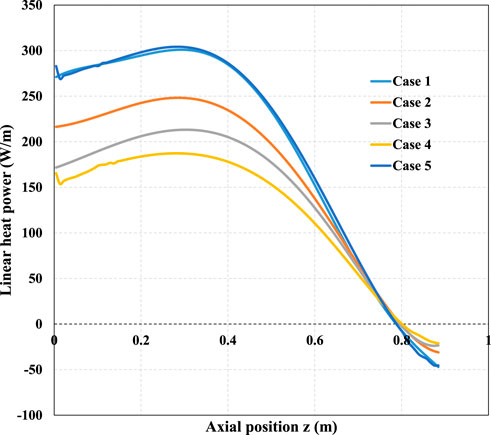
FIGURE 15. Axial linear heat power distribution of return channel considering different Reynolds numbers and heat power.
Referring to the Dittus–Boelter correlation and approximating it according to the Nussle number curve in Case 2, the mathematical expression for the Nussle number can be obtained as shown in Eqs 14, 15, where
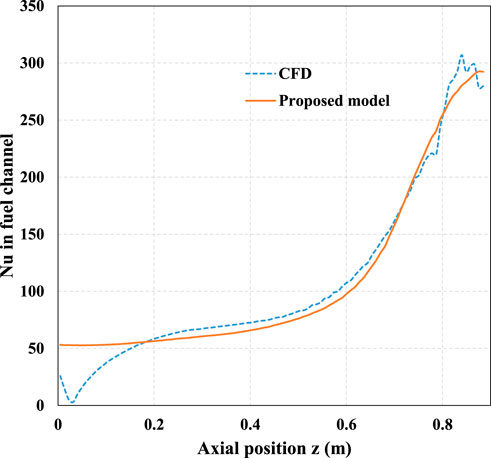
FIGURE 16. Nu calculation of the fuel channel in case 2.
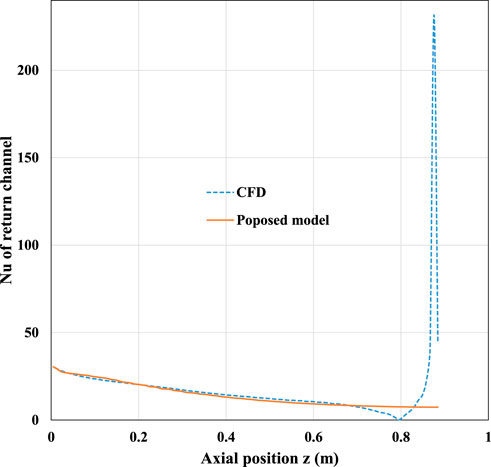
FIGURE 17. Nu calculation of the return channel in case 2.
Further analysis should be considered to prove the proposed model’s reliability for temperature prediction. Firstly, the difference between the Nusselt number calculated by the two equations and the Nusselt number obtained by STAR-CCM+ numerical simulation is compared. Figures 18, 19 show that the deviations in the Nusselt number between the CFD model and the proposed model are mostly within 10%. The points with a relatively large coefficient deviation are located in the outlet section in the fuel channel. The height is less than 0.2 m, which can also be seen intuitively in Figure 16. In this area, the bulk and wall temperature difference first decreases and then increases. In other words, the bulk temperature increases slowly from low to high, and the wall temperature decreases slowly from high to low. When the two temperatures are approaching, the flow heat transfer capacity will decrease, leading to the falling of the heat transfer coefficient; the bulk temperature slightly exceeds the wall temperature in the approaching outlet section, where a reverse heat transfer process occurs. The heat transfer coefficient increases slightly, but this range is minimal (0–0.05 m), and the heat transfer coefficient changes little. For the two model coefficient evaluation curves in Figure 18, on the premise of ensuring that most of the deviation range is within 10%, the calculation curve of the heat transfer coefficient of the proposed model is lower than that of CFD, which can ensure a conservative estimation temperature prediction in this channel.
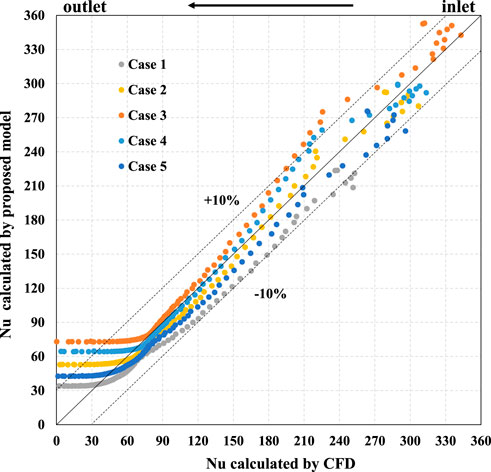
FIGURE 18. Comparison of the Nusselt number deviation in fuel channel by two methods.
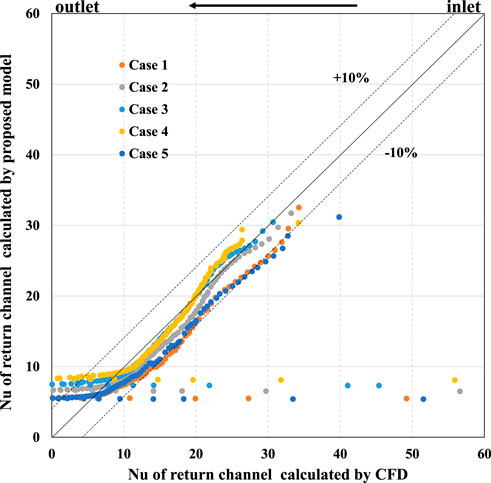
FIGURE 19. Comparison of the Nusselt number deviation in return channel by two methods.
Heat transfer coefficient evaluation in the return channel should be considered as well. Figure 19 shows that the Nusselt number has a large deviation at the exit section. Therefore, the predicted value of the heat transfer coefficient in this narrow area deviates greatly from the CFD result. Nevertheless, it does not affect the maximum temperature prediction of the return channel. Figure 11 shows that the bulk temperature in the return channel begins to drop at a height above 0.7 m. Thus, the prediction of the maximum bulk temperature of the return channel only needs to consider the temperature change at the height below 0.7 m. In addition, just like the evaluation of the heat transfer coefficient in the fuel channel, the return channel also ensures that the model calculation curve is lower than the CFD calculation curve, which can not only balance the deviation of the outlet section but also obtain the conservative prediction of the bulk temperature in the return channel.
The purpose of predicting the maximum bulk temperature of the return channel is to obtain a conservative estimate of the maximum ZrHx moderator temperature. The limit of the maximum ZrHx moderator temperature (around 1,000 K) is one of the criteria for the future NTP conceptual design. Figure 20 presents the maximum temperature comparison between the return channel and the ZrHx moderator and shows that the maximum bulk temperature in the return channel is about 100 K higher than that of the ZrHx moderator. There is a simple linear relationship between the two curves. Then, it can be concluded that it is appropriate to regard the prediction of the maximum bulk temperature of the return channel by the model as a conservative estimation of the maximum moderator temperature.
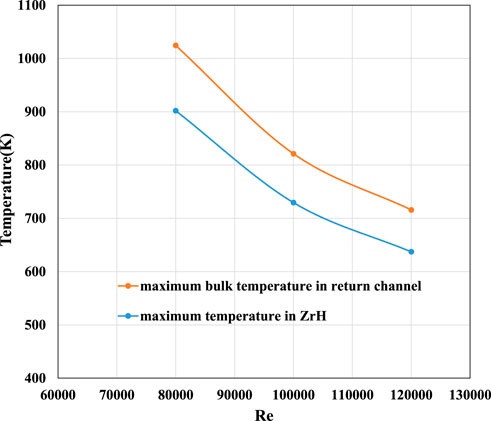
FIGURE 20. Maximum temperature comparison between return channel and ZrHx.
A simplified heat transfer model between LEU fuel assembly and moderator assembly is proposed by deriving the thermal resistance assumption between the assemblies. The model’s correction evaluation of the heat transfer coefficient is conducted based on CFD simulations and legacy empirical formula. Furthermore, the calculation deviation of the model is calculated and analyzed under different Reynolds numbers and heating power. The results show that the model’s evaluation curve of the axial distribution of heat transfer coefficient is in good agreement with the CFD calculation results, and the overall deviation of the axial distribution of heat transfer coefficient is less than 10%, whether in the fuel or return channel. The deviation near the outlet is large, but the overall evaluation curve is slightly lower than the CFD calculation curve to ensure that the temperature prediction of the model is conservative. The proposed model can be applied to the LEU core design in the future NTP concept design.
The datasets presented in this article are not readily available because there are restrictions. Requests to access the datasets should be directed to WL, smartwei@sjtu.edu.cn.
WL: conceptualization, methodology, software, validation, formal analysis, data curation, visualization, and writing—original draft. CG: software, validation. HS: methodology, formal analysis, data curation. XC: supervision, conceptualization, investigation, resources, writing—original draft, writing—review and editing, project administration, and funding acquisition. XL: supervision, writing—review and funding acquisition.
The authors gratefully acknowledge the support provided by the National Key R&D Program of China under Grant no. 2020YFB1901900.
The authors declare that the research was conducted in the absence of any commercial or financial relationships that could be construed as a potential conflict of interest.
All claims expressed in this article are solely those of the authors and do not necessarily represent those of their affiliated organizations or those of the publisher, the editors, and the reviewers. Any product that may be evaluated in this article, or claim that may be made by its manufacturer, is not guaranteed or endorsed by the publisher.
Belair, M. L., Sarmiento, C., and Lavelle, T. (2013). “Nuclear Thermal Rocket Simulation in NPSS,” in proceedings of the 49th AIAA/ASME/SAE/ASEE Joint Propulsion Conference.
Bradley, A. (2012). Multiphysics design and simulation of a tungsten-cermet nuclear thermal rocket. Master’s thesis. Texas A&M University. Available at: https://hdl.handle.net/1969.1/ETD-TAMU-2012-08-11649.
Cheng, G. C., and Yen-Sen, I. Y. (2015). Numerical Study of Single Flow Element in a Nuclear Thermal Thrust Chamber[J]. J. Aeronautics Aerosp. Eng. 04 (3).
Gates, J. T., Denig, A., Ahmed, R., Mehta, V., and Kotlyar, D. (2018). Low-Enriched Cermet-Based Fuel Options for a Nuclear Thermal Propulsion Engine. Nucl. Eng. Des. 33, 313–330. doi:10.1016/j.nucengdes.2018.02.036
Graham, C. (2020). The History of Nuclear Thermal Rocket Development [J]. Reference Module Earth Syst. Environ. Sci.
Hall, M. L., Rider, W. J., and Cappiello, M. W. (1992). Thermohydraulic Modeling of Nuclear Thermal Rockets: The KLAXON Code[J]. Trans. Am. Nucl. Soc.
Hibberd, A., and Hein, A. M. (2021). Project Lyra: Catching 1I/‘Oumuamua–Using Nuclear Thermal Rockets. Acta Astronaut. 179, 594–603. doi:10.1016/j.actaastro.2020.11.038
Husemeyer, P. J. A. (2016). Design and Optimization of a Low-Enriched Uranium Nuclear Thermal Rocket Engine (Cambridge, UK: Thesis for Doctoral Degree in Nuclear Engineering at University of Cambridge).
Kays, W. M . (1994). Turbulent Prandtl Number—Where Are We?[J]. J. Heat. Transf. 116 (2), 284–295. doi:10.1115/1.2911398
Khatry, J., Aydogan, F., Ilyas, M., and Houts, M. (2019). Modeling of Corrosion-induced Blockages on Radiation Heat Transfer by using RELAP5-3D. Prog. Nucl. Energy 112, 123–134. doi:10.1016/j.pnucene.2018.12.005
Krecicki, M., and Kotlyar, D. (2020). Low Enriched Nuclear Thermal Propulsion Neutronic, Thermal Hydraulic, and System Design Space Analysis[J]. Nucl. Eng. Des., 363.
Kubin, R. F., and Presley, L. L. (1964). Thermodynamic Properties And Mollier Chart For Hydrogen From 300deg k to 20,000deg k. Washington, DC. Scientific and Technical Information Division, National Aeronautics and Space Administration.
Lyon, L. L. (1973). Performance of (U,Zr)C-Graphite (Composite) and of (U,Zr)C (Carbide) Fuel Elements in the Nuclear Furnace 1 Test Reactor. United States. doi:10.2172/4419566
Venneri, P. F., and Kim, Y. (2015b). A Feasibility Study On Low Enriched Uranium Fuel For Nuclear Thermal Rockets – II: Rocket And Reactor Performance [J]. Prog. Nucl. Energy, 87.
Venneri, P. F., and Kim, Y. (2015a). A Feasibility Study On Low-Enriched Uranium Fuel For Nuclear Thermal Rockets – I: Reactivity Potential. Prog. Nucl. Energy 83, 406–418. doi:10.1016/j.pnucene.2015.05.003
Volkov, K. N. (2007). Application Of A Two-Layer Model Of Turbulence In Calculation Of A Boundary Layer With A Pressure Gradient. J. Eng. Phys. Thermophys. 80, 97–106. doi:10.1007/s10891-007-0013-0
Walton, J. T. (1992). Program Elm: A Tool For Rapid Thermal-Hydraulic Analysis Of Solid-Core Nuclear Rocket Fuel Elements. United States.
Keywords: low-enriched uranium, nuclear thermal propulsion, STAR-CCM+ simulation, heat transfer mathematical model, heat transfer coefficients
Citation: Li W, Guan C, Song H, Chai X and Liu X (2022) Numerical investigation of heat transfer characteristics of moderator assembly employed in a low-enriched uranium nuclear thermal propulsion reactor. Front. Energy Res. 10:875371. doi: 10.3389/fenrg.2022.875371
Received: 14 February 2022; Accepted: 11 July 2022;
Published: 02 September 2022.
Edited by:
Yue Jin, Massachusetts Institute of Technology, United StatesReviewed by:
Jinyong Feng, Massachusetts Institute of Technology, United StatesCopyright © 2022 Li, Guan, Song, Chai and Liu. This is an open-access article distributed under the terms of the Creative Commons Attribution License (CC BY). The use, distribution or reproduction in other forums is permitted, provided the original author(s) and the copyright owner(s) are credited and that the original publication in this journal is cited, in accordance with accepted academic practice. No use, distribution or reproduction is permitted which does not comply with these terms.
*Correspondence: Xiang Chai, eGlhbmdjaGFpQHNqdHUuZWR1LmNu
Disclaimer: All claims expressed in this article are solely those of the authors and do not necessarily represent those of their affiliated organizations, or those of the publisher, the editors and the reviewers. Any product that may be evaluated in this article or claim that may be made by its manufacturer is not guaranteed or endorsed by the publisher.
Research integrity at Frontiers
Learn more about the work of our research integrity team to safeguard the quality of each article we publish.