 Guisheng Hou
 Hongyu Song
94% of researchers rate our articles as excellent or good
Learn more about the work of our research integrity team to safeguard the quality of each article we publish.
Find out more
ORIGINAL RESEARCH article
Front. Energy Res., 28 March 2022
Sec. Sustainable Energy Systems
Volume 10 - 2022 | https://doi.org/10.3389/fenrg.2022.873324
This article is part of the Research TopicFinancial and Trade Globalization, Greener Technologies and Energy TransitionView all 46 articles
Energy transition can effectively promote the green transformation of economic development. With capital, traditional fossil energy, clean energy generation, thermal power generation, and the GDP of the provinces, we built a stochastic production frontier model based on a translog production function, which measures the bias of directed technical changes and substitution elasticities of 30 provinces in mainland China from 2000 to 2017. The results show that the directed technical change in China is more biased to thermal power generation and deviated from clean energy generation. In addition, except for traditional fossil generation and thermal power generation with a complementary relationship, there is a substitution relationship between other energy factors. At the regional level, the production patterns of 9 provinces (Beijing, Fujian, Hainan, Tianjin, Chongqing, Gansu, Neimenggu, Ningxia, and Xinjiang) are conducive to the external electric transition, and nine provinces (Beijing, Fujian, Guangxi, Hainan, Hubei, Jilin, Jiangsu, Qinghai, and Zhejiang) are beneficial to the internal electric transition. We find that there is a large room for improvement in external and internal electric transitions in most provinces. We propose that the Chinese government should promote the reform of the market-oriented energy pricing mechanism according to different production modes in different regions. Furthermore, the results from the analysis of China show that it is also possible for other countries to treat their energy transition differently due to their characteristic production patterns.
Since the reform and opening up, with the rapid development of China’s economic aggregate, energy depletion and environmental deterioration have emerged. Therefore, a green and sustainable development has become the focus of high attention from all sectors of the society (Wu et al., 2020). In 2019, coal, oil, and natural gas consumption accounted for 62.8%, 20.7%, and 8.7%, respectively, while primary power and other energy consumption accounted for only 7.8% (China Statistical Yearbook, 2020). According to the China Energy Statistics Yearbook, fossil energy like coal, oil, and natural gas will play a long-term dominant role in the primary energy consumption structure. Therefore, China is one of the most urgent countries for energy transition in the world (Wang and Feng, 2011; Xu et al., 2014; Jiang et al., 2020). At present, energy transition has been a national strategy. On September 22, 2020, General Secretary Xi Jinping solemnly announced at the 75th UN General Assembly, “China’s carbon dioxide emissions strive to peak by 2030 and strive to achieve carbon neutrality by 2060.” In addition, according to the Energy Production and Consumption Revolution Strategy (2016–2030), non-fossil energy accounted for about 20% in 2030, and non-fossil energy accounted for more than half in 2050. Therefore, according to the relevant goals of carbon neutrality and carbon peak reaching, the optimization of China’s energy transition will continue to advance.
The past 5 decades have witnessed significant progress in the domain of energy transition. Existing studies mainly focus on the inter-fuel transition (Liu et al., 2018; Naeem et al., 2021), such as the substitution among the pairs of natural gas–coal, oil–coal (Hao and Huang, 2018), and renewable–non-renewable (Lin and Ankrah, 2019a; Lin and Ankrah, 2019b). In addition, there are studies on the transition between energy and non-energy, such as the substitution among capital, labor, and energy (Fan and Zheng, 2019; Lin and Abudu, 2019; Zhang and Lin, 2019; Alataş, 2020; Lin and Abudu, 2020; Raza et al., 2020; Alataş et al., 2021). Some studies (Bello et al., 2018) also analyze the transition between hydro power and fossil energy. However, few studies analyze the transition of external and internal electric transition. Therefore, it is hard to obtain the transition pathway of external and internal transition.
The purpose of this article is to promote the internal and external electric transition by classifying the production modes of 30 provinces in China with the substitution elasticities and directed technological changes. The results show that the directed technical change in China is more biased to thermal power generation and deviated from clean energy generation. At the provincial level, the production patterns of 9 provinces (Beijing, Fujian, Hainan, Tianjin, Chongqing, Gansu, Neimenggu, Ningxia, and Xinjiang) are conducive to the external electric transition, and nine provinces (Beijing, Fujian, Guangxi, Hainan, Hubei, Jilin, Jiangsu, Qinghai, and Zhejiang) are beneficial to the internal electric transition. Compared to previous studies, the contribution of this article is mainly the following three points: first, based on the translog production function, we introduce clean energy power generation, thermal power generation, and traditional fossil energy as different input factors into the production function for the first time and further analyze the determinants of production technology efficiency in China. Second, we analyze the directed technical change in internal and external transition, that is, the preference for input factors during production in 30 regions. Third, combining the degree of biased technological change and the substitution elasticity between inputs, the path of promoting the energy transition is analyzed from the perspectives of internal and external transition, respectively.
The rest of the article is organized as follows: Section 2 covers literature review; Section 3 provides models, methods, and data; Section 4 presents the results and discussion of the improvement pathway of energy transition; and Section 5 summarizes conclusion and policy implications.
Optimizing the energy consumption structure will not only need clear development goals and effective policy support but also discuss the alternative relationship between energy inputs on the basis of the development level and resource endowment of different regions. However, directed technological changes determine the preference of input factors in the production process. Research on energy transition has focused mainly on the relationship between fossil and non-fossil energy. Wesseh and Lin (2016) analyzed the alternative relationship between different energy types in Egypt. They found that the average alternative elasticity between renewable and non-renewable energy sources is 1.41. This alternative relationship suggests that inter-energy substitution is possible from a technical perspective. Solarin and Bello (2019) analyzed the possibility of fossil energy and biomass energy substitution in Brazil. Their GDP model showed that using more biomass and less fossil energy can be kept sustainable in the Brazilian economy. Lin and Adubu used ridge regression to analyze alternative elasticity between renewable and non-renewable energy in the Middle Eastern and North African sectors. The results show that the alternative between renewable and non-renewable energy is perfect, with an alternative elasticity value of 0.95. Khalid and Jalil (2019) investigated the inter-fuel substitution by estimating the substitution elasticity among coal, natural gas, petroleum, and hydroelectricity. The findings show that all the factors are subsitutes. Lin and Agyeman (2020) estimated inter-fuel substitution elasticities and bias technical change in Sub-Saharan sectors. From the empirical results, the oil is more likely to be substituted for natural gas than coal. Zhang et al. (2018) surveyed natural gas in various sectors of China. The results show that the demand for natural gas is complementary to coal in industrial and power generation sectors. Wang (2021) measured the substitution between coal, electric power, and fuel in the China’s industrial sector. The results show that there is a substitution among coal, electric power, and fuel. However, Malicov et al. (2018) found that the technical substitution between clean and dirty energy inputs may not be strong.
Furthermore, some studies have considered the alternative relationships between energy and non-energy. Yang et al. (2018) analyzed the alternative elasticity between input factors in the Chinese industrial sector and found that the relationship of capital–fossil energy and labor–fossil energy was complementary. These conclusions suggest that a reduced capital input or an increased labor input can lead to a reduction in fossil energy input. Lin and Raza (2021) analyzed the alternative resilience between energy, capital, and labor in Pakistan’s agricultural sector and showed that all inputs were alternatives, arguing that labor and capital could reduce carbon dioxide emissions through alternative energy sources. Kim and Heo (2013) studied the substitutions between energy and capital for manufacturing in the Organization for economic cooperation and development (OECD) countries and concluded about substitutability between energy and capital. Zha et al. (2016) analyzed the alternative elasticity between energy and non-energy in the industrial sector based on the translog production function, which showed that energy and capital have an alternative relationship and the substitution exists between energy and labor, except in 2011. Ouyang et al. (2018) explored the energy substitution effect of the transportation sector in Shanghai and found that the substitution elasticity between labor and energy is around 1.0095. Constantini et al. (2019) computed the substitution elasticity for manufacturing sectors in 21 OECD countries and addressed the capacity of the production system to be adequate for a low-carbon economy. Wei et al. (2019) explored the inter-factor substitution and the influence of technical changes on high-tech industries in China. The results showed that the substitution elasticity between labor and energy was the highest, and the technical progress was biased to saving energy. Lin and Chen (2020) found the exisitence of substitution relation among labor energy and capital in China’s non-ferrous metal industries. Raza te al. examined the substitution elasticities of input factors (capital, labor, and energy consumption). The results showed that the elasticities of substitution between capital–energy, capital–labor, and labor–energy consumption are close to 1. The issue of transition from the perspective of fossil energy–non-fossil energy or energy–non-energy has been widely discussed. However, there are relatively few studies on electric transformation.
“Electric transition” requires effective use of electric energy not only to replace loose burning coal, fuel, and other energy consumption methods but also to vigorously develop clean energy power to replace an inefficient thermal power generation production mode. In terms of the “electric transition”, it can be divided into “external electric transition” and “internal electric transition” (Liu and Wang, 2019). External electric transition refers to the replacement of traditional fossil energy with clean energy generation and thermal power generation, which is the way to realize the orderly transition from primary energy dependence to secondary energy dependence. Internal electric transition refers to the replacement of thermal power generation with clean energy power generation, which is the way to realize the technical upgradation of clean energy power generation to thermal power generation. The consumption of clean energy has a positive influence on carbon emissions (Abumunshar et al., 2020; Altarhouni et al., 2021; Yazan et al., 2022). Two kinds of electric transition can be seen in Figure 1. We refer to it as internal transition and external transition.
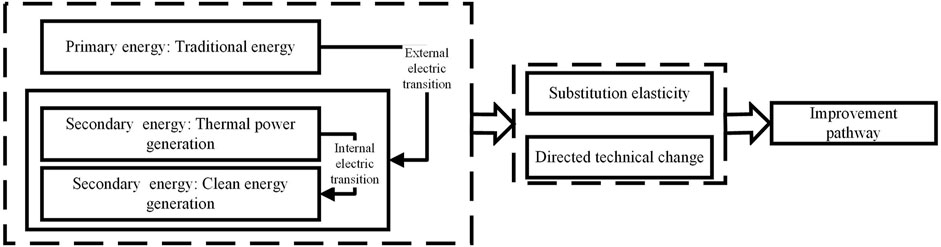
FIGURE 1. Boundary definition of external and internal electric transition.
In addition, few studies have focused on the key role of directed technical change bias in energy use preferences. Directed technical change bias refers to the change of the factor substitution rate by technological progress. If technological progress leads to a greater increase in the marginal output growth rate of factor j relative to factor k, technological change is biased toward factor j, called technological change biased toward j-using, also known as biased toward k-saving. On the contrary, technological progress is biased to factor k, called technical change biased to k-using, also referred to as biased to j-saving (Hicks, 1932). If technological changes make the marginal output growth rate of both equal, it means that technological changes are Hicks neutral, and technical changes will be combined with a proportional increase of j or k. When considering a pair of input elements for fossil energy and low-carbon energy, technological change that tends to use low-carbon energy and save fossil energy may help in the energy structure optimization. Existing studies have confirmed that the technological change bias can be transformed by adjusting the relative prices between elements. Some studies (Popp, 2002; Acemoglu et al., 2012; Aghion et al., 2016) show that firms tend to innovate relatively more in clean technologies when they face higher tax-inclusive energy prices. Therefore, only through the substitution between factors, there is no scientific judgment that the energy transition is happening. After identifying the bias of technological change between energy inputs, further consideration of the substitution elasticity between factors is the key to analyzing the improvement pathway of the energy consumption structure.
Specifically, in the internal transition, encouraging the development of production technologies biased to clean energy power generation and improving the substitution relationship between clean energy power generation and thermal power generation can effectively help to optimize the energy consumption structure. In the external transition, actively developing the production technology biased to secondary energy and improving the substitution elasticity between secondary energy and primary energy can help realize the transition from primary energy dependence to secondary energy dependence. Wang (Wang and Qi, 2014) measured the factor bias of technological changes from different sources and found that research and development (R&D), import, Foreign Direct Investment (FDI) level spillover, and backward spillover were energy-saving. Zha et al. (2018) used the CES function to measure the technical bias between labor, capital, and energy, finding that technological changes favor energy use between energy and capital or between energy and labor. Xiu et al. (2019) used Ridge regression to measure the energy bias in Chinese technology changes, which show that technological changes favor energy use relative to capital and labor. Zhang et al. (2020) found that green biased technical change varies at both the input side and output side by employing the biased technical change theory and Malmquist index decomposition method in the Yangtze River Economical Belt. As the largest developing country in the world, China’s optimized energy structure path such as electric transition has played a referenced role for other developing countries. We try to provide some suggestions for China to improve energy transition by analyzing the elasticity substitution and directed technological change in internal and external transition.
In this article, we aim to solve two basic problems: first, we analyze whether the production activities in various regions are efficient. If there is inefficiency, then we study the dependent factors of the inefficiency. Second, we estimate the substitution elasticity and directed technological change in 30 regions so as to obtain the improvement pathway of energy transition. The fixed-effect SFA method meets the research purpose of this article, and it can effectively solve the above-mentioned problems and prevent heterogeneity among different provinces, while DEA cannot calculate the substitution elasticity and directed technological change. For the production function, there are many production functions including C-D and CES production functions that can calculate the technological progress bias of substitution elasticity in various regions. However, the translog function becomes our preferred model with an estimable and inclusive advantage. Therefore, according to Diamond (1965), the general form is as follows:
where
In practice, the stochastic frontier production function is widely approximated by a translog production as follows:
where
(1) Output (
(2) Capital (
(3) Traditional fossil energy (
(4) Clean energy power generation (
(5) Thermal power generation (
Regarding the influential factors of technical inefficiency, we selected the following four factors: R&D intensity
(1) R&D intensity
(2) Learning by exporting
(3) Foreign direct investment
(4) Regional structure: We measure the level of regional structure from two dimensions: the organic composition of capital and the proportion of fossil energy, which respectively reflect the regional endowment structure
(5) Labor productivity
According to Diamond (1965), we can further reveal the biased technical change for each pair of input factors with the following equation:
where n and q are two different production factors (including
For the biased technical change between clean energy power generation and thermal power generation, the following relationship is defined:
In the same vein, the biased technical change between clean energy power generation and traditional fossil energy is calculated by the following specification:
Similarly, the biased technical change between thermal power generation and traditional fossil energy is specified as follows:
where
The elasticity substitution of input factor is the core indicator to measure the strength of the substitution relationship between factors. Its initial definition was given by Hicks in “Wage Theory”. The factor substitution elasticity (when a given output is constant) is the percentage change in the factor ratio caused by the change in the marginal substitution rate. The elasticity of substitution is as follows:
Based on the available data, we selected panel data from 30 provinces in Mainland China from 2000 to 2017 as the research sample. The Tibet area is not included in the statistics due to incomplete data. In China, the “5-year plan” is an important part of China’s national economic plan. The data from 2000 to 2017 cover the end of the “9th Five-Year Plan” period, “10th Five-Year Plan” period, “11th Five-Year Plan” period, “12th Five-Year Plan” period, and the early stage of the “13th Five-Year Plan “. Therefore, the data we select are of wide statistical significance.
We obtain the data of traditional fossil energy including coal, oil, and natural gas from the district energy balance table in the China Energy Statistical Yearbook. The terminal consumption of coal, oil, and natural gas is adopted to prevent the impact of energy processing and conversion. The clean energy generation capacity is selected from hydro power, nuclear, wind, and solar technologies in the China Electric Power Yearbook. Restricted by the unavailability of data, hydro power and nuclear power data are from 2000 to 2017, and wind energy data are selected from 2006 to 2017. Solar energy data range from 2010 to 2017. The thermal power data come from the thermal power generation in the China Electric Power Yearbook. The units of all energy data are uniformly converted into tce according to the energy discount standard coal reference coefficient in the China Energy Statistical Yearbook. In order to eliminate the influence of inflation and other factors, the capital stock and GDP are deflated to the constant 2000 prices according to the price index and GDP index. Data such as capital stock, GDP, GDP index, and price index are from the China Statistical Yearbook. The descriptive statistics of the above-mentioned variables are shown in Table 1. The capital stock is calculated using the equation as follows:
where
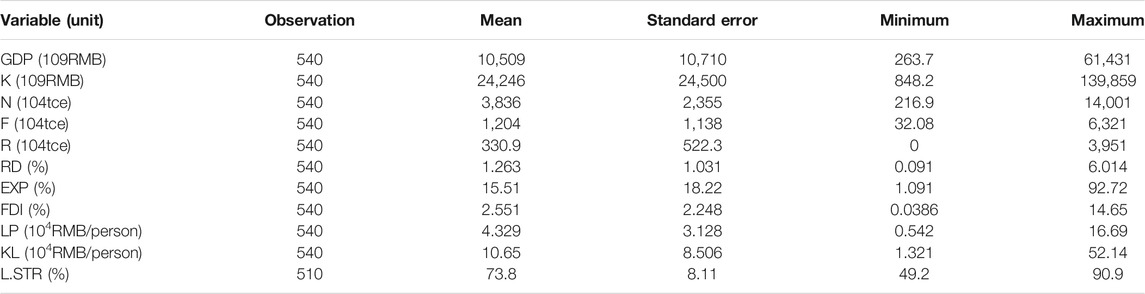
TABLE 1. Descriptive statistics of variables in the production function.
In order to test whether the model setting is correct, the following aspects should be tested successively. The results of specification tests of the production function are shown in Table 2.
(1) Whether the stochastic frontier model is applicable:
(2) Whether the C–D production function or the translog production function is more appropriate:
(3) Whether there is a technological progress in stochastic frontier production models:
(4) Whether the technical change is Hicks-neutral:

TABLE 2. Results of specification tests of the production function.
The results in Table 2 show that the LR statistic of the above test (2) is greater than the critical value of the mixed Chi-square distribution, indicating that the null hypothesis should be rejected. Therefore, it is more reasonable to use the translog production function. The results of test (3) and test (4) indicate that there are technical changes in the model, and this change is non-neutral. As shown in Table 3, the regression results show that
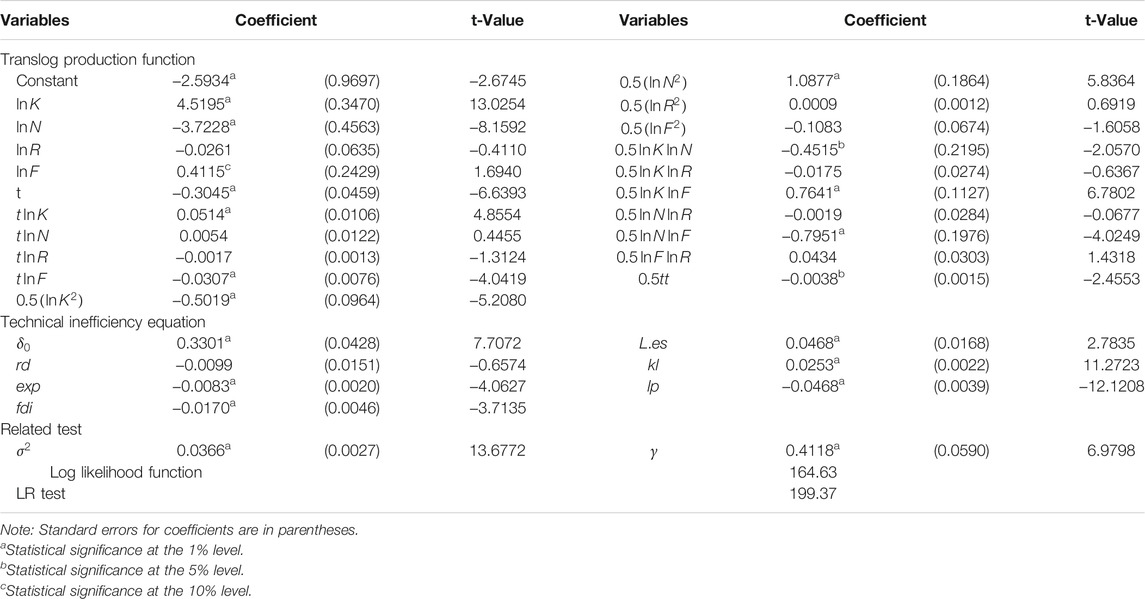
TABLE 3. Estimation results of the translog production function and the technical inefficiency equation.
Considering that local governments can determine the share of fossil energy,
For the determinants of the inefficient equation, although the coefficient of
The
The
The coefficient of
The coefficient of
The coefficient of
To discuss the biased technical changes in internal and external transition, we show the mean value of 2000–2017 in Table 4. Bias-NR and Bias-NF refer to the biased technical change in the external transition, while Bias-FR means the biased technical change in the internal transition.
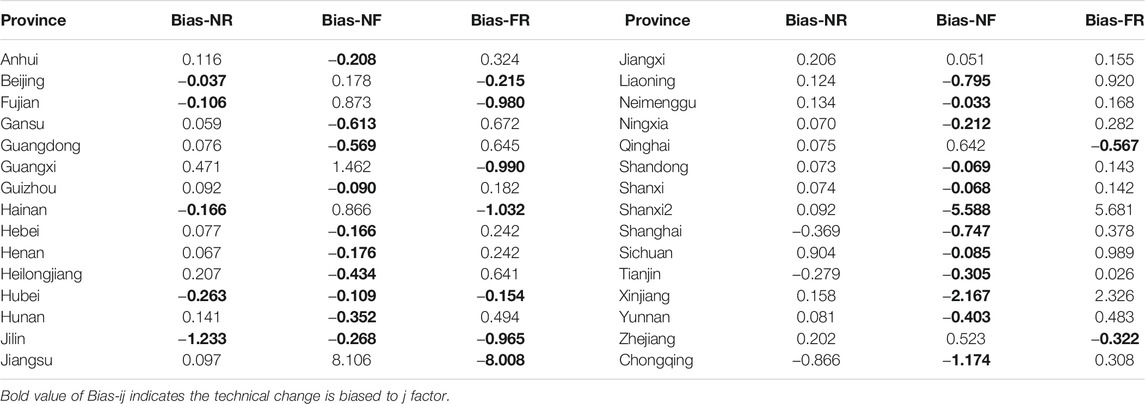
TABLE 4. Biased technical changes in internal and external electric transition.
In the external transition, for the pair of R and N, only eight provinces prefer to use clean energy, and the remaining 22 regions prefer to use traditional fossil energy. For the pair of F and N, 22 regions prefer thermal power generation, and the other eight provinces prefer traditional power generation. In the internal transition, technological changes are biased toward R in nine of the 30 provinces, while the remaining 21 provinces are biased F. This suggests that the government should continue to encourage producers to value clean production.
In addition, Table 5 shows the directed technical change bias order of the three input factors. In 20 of the 30 regions, the technical changes are more biased to thermal power generation, which is the first factor of the biased order for the 20 regions. However, only five regions are biased to clean energy generation. The production mode of the above eight provinces is relatively green and sustainable. It can be explained that the larger the production scale of renewable energy, the more advanced the corresponding level of renewable energy production technology is. For example, Hubei ranks the third largest in the renewable energy scale in China, so the renewable energy production technology in Hubei is relatively advanced. Five regions have more preference to traditional fossil energy, which is the first factor of biased order for 14 regions. Therefore, technological changes in these provinces tend to use traditional fossil energy rather than clean power generation or thermal power generation. Therefore, as a whole, the directed technical change in China is more biased to thermal power generation and deviated from clean energy generation.

TABLE 5. Factor-biased order of the technical change in 30 provinces.
However, technological changes in 18 regions deviate from clean energy generation, which is the last factor of the biased order for the 18 provinces in Table 5. In addition, technological changes in seven regions are more likely to deviate from thermal power generation, and technological changes in five regions are more likely to deviate from traditional fossil energy, which is the last factor of the bias order for the five regions. The above results show that overall, China’s provincial scope prefers to use thermal power over clean energy and traditional fossil energy. They are less inclined to use clean energy rather than thermal power or traditional fossil energy. On one hand, these results confirm the fact that the thermal power generation is popular in China. On the other hand, the results also show that the government departments should encourage the emphasis on clean production.
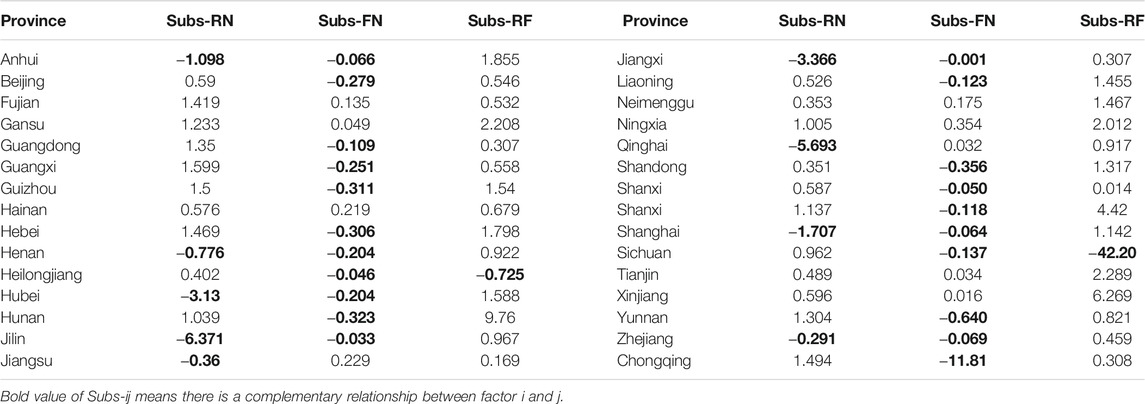
TABLE 6. Substitution elasticity in the internal and external electric transition.
Based on some studies (Hicks, 1932; Acemoglu et al., 2015; Fredriksson and Sauquet, 2017; Naqvi and Engelbert, 2017; Fried, 2018; Kha, 2019), the degree of factor bias of directed technology changes is determined by the price and scale effects. Adjusting the relative price will timely adjust the relative demand and actual input between factors in the production process and gradually reduce the difference in the marginal output growth rate of the two energy factors so as to change the degree of factor bias of directed technical changes between factors. Therefore, in the internal transition, the governments can adjust the technical change bias of the provinces by raising the price of thermal power generation or increasing the subsidies for clean energy power generation. In the external transition, the governments can adjust the energy policies of the province by increasing the carbon tax prices or increasing subsidies for clean energy power generation and low-coal thermal power generation. These changes will continue to alter the relative price between factors.
In Table 6, we list the substitution elasticities between factors in the 30 provinces. From the perspective of external transition, for the pair of F and N, there are only nine provinces with substitution relations, and the other 21 other regions have complementary relationships. The complementary relationship between F and N in most provinces can be explained by their need for more energy to meet production demand. In addition, there are complementary relationships between R and N in only nine regions, while the 21 remaining regions have substitution relationships. From the perspective of the internal electric transition, there is a complementary relationship between F and R in only two regions, and the other 28 regions all have substitution relations. It indicates that increased clean energy power generation can currently be used to reduce thermal power generation in these provinces. Although at the provincial level, different regions show an obvious difference in substitution elasticity, there is a substitution relationship between other energy factors except for traditional fossil generation and thermal power generation with a complementary relationship on a whole.
In the production process, the internal and external transition can be conducive to the green development and transformation. Therefore, we analyze three transition ways and study the improvement path of energy transition in different regions based on the degree of biased directed technical changes and the substitution elasticity between factors. The classification results of eight external transition pathways and three internal transition pathways are shown in Tables 7–9.

TABLE 7. Classification results of directed technical change and substitution elasticity between factors (traditional fossil energy vs. clean energy generation).

TABLE 8. Classification results of directed technical change and substitution elasticity between factors (traditional fossil energy vs. thermal power generation).

TABLE 9. Classification results of directed technical change and substitution elasticity between factors (thermal power generation vs. clean power generation).
First, the classification results between factor N and R are shown in Table 7. There are four production patterns according to the factor N and R. Among them, the ideal production mode shows Bias-NR<0 and Subs-NR>0. In this kind of production mode, these regions (Beijing, Fujian, Hainan, Tianjin, and Chongqing) are more inclined to use the clean energy power generation rather than use the traditional fossil energy. Increasing the use of clean energy power generation will reduce the use of fossil energy, which will help to promote the transformation of clean energy to traditional fossil energy.
The mode-like Bias-NR>0 and Subs-NR>0 suggests that the region prefers to use traditional fossil energy over clean energy. In addition, an increase in traditional fossil energy use would lead to a decline in the use of clean energy generation. For these areas, the directed technological change needs to be adjusted; Bias-NR<0 and Subs-NR<0 suggest that the region prefers the use of clean energy generation, and increasing the use of clean energy generation leads to the increased use of traditional fossil energy. These regions need to adjust the alternative relationship between the two energy sources; for areas with Bias-NR>0 and Subs-NR<0, the government needs to encourage technological changes inclined to use clean energy power generation and change the complementary relationship between clean energy power generation and traditional fossil energy.
Second, the classification results with four production patterns between F and N are shown in Table 8. The ideal production mode is Bias-NF<0 and Subs-NF>0. Areas that are in line with this production mode (Gansu, Neimenggu, Ningxia, Tianjin, and Xinjiang) are more inclined to use thermal power generation. When expanding the scale of production, they will increase the thermal power generation and reduce traditional fossil energy so as to promote the external transformation of thermal power generation to traditional fossil energy.
Finally, the classification results between F and R are shown in Table 9. The mode with Bias-FR>0 and Subs-FR>0 indicates that the province prefers thermal power to clean energy power generation, and there is an alternative relationship in the production process between clean energy power and thermal power. Therefore, the areas with the above mode prefer to use thermal power generation rather than clean energy generation, and the increase of thermal power generation use will lead to the decline of clean energy power generation. For these areas, the technical change needs to be adjusted between the two factors. Areas with Bias-FR>0 and Subs-FR<0 prefer thermal power generation rather than clean energy power generation. For these areas, technological change that is biased to clean energy power generation and use need to be encouraged, and the alternative relationship between thermal and clean energy power generation needs to be adjusted. The ideal production model shows Bias-FR<0 and Subs-FR>0, where the provinces (Beijing, Fujian, Guangxi, Hainan, Hubei, Jilin, Jiangsu, Qinghai, and Zhejiang) prefer the use of clean energy power generation rather than the use of thermal power generation. In addition, increasing the scale of the use of clean energy power generation can reduce the use of thermal power generation in these provinces.
Hence, in order to improve the external and internal electric transition, the Chinese governments should promote the reform of the market-oriented energy pricing mechanism according to characteristic transition modes in different regions. For the provinces with production patterns which can automatically benefit the energy transition, we suggest a moderate policy, while for the other provinces, we suggest a policy of energy price and tax. Moreover, for the enterprises, their production patterns are not easy to change. They usually benefit by minimizing costs under the conditions of homogeneous products and unchanged price. Therefore, the change of the inter-fule price will have an effect on the production costs and the structure of production factors, which improves the energy transition. Finally, the results from the analysis of China show that it is also possible for other countries to treat their energy transition differently due to their characteristic production patterns.
Promoting the internal and external electric transition is of great significance for China to achieve a green transformation. In this article, with capital, traditional fossil energy, clean energy, thermal power generation, and the GDP of the provinces, we built a stochastic production frontier model based on the translog production function, which measures the bias of directed technical changes and substitution elasticities of 30 provinces in mainland China from 2000 to 2017. Furthermore, we discuss the transition paths with three pairs of energy inputs in 30 provinces.
For all Chinese provinces, export learning, foreign direct investment, and labor productivity can significantly improve the technological efficiency, while increasing fossil energy consumption and capital deepening will have a negative impact on technological efficiency. In addition, there is no evidence that the original R&D activities can significantly improve the technical efficiency.
On the whole, the directed technical change in China is more biased to thermal power generation and deviated from clean energy generation. In addition, except for traditional fossil generation and thermal power generation with a complementary relationship, there is a substitution relationship between other energy factors.
At the provincial level, different regions show an obvious difference in substitution elasticity. It can be found that the technical change is biased to thermal power generation for 21 regions and there is a substitution relationship for 28 regions in internal electric transition. In addition, the technical change is biased to traditional fossil energy instead of clean energy generation for 22 provinces, and 21 regions have complementary relations between them. Moreover, the technical change is biased to thermal power generation instead of traditional fossil energy, and 21 regions have substitution relations between them.
Considering the differentiated production characteristics of different regions, the government should avoid promoting energy transition in accordance with unified policies. According to the directed technical change and substitution elasticity, the government needs to formulate and adopt differentiated improvement measures for energy transition. In the external electric transition, we recommend a relatively moderate adjustment policy for five regions conforming to the (Bias-NR < 0 mode, Subs-NR > 0) mode and five regions conforming to the (Bias-NF < 0, Subs-NF > 0) mode. In the internal transition, among the 30 provinces, nine regions present the production mode (Bias-FR < 0, Subs-FR > 0). For these provinces, we also recommend a laissez-faire or moderate adjustment policy as their internal transition can be automatically improved. However, for other regions, the biased order of technical change between energies can be changed through the price policy. To sum up, by adjusting the relative price between energies through reasonable fiscal and tax policies, it is expected to achieve the internal and external electric transition. The results of this study can be used for reference by almost all countries in the world. We suggest that the differentiated energy transition should be implemented according to the various production patterns in different regions. Although this research has made contributions, we do not provide specific technical support for China to adjust the technical change bias among different energy sources. This article may contribute to energy transition in various sectors or industries. We also modeled the translog production function under the external and internal electric transition which is significant in carbon emission reduction action.
The raw data supporting the conclusion of this article will be made available by the authors, without undue reservation.
GH: Conceptualization, methodology, software, data curation, writing—original draft. HS: Methodology, software, data curation, writing—original draft.
The authors declare that the research was conducted in the absence of any commercial or financial relationships that could be construed as a potential conflict of interest.
All claims expressed in this article are solely those of the authors and do not necessarily represent those of their affiliated organizations or those of the publisher, the editors, and the reviewers. Any product that may be evaluated in this article or claim that may be made by its manufacturer is not guaranteed or endorsed by the publisher.
Abumunshar, M., Aga, M., and Samour, A. (2020). Oil Price, Energy Consumption, and CO2 Emissions in Turkey. New Evidence from a Bootstrap ARDL Test. Energies 13, 5588. doi:10.3390/en13215588
Acemoglu, D., Akcigit, U., Hanley, D., and Kerr, W. R. (2015). Transition to Clean Technology [J]. Harv. Business Sch. Working Pap. 124 (1), 52–104. doi:10.1086/684511
Acemoglu, D., Aghion, P., Bursztyn, L., and Hemous, D. (2012). The Environment and Directed Technical Change. Am. Econ. Rev. 102 (1), 131–166. doi:10.1257/aer.102.1.131
Aghion, P., Dechezleprêtre, A., Hémous, D., Martin, R., and Van Reenen, J. (2016). Carbon Taxes, Path Dependency, and Directed Technical Change: Evidence from the Auto Industry. J. Polit. Economy 124 (1), 1–51. doi:10.1086/684581
Alataş, S. (2020). Towards a Carbon-Neutral Economy: The Dynamics of Factor Substitution in Germany. Environ. Sci. Pollut. Res. Int. 27 (8), 26554–26569. doi:10.1007/s11356-020-08955-2
Alataş, S., Karakaya, E., and Hiçyılmaz, B. (2021). What Does Input Substitution Tell Us in Helping Decarbonization and Dematerialization? Industry Level Analysis for South Korea. Sustainable Prod. Consumption 27, 411–424. doi:10.1016/j.spc.2020.11.015
Altarhouni, A., Danju, D., and Samour, A. (2021). Insurance Market Development, Energy Consumption, and Turkey's CO2 Emissions. New Perspectives from a Bootstrap ARDL Test. Energies 14, 7830. doi:10.3390/en14237830
Bello, M. O., Solarin, S. A., and Yen, Y. Y. (2018). Hydropower and Potential for Interfuel Substitution: The Case of Electricity Sector in Malaysia. Energy 151, 966–983. doi:10.1016/j.energy.2018.03.055
China Statistical Yearbook (2020). China Statistical Yearbook [M]. Beijing, China: China Statistics Press.
Clerides, S. K., Lach, S., and Tybout, J. R. (1998). Is Learning by Exporting Important? Micro-dynamic Evidence from Colombia, Mexico, and Morocco. Q. J. Econ. 113 (3), 903–947. doi:10.1162/003355398555784
Costantini, V., Crespi, F., and Paglialunga, E. (2019). Capital-energy Substitutability in Manufacturing Sectors: Methodological and Policy Implications. Eurasian Bus Rev. 9 (2), 157–182. doi:10.1007/s40821-018-0114-z
Diamond, P. A. (1965). Disembodied Technical Change in a Two-Sector Model. Rev. Econ. Stud. 32 (2), 161–168. doi:10.2307/2296060
Fan, M., and Zheng, H. (2019). The Impact of Factor price Changes and Technological Progress on the Energy Intensity of China's Industries: Kalman Filter-Based Econometric Method. Struct. Change Econ. Dyn. 49, 340–353. doi:10.1016/j.strueco.2018.11.004
Fredriksson, P. G., and Sauquet, A. (2017). Does Legal System Matter for Directed Technical Change? Evidence from the Auto Industry [J]. Appl. Econ. Lett. 24, 1–4. doi:10.1080/13504851.2016.1254334
Fried, S. (2018). Climate Policy and Innovation: A Quantitative Macroeconomic Analysis. Am. Econ. J. Macroeconomics 10 (1), 90–118. doi:10.1257/mac.20150289
Hao, Y., and Huang, Y.-N. (2018). Exploring the Nexus of Energy Consumption Structure and CO2 Emissions in China: Empirical Evidence Based on the Translog Production Function. Pol. J. Environ. Stud. 27 (6), 2541–2551. doi:10.15244/pjoes/81071
Jiang, Z., Lyu, P., Ye, L., and Zhou, Y. W. (2020). Green Innovation Transformation, Economic Sustainability and Energy Consumption during China's New normal Stage. J. Clean. Prod. 273, 123044. doi:10.1016/j.jclepro.2020.123044
Kha, B. (2019). How to Accelerate green Technology Diffusion? Directed Technological Change in the Presence of Coevolving Absorptive Capacity [J]. Energ. Econ. 85, 104565. doi:10.1016/j.eneco.2019.104565
Khalid, W., and Jalil, A. (2019). An Econometric Analysis of Inter-fuel Substitution in Energy Sector of Pakistan. Environ. Sci. Pollut. Res. 26 (17), 17021–17031. doi:10.1007/s11356-019-05014-3
Kim, J., and Heo, E. (2013). Asymmetric Substitutability between Energy and Capital: Evidence from the Manufacturing Sectors in 10 OECD Countries. Energ. Econ. 40 (2), 81–89. doi:10.1016/j.eneco.2013.06.014
Li, C. (2010). Whether There Is a "productivity Paradox" of Chinese export Enterprises: a Test Based on the Data of Chinese Manufacturing Enterprises [J]. The World Economy 33 (07), 64–81.
Lin, B., and Abudu, H. (2019). Changes in Energy Intensity during the Development Process:Evidence in Sub-saharan Africa and Policy Implications [J]. Energy 183, 15657. doi:10.1016/j.energy.2019.06.174
Lin, B., and Agyeman, S. (2020). Impact of Natural Gas Consumption on Sub-saharan Africa's CO2 Emissions: Evidence and Policy Perspective. Sci. Total Environ. 760 (1), 143321. doi:10.1016/j.scitotenv.2020.143321
Lin, B., and Abudu, H. (2020). Can Energy Conservation and Substitution Mitigate CO2 Emissions in Electricity Generation? Evidence from Middle East and North Africa. J. Environ. Manage. 275, 111222. doi:10.1016/j.jenvman.2020.111222
Lin, B., and Ankrah, I. (2019b). On Nigeria's Renewable Energy Program: Examining the Effectiveness, Substitution Potential, and the Impact on National Output. Energy 167, 1181–1193. doi:10.1016/j.energy.2018.11.031
Lin, B., and Ankrah, I. (2019a). Renewable Energy (Electricity) Development in Ghana: Observations, Concerns, Substitution Possibilities, and Implications for the Economy. J. Clean. Prod. 233, 1396–1409. doi:10.1016/j.jclepro.2019.06.163
Lin, B., and Chen, X. (2020). How Technological Progress Affects Input Substitution and Energy Efficiency in China: A Case of the Non-ferrous Metals Industry. Energy 206, 118152. doi:10.1016/j.energy.2020.118152
Lin, B., and Raza, M. Y. (2021). Fuels Substitution Possibilities and the Technical Progress in Pakistan's Agriculture Sector. J. Clean. Prod. 314, 128021. doi:10.1016/j.jclepro.2021.128021
Liu, K., Bai, H., Yin, S., and Lin, B. (2018). Factor Substitution and Decomposition of Carbon Intensity in China's Heavy Industry. Energy 145, 582–591. doi:10.1016/j.energy.2017.12.151
Liu, P., and Wang, Z. (2019). Is China's "energy Transformation" Reasonable? Empirical Study of the Energy Substitution-Complementary Relationship [J]. China Soft Sci. 34 (08), 14–30.
Malikov, E., Sun, K., and Kumbhakar, S. C. (2018). Nonparametric Estimates of the Clean and Dirty Energy Substitutability. Econ. Lett. 168, 118–122. doi:10.1016/j.econlet.2018.04.017
Naeem, M. K., Anwar, S., and Nasreen, S. (2021). Empirical Analysis of CO2 Emissions and Sustainable Use of Energy Sources in Pakistan. Environ. Sci. Pollut. Res. Int. 28, 16420–16433. doi:10.1007/s11356-020-11927-1
Naqvi, S., and Engelbert, S. (2017). Directed Technological Change in a post-Keynesian Ecological Macromodel [J]. Ecol. Econ. Pap. 154, 168–188. doi:10.1016/j.ecolecon.2018.07.008
Ouyang, X., Zhuang, W., and Du, G. (2018). Output Elasticities and Inter-factor Substitution: Empirical Evidence from the Transportation Sector of Shanghai. J. Clean. Prod. 202 (20), 969–979. doi:10.1016/j.jclepro.2018.08.188
Popp, D. (2002). Induced Innovation and Energy Prices. Am. Econ. Rev. 92 (1), 160–180. doi:10.1257/000282802760015658
Raza, M. Y., Liu, X., and Lin, B. (2020). Cleaner Production of Pakistan's Chemical Industry: Perspectives of Energy Conservation and Emissions Reduction [J]. J. Clean. Prod. 278 (1), 123888. doi:10.1016/j.jclepro.2020.123888
Samour, A., Baskaya, M. M., and Tursoy, T. (2022). The Impact of Financial Development and FDI on Renewable Energy in the UAE: A Path towards Sustainable Development. Sustainability 14, 1208. doi:10.3390/su14031208
Shan, H. (2008). Reestimation of China's Capital Stock K: 1952-2006 [J]. Quantitative Econ. Tech. Econ. Res. 25 (10), 17–31. doi:10.13653/j.cnki.jqte.2008.10.003
Shao, S., Luan, R., Yang, Z., and Li, C. (2016). Does Directed Technological Change Get Greener: Empirical Evidence from Shanghai's Industrial green Development Transformation. Ecol. indicators 69, 758–770. doi:10.1016/j.ecolind.2016.04.050
Solarin, S. A., and Bello, M. O. (2019). Interfuel Substitution, Biomass Consumption, Economic Growth, and Sustainable Development: Evidence from Brazil. J. Clean. Prod. 211, 1357–1366. doi:10.1016/j.jclepro.2018.11.268
Tu, Z., and Leeke, L. (2011). Considering Energy, Environmental Factors for Chinese Industrial Efficiency Evaluation —— Provincial Data Analysis Based on SBM Model [J]. Econ. Rev. 32 (2), 55–65. doi:10.19361/j.er.2011.02.007
Tu, Z. (2008). Coordination of Environmental, Resources and Industrial Growth [J]. Econ. Res. 54 (02), 93–105.
Wang, B., and Qi, S. (2014). Biased Technological Progress, Factor Substitution and China's Industrial Energy Strength [J]. Econ. Res. 49 (02), 115–127.
Wang, F., and Feng, G. (2011). Assessment of the Contribution Potential of Optimizing the Energy Structure to Achieving China's Carbon Intensity Targets [J]. China's Ind. economy 29 (04), 127–137. doi:10.19581/j.cnki.ciejournal.2011.04.013
Wang, Y. (1997). An Empirical Analysis of Foreign Direct Investment and China's Industrial Development, the Internal Discussion Draft of China Economic Research Center. Beijing, China: Peking University.
Wang, Y. S. (2021). Reseaech on Energy Substitution in Chinses Industrial Sectors Besed on Linear Logit Model [J]. Fresenius Environ. Bull. 20 (7), 8777–8785.
Wei, Z., Han, B., Han, L., and Shi, Y. (2019). Factor Substitution, Diversified Sources on Biased Technological Progress and Decomposition of Energy Intensity in China's High-Tech Industry. J. Clean. Prod. 231, 87–97. doi:10.1016/j.jclepro.2019.05.223
Wesseh, P. K., and Lin, B. (2016). Output and Substitution Elasticities of Energy and Implications for Renewable Energy Expansion in the ECOWAS Region. Energy Policy 89 (2), 125–137. doi:10.1016/j.enpol.2015.11.007
Wu, H., Hao, Y., and Ren, S. (2020). How Do Environmental Regulation and Environmental Decentralization Affect green Total Factor Energy Efficiency: Evidence from China. Energ. Econ. 91, 104880. doi:10.1016/j.eneco.2020.104880
Xiu, J., Zhang, G.-x., and Hu, Y. (2019). Which Kind of Directed Technical Change Does China's Economy Have? from the Perspective of Energy-Saving and Low-Carbon. J. Clean. Prod. 233, 160–168. doi:10.1016/j.jclepro.2019.05.296
Xu, S.-C., He, Z.-X., and Long, R.-Y. (2014). Factors that Influence Carbon Emissions Due to Energy Consumption in China: Decomposition Analysis Using LMDI. Appl. Energ. 127, 182–193. doi:10.1016/j.apenergy.2014.03.093
Yang, Z., Shao, S., Yang, L., and Miao, Z. (2018). Improvement Pathway of Energy Consumption Structure in China's Industrial Sector: From the Perspective of Directed Technical Change. Energ. Econ. 72, 166–176. doi:10.1016/j.eneco.2018.04.003
Yao, Y., and Zhang, Q. (2001). Analysis of Technical Efficiency of Chinese Industrial Enterprises [J]. Econ. Res. 47 (10), 13–19. + 28-95.
Yazan, Q., Samour, A., and Mohammed, A. (2022). Does the Real Estate Market and Renewable Energy Induce Carbon Dioxide Emissions? Novel Evidence from Turkey [J]. Energies 15, 763. doi:10.3390/en15030763
Ye, X., and Zhou, S. (2011). Technological Innovation, Return Effect and Energy Efficiency of China's Industrial Industry [J]. Finance and trade economy 32 (01), 116–121. doi:10.19795/j.cnki.cn11-1166/f.2011.01.017
Zha, D., Kavuri, A. S., and Si, S. (2018). Energy-biased Technical Change in the Chinese Industrial Sector with CES Production Functions. Energy 148, 896–903. doi:10.1016/j.energy.2017.11.087
Zha, D., Si, J., Zhou, T., and Xue, C. (2016). Energy and Nonenergy Alternative Elasticity Study in Chinese Industrial Sector —— Is Based on Multi-Elastic Measure Method [J]. Manage. Rev. 28 (06), 180–191. doi:10.14120/j.cnki.cn11-5057/f.2016.06.018
Zhang, X., Sun, F., Wang, H., and Qu, Y. (2020). Green Biased Technical Change in Terms of Industrial Water Resources in China's Yangtze River Economic Belt. Int. J. Environ. Res. Public Health. 17 (8), 2789. doi:10.3390/ijerph17082789
Zhang, Y., Ji, Q., and Fan, Y. (2018). The price and Income Elasticity of China's Natural Gas Demand: A Multi-Sectoral Perspective. Energy Policy 113, 332–341. doi:10.1016/j.enpol.2017.11.014
Keywords: energy consumption structure, energy transition, interfule substitution, directed technical change, economic growth
Citation: Hou G and Song H (2022) Improvement Pathway of Energy Transition: From the Perspective of Directed Technical Change. Front. Energy Res. 10:873324. doi: 10.3389/fenrg.2022.873324
Received: 10 February 2022; Accepted: 28 February 2022;
Published: 28 March 2022.
Edited by:
Diogo Ferraz, Universidade Federal de Ouro Preto, BrazilReviewed by:
Ahmed Samour, Near East University, CyprusCopyright © 2022 Hou and Song. This is an open-access article distributed under the terms of the Creative Commons Attribution License (CC BY). The use, distribution or reproduction in other forums is permitted, provided the original author(s) and the copyright owner(s) are credited and that the original publication in this journal is cited, in accordance with accepted academic practice. No use, distribution or reproduction is permitted which does not comply with these terms.
*Correspondence: Guisheng Hou, MjQzNDgzNTA4MEBxcS5jb20=
Disclaimer: All claims expressed in this article are solely those of the authors and do not necessarily represent those of their affiliated organizations, or those of the publisher, the editors and the reviewers. Any product that may be evaluated in this article or claim that may be made by its manufacturer is not guaranteed or endorsed by the publisher.
Research integrity at Frontiers
Learn more about the work of our research integrity team to safeguard the quality of each article we publish.