Abstract
The models designed to evaluate the performance of photovoltaic (PV) cells depend on classical thermal principles with the use of constant optical coefficients (reflectance, absorbance, and transmittance). However, these optical coefficients depend on incident angle actually and, hence, are a function of the inclination and orientation of the PV panel along with the geographical location and time of the day. In this study, varying coefficients (optical thermal model) and constant coefficient (classical thermal model) with incident angle in the energy balance equations followed by experimental validation were considered. First, the incident angle of direct radiation on the PV panel was determined with the help of astronomic simplified calculations, and second, the optical coefficients were evaluated by using principles of classical electromagnetic theory. Third, the energy balance equations were expressed in the form of differential equations and solved numerically by the Runge–Kutta method to obtain the electrical power as a function of time. Finally, electrical power produced by the optical–thermal model and classical thermal model was validated against experimental data for the solar PV system installed at the Central Station, Punjab Emergency Service. The results show that there is significant agreement between the classical thermal model and experimentally produced electricity throughout the year which validates the modeling.
1 Introduction
The importance of energy in the development of human beings cannot be denied. Even some experts used consumption of energy to assess the economic development (Rafindadi and Ozturk, 2015; Rafindadi and Ozturk, 2016; Rafindadi and Ozturk, 2017; Rafindadi and Mika'Ilu, 2019). The recent developments in all areas and inventions during the last century have caused a substantial increase in the consumption of energy, mainly from sources of fossil fuels. This intensification of fossil fuel consumption is the primary cause of contaminated and greenhouse gaseous emissions, including CO2 as a major component causing the severe environmental impact (Rafindadi, 2016a; Rafindadi, 2016b; Al-Dhaifallah et al., 2018; Nassef et al., 2018a; Nassef et al., 2019b; Mohamed et al., 2019). The shrinking of fossil fuel reserves and increasing prices have led to the search for non-pollutant, cheap, environment-friendly, and sustainable energy alternatives for replacement (Neves et al., 2018; Rafindadi et al., 2018; Ren et al., 2018; Rezk et al., 2019). Consequently, more attention by experts was paid on renewable energy sources (RESs) because they are cheaper, environment-friendly, easily accessible, and more importantly sustainable when compared to fossil fuels (Diab et al., 2015; Gomaa et al., 2018; Khan et al., 2018; Tahir et al., 2021). That is why, managements are urged to modify their interests and directions to RESs such as solar energy, wind energy, geothermal heat, hydropower, tidal energy, and biofuels (Ghenai and Janajreh, 2016; Mohamed et al., 2017; Abdelkareem et al., 2018; Abdelkareem et al., 2019; Inayat et al., 2019; Sayed et al., 2019). Simultaneously, a lot of efforts have been put to minimize the energy consumption with optimum usage of the existing resources. Cuce et al. (2019) proved that low/zero energy building may be developed effectively by a biometric strategy which is an operational approach, and a 15.7% reduction in annual energy consumption with the usage of an atrium in a small house was reported by Sher et al. (2019). Furthermore, a rapid growth was seen in the development of fuel-cells and photovoltaic (PV) modules as emergent technologies for collecting energy which then was launched very successfully in the market (Nassef et al., 2019a; Poompavai and Kowsalya, 2019; Ghenai et al., 2020).
Solar energy is available in abundant form and it is a sustainable, clean, and promising energy source for electricity generation. It is believed by many researchers that solar energy will replace fossil fuels in a very short time because of non-polluting and maintenance-free resource that is implementable with ease in numerous applications (Shukla et al., 2016a). The generation of solar photovoltaic (PV) power is one of the major applications. Moreover, the world is showing attention toward hybrid systems of photovoltaic and thermal energy, which is also an advancement toward pollution-free environment. The solar photovoltaic systems being the cheapest ones than other renewable energy resources are widely used as integrated systems with other electricity production systems. Solar energy using PV cells is an extensively used technology for electricity production in numerous countries around the world. Solar energy becomes the ultimate choice, particularly with the persistent variation in supply by grid electricity (Zeyringer et al., 2015). There are numerous arrangements of photovoltaic systems in use: stand-alone photovoltaic systems are also called off-grid PV systems, and grid-connected PV systems are also called on-grid PV systems (Menconi et al., 2016).
The addition of a PV system into a well-designed building can allow self-production of electricity (Shukla et al., 2017), and the system can support the electricity-grid by supplying surplus electricity produced, particularly in the peak demand season of summer because of the usage of air conditioners (Lau et al., 2016). This will also support in the reduction of weather and ecological effects. However, for feasibility of a solar PV system, there must be sufficient solar irradiance during the complete year. The performance of a PV solar system strongly depends on many factors of the environment such as solar irradiance, humidity, wind speed, and temperature (Shukla et al., 2016b). For uninterrupted supply throughout the year, it is very important that a PV system must be properly installed with optimal dimensions. This needs a comprehensive study for the selection of the best choice, the most effective and at very economical cost. In addition, the PV solar system is categorized with different performance constraints such as energy yield, ambient temperature, and performance ratio. There are many studies available in the literature on performance investigation of the PV system. The forecasting of solar data is an important tool for the prediction of output parameters of PV commercial projects (Tahir et al., 2020). Khatib et al. (2013) demonstrated that the highest output of PV solar systems is highly dependent on meteorological parameters such as solar radiation, wind speed, humidity in air, and temperature. So, keeping in view the significance, it is highly recommended to conduct a comprehensive investigation at many sites for suitable selection. The modeling and feasibility of a PV solar system at the selected location are to be evaluated before actual execution. The evaluation can easily be worked on many software available in the market, and the results are very useful for the selection of the best suited model for executing the same in the field.
This study aims to predict the performance of solar PV cells with experimental validation of numerical models for performance evaluation of solar PV cells. Moreover, a comparison of electricity generation is also performed between variable optical coefficients (obtained at different geographical locations, orientation of solar cells, and inclination of variable 1 m2 of the PV panel) and constant optical coefficients to evaluate the effect of varying optical coefficients on the performance of the PV panel. The novelty of this study lies in the investigation of the impact of climate conditions on Jhang city (31.2781o N and 72.3317o E) in Pakistan. There are four seasons in Pakistan throughout the year, and the climate keeps changing due to seasonal behavior. Pakistan has been selected as the location for this research work, and it is divided into different regions according to climatic conditions (Nicol et al., 1999). The methodology adopted and the outcomes of this study can be used by researchers, experts, and policy-makers.
2 Data Collection
The solar irradiation and weather data were collected from Pakistan Metrological Department, Lahore for a period of 2 years (2016–2018) for Jhang, Pakistan (Sharma and Goel, 2017). In the present analysis, the monthly average data were used to predict the performance of the PV panel in Jhang, Pakistan for a period of 1 year (2016–17) as presented in Figures 1A,B.
FIGURE 1

One-year (2016–17) solar and weather data for Jhang, Pakistan. (A) Monthly average global horizontal irradiance. (B) Monthly average dry bulb temperature.
2.1 Experimental Data
The experimental data were collected from a solar PV system which was installed at the Central Station, Punjab Emergency Service, Rescue 1122, Faisalabad Road, Jhang. The monthly variations in energy production by the installed solar PV system are shown in Figure 2. It is observed that a solar PV system generates a maximum and minimum amount of energy in May (16.63 kWh) and December (7.80 kWh), respectively, because of the amount of solar irradiance falling on the surface of the cell.
FIGURE 2
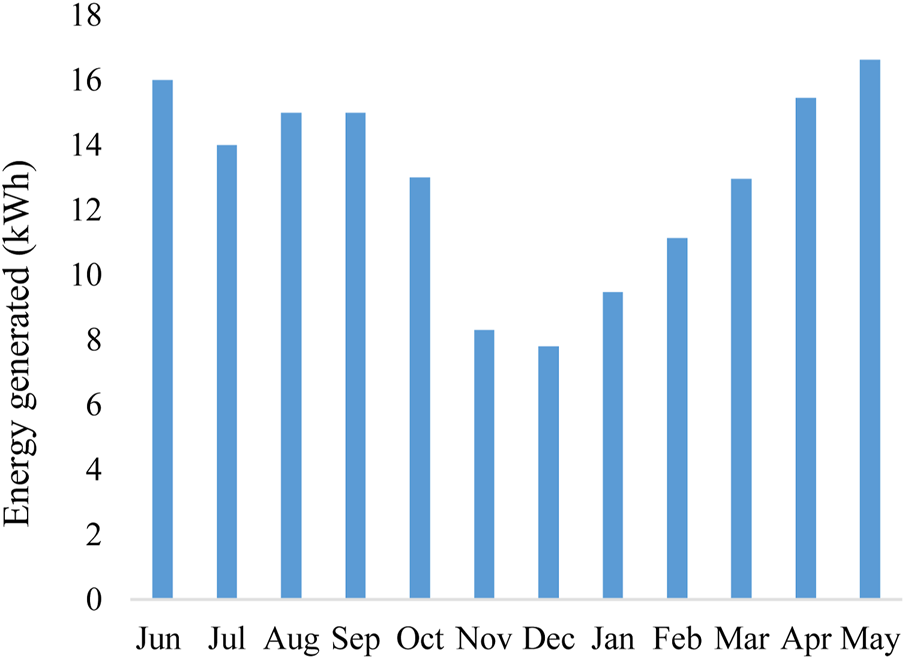
Actual PV energy production from June 2016 to May 2017.
3 Materials and Methods
3.1 Numerical Modeling
In the present study, a numerical model was developed on MATLAB using differential equations and the Runge-Kutta method to describe the energy production by a standard configured PV cell.
To make the analysis simpler and easier, the following assumptions were taken into account.
• Unpolarized incident and diffused solar radiations
• Uniform temperature inside each layer of the PV cell
• Zero heat capacity for ARC (antireflection coating) and silicon layer
• Negligible side thermal exchanges of the PV cell
• Natural convection heat transfer
Since the solar PV panel consists of five different layers (exterior glass, ethylene vinyl acetate, antireflexive coating, PV cells, and Tedlar) as presented in Figure 3, the energy balance equations were developed considering the conduction and convection heat transfer between layers and with the surrounding. As the facet effects of rims of PV cells were not considered; therefore, it is most effective to consider the unit surface area of the cell. The differential equations were explicated in the form of temperature change of the layers beyond regular time assuming the isothermal conditions in each layer.
FIGURE 3
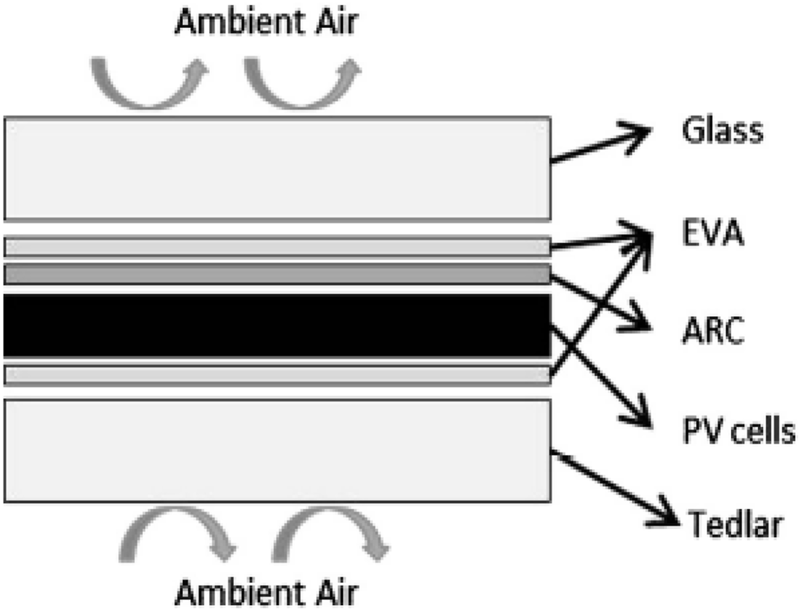
Six layers of a modeled PV cell.
The energy balance equation for each layer can be represented as Eq. 1.
In Eq. 1, i represents the number of that layer for which the energy exchange is being analyzed, and it varies between 1 and 6. The energy exchange is the heat transfer between different layers of PV cells and with the surrounding air.
3.1.1 Energy Balance for the Exterior Glass
The energy balance for the exterior glass of a solar PV cell can be represented by Eq. 2.where represents the sun rays absorbed by the glass and can be calculated by Eq. 3.
In Eq. 4, the term and epitomize the thermal conductivity of the medium across the layers and traveled distance by flux, respectively. As represented, each layer via a factor placed within the layer’s center and each layer temperature is supposed to be unvarying, the resistance of conduction is given as Eq. 5.
It is assumed here that the temperature gradient between the two faces of the interface is zero.
In this research, we consider the natural convection between the layer of glass and surrounding air only, written as Eq. 6.
For the sake of simplicity of the calculations, the minor temperature difference between the surface externally and the middle of the glass was ignored in comparison to the temperature difference .
The free convective coefficient of exchange is expressed by Holman (Edalati et al., 2015).
Radiation heat transfer through a long route is given by Stefan–Boltzmann regulation [46].
It is assumed here that both the sky and ground react as blackbodies in Eq. 8. It needs to be well-known that for middle IR (λ= 7–14 μm), εglass is nearly 1.
As it is evident that the PV panel is not completely open to the ground and the sky, for this reason, the radiation contacts between the sky and the panel and between the ground and the solar panel need to be in agreement with the use of the sky view factors Fsky and the ground view factor Fground. Fsky is described as the hemispherical portion of the unhindered sky, and the same is considered with the use of the analogical method of Nusselt (Rakovec et al., 2011).
In Eq. 9, s is the panel inclination. Ground-view factor is calculated from Eq. 10.
For the temperature of the sky Tsky, in the available works, there are many terms that were deduced for approximating it (Notton, Cristofari et al., 2005). In this research study, the formulation was developed by Schott (1985).
The temperature of the ground is assumed to be equal to ambient temperature (Schott, 1985).
3.1.2 Energy Balance for Upper EVA (EVA 1)
The energy balance for the ethylene vinyl acetate (EVA) first layer of the PV panel can be represented by Eq. 13.
The term related to absorption expresses that the EVA layer has absorbed the energy as the radiation has been absorbed through the surface of the glass and can be calculated by Eq. 14.
The conduction between the ARC and EVA is expressed as given in Eq. 15 and Eq. (16).
3.1.3 Energy Balance for the ARC Layer
The anti–reflection coating layer is used to avoid the reflection process of solar rays in solar cells to increase their output and can be represented by Eq. 17.
The rays absorbed and conducted by the ARC layer can be calculated by Eq. 18 and Eq. (19), respectively.
3.1.4 Energy Balance for the Semiconductor Layer
The energy balance for the semiconductor layer of the PV panel can be represented by Eq. 21
The electricity is defined as the efficiency function of the panel and irradiance striking on the silicon layer, Eq. 24.
The efficiency of the panel varies with the changes in the temperature and with the incident radiations and may be described by the subsequent expression (Evans, 1981), Eq. 25.
In Eq. 25, β0 is the coefficient of temperature, γ0 is the coefficient of solar radiation, and ηSTC is the efficiency of the panel at standard conditions. The PV panel characteristics used in this research work are standard efficiency (0.125), temperature coefficient (0.004 K−1), and coefficient of solar radiation (W−1m2); these characteristic values are available in Ref. (Schott, 1985).
3.1.5 Energy Balance for the Back-EVA Layer (EVA 2)
The silicon layer absorbs most irradiance, so solar irradiance absorption in the Tedlar layer and EVA-2 is neglected. The energy balance for the back-EVA layer can be represented by Eq. 26, and conduction through this layer can be calculated using Eq. 27.
3.1.6 Equation for Tedlar-Based Back Sheet
Only natural convection by temperature difference is considered for the Tedlar layer and environment on the same pattern of the front glass layer.
Exchange of the irradiance for the Tedlar layer and view factors are expressed by using the previous approach as Eq. 32.
The properties of the material constituting the layers are mentioned in Table 1, taken From Refs. (Armstrong and Hurley, 2010; Sharma and Goel, 2017).
TABLE 1
| Material of the panel | Material properties | Optical properties [61] | Constant optical coefficients | ||||||
|---|---|---|---|---|---|---|---|---|---|
| Thermal conductivity (Wm−1K−1) | Density (Kgm−3) | Specific heat capacity (JKg−1K−1) | Emissivity | Absorption coefficient (m−1) | Refractive index | Material reflectance | Material transmittance | Material absorbance | |
| Glass | 1.8 | 2700 | 750 | 0.9 | 4.41 | 1.52 | 0.040 | 0.950 | 0.010 |
| EVA | 0.35 | 960 | 2090 | - | 54.9 | 1.45 | 0.000 | 0.970 | 0.030 |
| ARC | 32 | 2400 | 691 | - | 120 | 2.30 | 0.030 | 0.970 | 0.000 |
| Silicon | 49 | 2300 | 836 | - | 1.10*106 | 3.69 | 0.070 | 0.000 | 0.930 |
| Tedlar | 0.35 | 1370 | 1760 | 0.9 | - | - | - | - | - |
Material properties, optical properties, and constant optical coefficients for different materials of PV panels.
3.2 Optical Phenomena and Optical Coefficients
Solar flux propagation through the solar panel is analyzed by calculating the reflection, absorption, and transmission in every layer of the panel as shown in Figure 4. As the solar radiation moves through the front surface of the glass, a portion of the radiation is reflected, and the other portion infiltrates and passes through the glass. As the irradiance passes through the glass, some of the irradiances are passed through the glass, whereas some are captured by it. The irradiance which has the capability to pass through the boundary of glass reaches to the lower boundary of the glass, and from there it is transferred to the next medium. In general, constant values of optical coefficients are used for evaluating the PV models. However, these coefficients are not constant and depend upon a number of parameters including the incident angle. The constant optical coefficients for different materials used in this study are presented in Table 1. The optical constant coefficients correspond to conditions in which the angle of incidence of irradiance is zero (θ = 0).
FIGURE 4
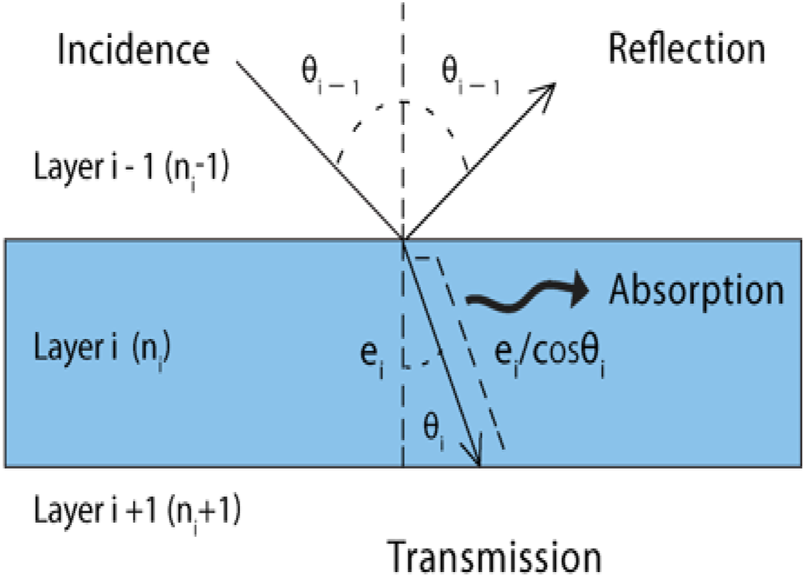
Optical phenomenon of irradiance.
3.2.1 Incident Angle Calculations
Solar radiation’s incident angle is defined as the angle of incident irradiance which it makes perpendicular to the surface of the panel at the point where radiation strikes.
The following astronomic formula is used for estimating the cosine of the incident angle (θ) at every fraction of the time in the entire day (Beckman and Duffie, 1974), Eq. 34.
The δ is the declination of the sun, represents the latitude, ω is used for the hour angle, s shows the inclination angle, and φ is here for the PV panel azimuthal angle.
The declination of the sun (δ) fluctuates every day of the whole year (J), and in spring it is zero. In the literature, there are many formulae deduced for this cause, but in this research study, Eq. 35 was used.
The time equation E is the development of the meantime as compared to the sun time. The “Institut de mécanique celeste et de calcul des ephemerides” (IMCCE) prints every 12 months the “Guide des données astronomiques” (Le Lay, 2021), which may be used to give the maximum accurate formulation for the equation of time for the period 1900–2100 with minimal error. This complicated formula simplified for length 2013–2023 is deduced to Eq. 36. The equation of time is widely used in different applications regarding solar energy (sundials and similar devices). Different machines such as solar trackers and heliostats move in a pattern that is influenced by the time equation to obtain maximum output.
3.2.2 Transmittance, Reflectance, and Absorbance Calculation
The angle of refraction is derived by the Snell–Descartes regulation as Eq. 37.
After calculating these angles, the fraction of reflectance on the layer may be evaluated by Fresnel’s formula. The reflectance corresponding to perpendicular and parallel separation is assumed by the following equations (Lu and Yao 2007).
Thus, the fraction of irradiance propagating over the layer i is given by Eq. 41.
The transmitted portion keeps moving through the medium and is continuously absorbed. The Beer–Lambert law is used to express this attenuation:
In Eq. 42, a is the absorption coefficient, which is also called as linear attenuation coefficient and is restrained in m−1. This coefficient is material type–dependent and changes with the change in wavelength. L is the measurement of traveled distance that the solar radiation covers as it passes over the material and is expressed as
The transmittance of solar irradiation in the layer i is given as Eq. 44.
The absorbed irradiance fraction in the ith layer is derived by the conservation of energy.
Numerous models are available in the literature regarding several reflections (Lu and Yao 2007). The ending result for the evaluation of reflectance was obtained by the addition of countless series. Only the first term was considered for the sake of simplicity. A lower value of the absorption in comparison to the actual, in the occasion of numerous reflections, was calculated, though this additional absorbed energy is very less (less than 0.2% of the total energy which also reflects).
For the intention of optical coefficients, information on panel material properties including the absorption coefficient 1) and the refractive index (n) is also required along with the incident and refractive angles. The value of the refractive indexes was taken as a constant in many studies (Lu and Yao, 2007). In this research study, the constant values from the research of Krauter and Hanitsch were used. However, the refractive indexes of the material change along with the wavelength of radiation (Mertin, Hody-Le Caer et al., 2014).
The coefficient of absorption was calculated by averaging the absorption spectrum A(λ) over the solar spectrum S(λ) (Santbergen and van Zolingen, 2008), Eq. 46.
The averaged coefficients of absorption obtained and values of refractive indexes from the literature of the selected materials are given in Table 1.
3.2.3 Diffuse and Direct Irradiance
Until this part of the research, the incident irradiance arriving at an angle θ is used for the development of all formulas, but in actuality, the latter consists of a direct and a diffuse component, Eq. 47.
The optical coefficients for direct irradiance reaching an angle of incidence θ for different layers can easily be considered with all formulations, which were established in prior sections. It is pertinent to mention here that incident angles of diffuse irradiance range from 0o to 90o. For evaluation of coefficients, the values matching to the differential solid angle dΩ were analyzed after which integration to get the values over the whole hemisphere was carried out, as shown in Figure 5A. The PV solar system installed at the Central Station, Punjab Emergency Service, Rescue 1122, Faisalabad Road, Jhang (31.2781o N and 72.3317o E) is shown in Figure 5B.
FIGURE 5
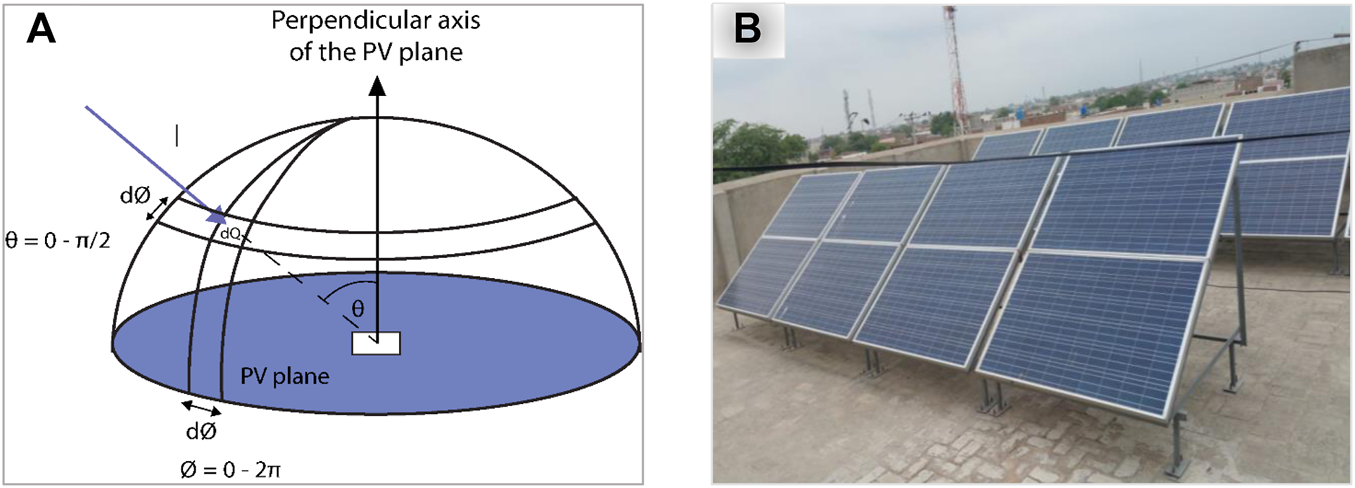
(A) Representation of isotropic diffuse irradiance. (B) Site panel location.
4 Results and Discussion
To validate the effects of optical phenomena in the prediction of electricity production by the PV panel, numerous cases with a range of changes were considered for many geographical locations, orientation, and inclination of 1 m2 of the PV panel. Optical coefficient variation was evaluated in every case. The generation of electricity was calculated and compared to the results of constant optical coefficients.
4.1 Optimum Configuration (Inclination 38o; Orientation 0o) of the PV Panel
The variation in angle of incidence of direction radiations and its effect for three optical coefficients of the glass material for a particular day in July in Jhang, Pakistan is shown in Figure 6. The PV panel slopes at an angle of 38o and is positioned to the south properly in the current case. The incident angle of the radiation varies significantly at some points of the day, resulting in the variation of the three optical coefficients properly. This variation in optical coefficients is further prominent at the time of daylight and at the end of the day in the evening, while these optical coefficients are very much regular between 10:00 AM and 2:00 PM. Furthermore, the reflectance trend with the variation in the incident angle is matching, while the absorbance and transmittance angle have the opposite tendency in comparison to incident angle.
FIGURE 6
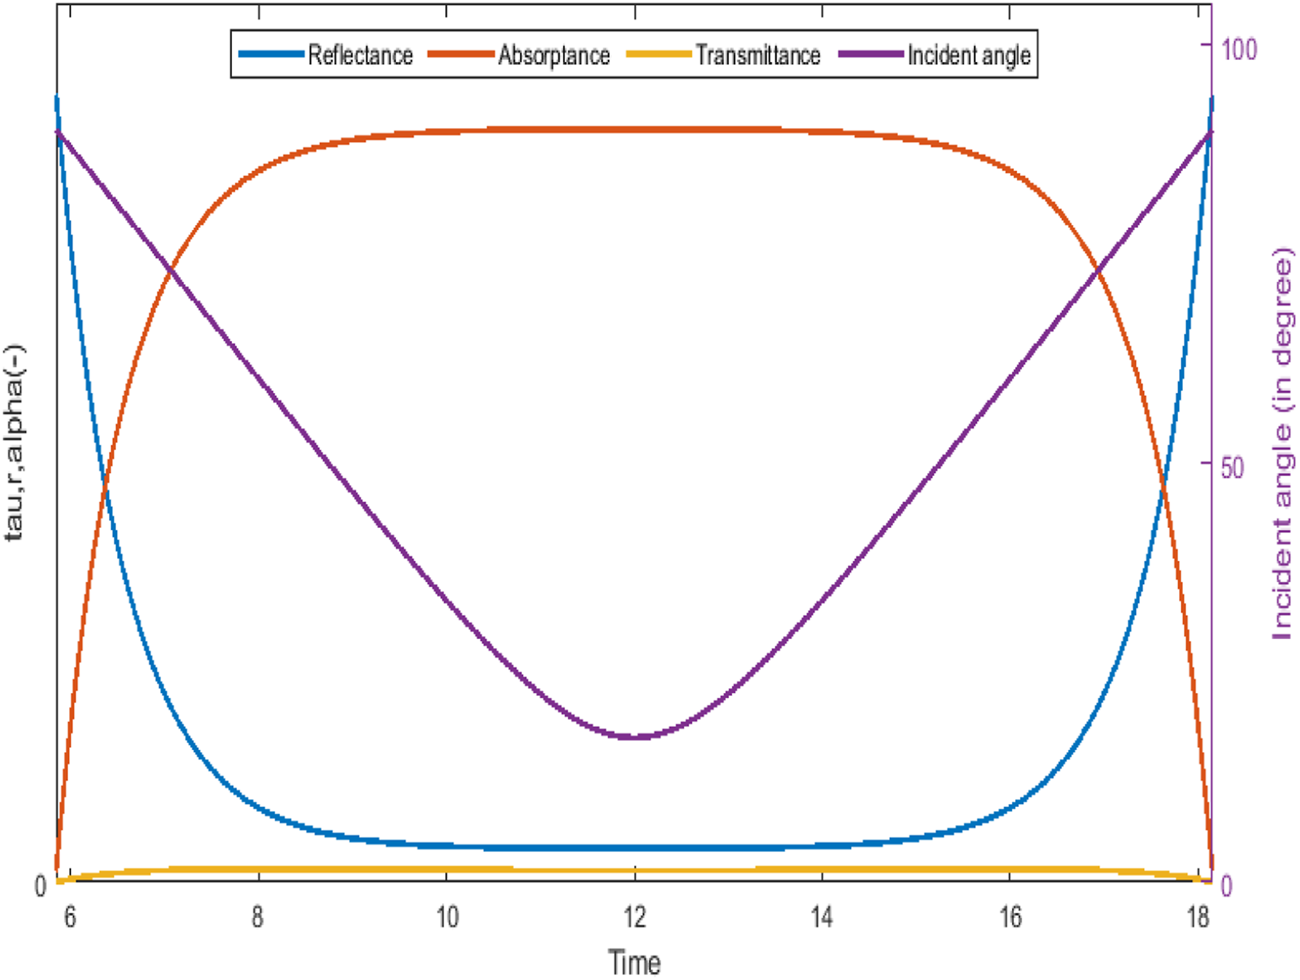
Incident angle variation resulting in change in optical coefficients of a glass PV panel (July).
The optical phenomena of the glass layer are of most relevance than other layers for different layers of the PV cell, and the variations of three optical coefficients are so small that it can be neglected, as shown in Figures 7A–C. The temperature variation of the silicon layer and energy generated was calculated by varying and constant coefficients and irradiance which are incident of the silicon layer, as shown by Figure 8. The power produced which was calculated using a constant coefficient is more than that when using varying coefficients, and both curves are asymmetric with a variation on the left of the curve. It is clear that the power produced by the PV panel is less at noon when the temperature is maximum than morning for the same solar flux. The reason for this is that the panels are exposed to the sun throughout the day and absorb heat which raises the temperature of the panels and lowers the efficiency of the conversion of solar energy to electricity. It can also be seen by the comparison of two models that the difference in morning and evening is more considerable due to the large difference between the coefficients of models in these periods of the day. The same tendency has been observed when the same calculations were carried out for all months of a year. The incident angle of radiation changes more in the month July than the month of December as shown in Figure 9. Furthermore, the minimum angle in the month of July is less than that in the month of December. Hence, the transmittance and absorbance are higher in the month of July when compared to December, and the reflectance is higher in December, but this difference is minimal around noon.
FIGURE 7
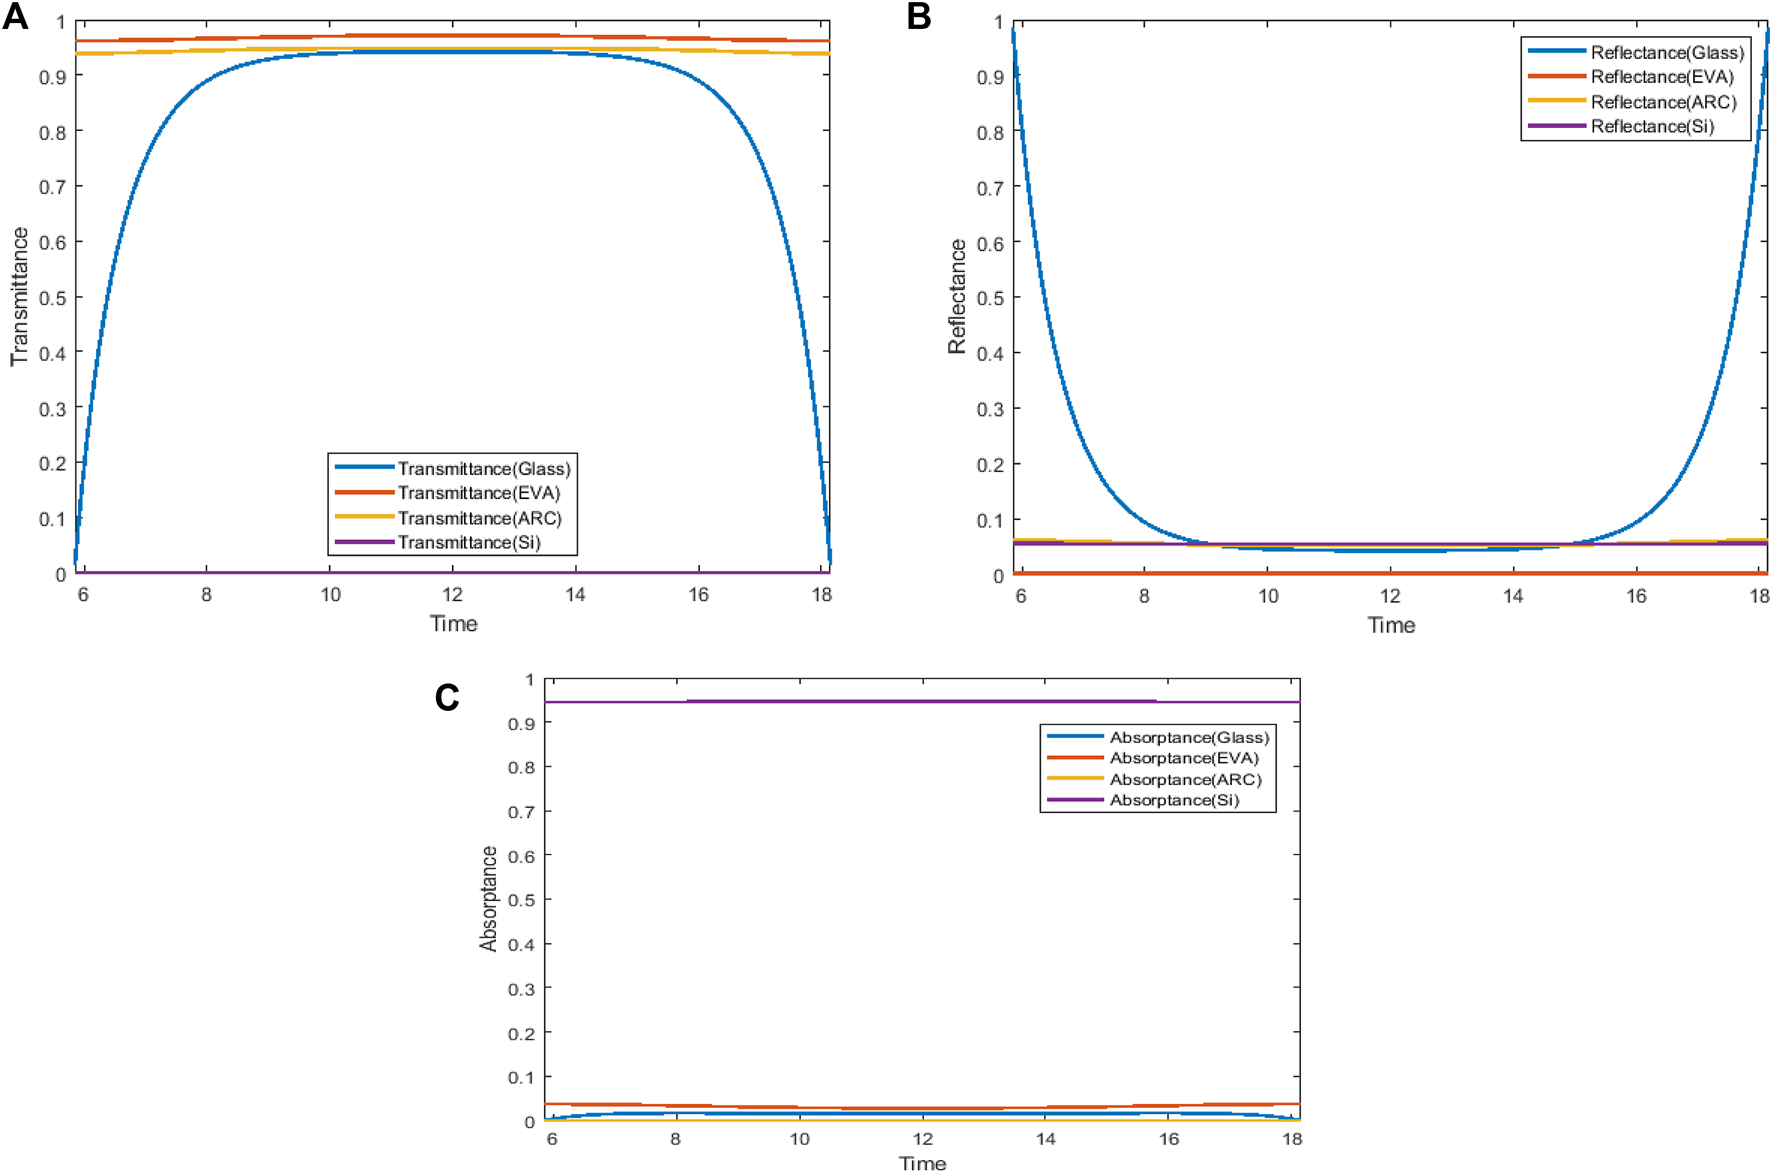
Optical coefficient (transmittance) variation of different layers: ARC, glass, EVA, and silicon (July). (A) Transmittance, (B) reflectance, and (C)absorbance.
FIGURE 8
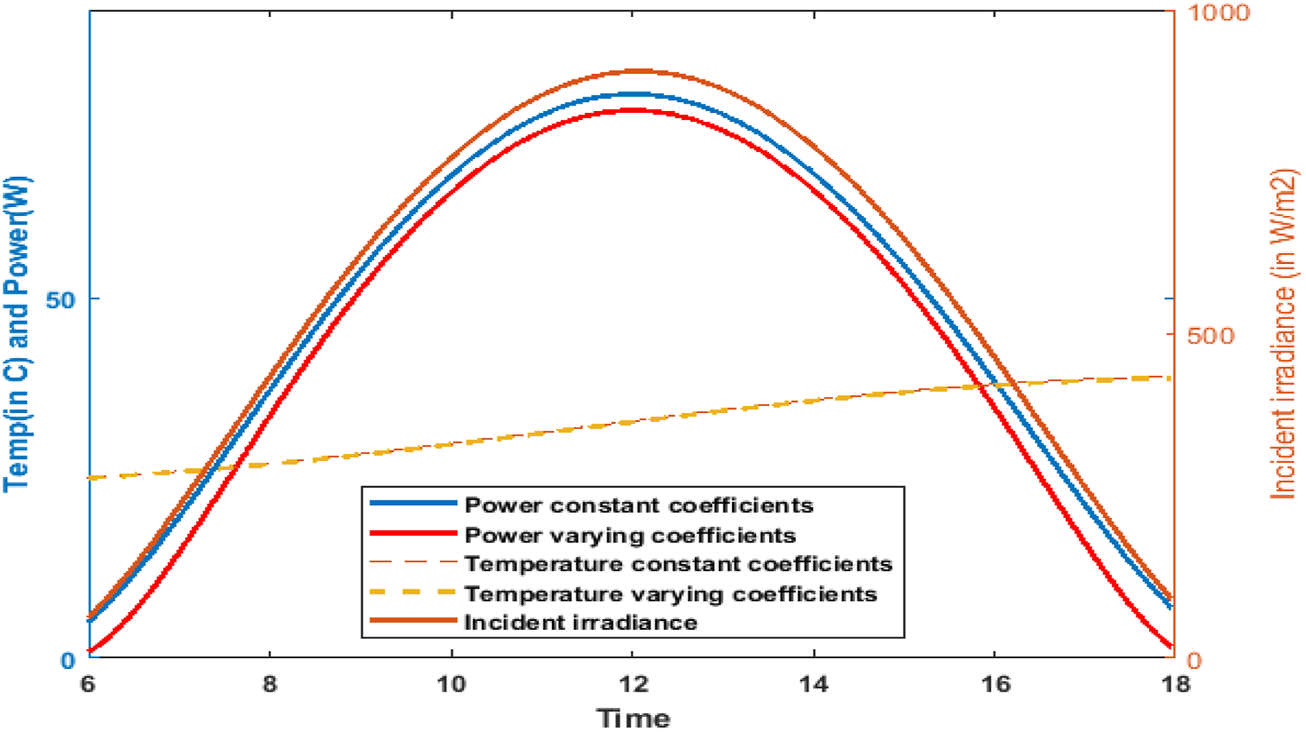
Calculated the electrical power with constant and varying optical coefficients (July).
FIGURE 9
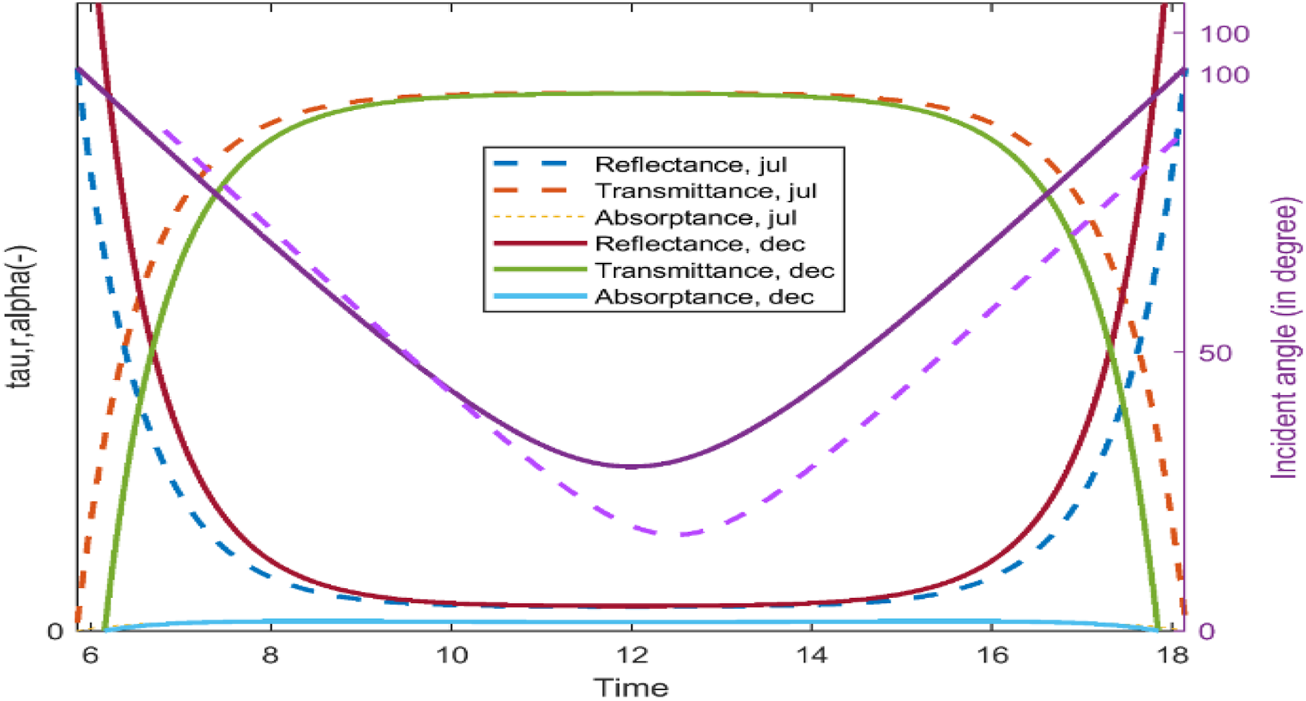
Incident angle variation and of the optical coefficients of glass (July and December).
Figure 10 depicts that there is significant agreement between the classical thermal model and experimentally produced electricity throughout the year which validates the modeling. The difference between electricity generation between the optical thermal model and the experimental model is higher than the difference between the classical and experimental models. The values of deviations are lower between the classical model’s results and experimental data when compared to the optical model’s results and experimental data. The mean percentage difference of monthly electricity production between the classical model and experimental data is noted as 12.4%, whereas for the optical model, it is observed as 28.2%. The highest error in monthly electricity production for both the models against experimental data occurred in the month of January-2017, whereas the lowest occurred in the month of May-2017 (July-2016) for the classical model (optical model) against experimental data. So, it can be inferred that the classic thermal model shows better performance as it more closely exhibits the results compared with experimental results. The classical thermal model may be used for estimating the power production at a typical geographical location and hence may facilitate the engineers for solar power projects. A uniform gap in electricity production between the classical thermal model and optical thermal model was observed throughout the year, which substantiates that a relationship exists between these two models. The classical thermal model presents better results than the optical model because the classical thermal model consists of constant coefficients, whereas the optical model has variable coefficients. The variation in coefficient brings inaccuracy in the model, and it becomes difficult for the model to predict accurate behavior of the output parameter.
FIGURE 10
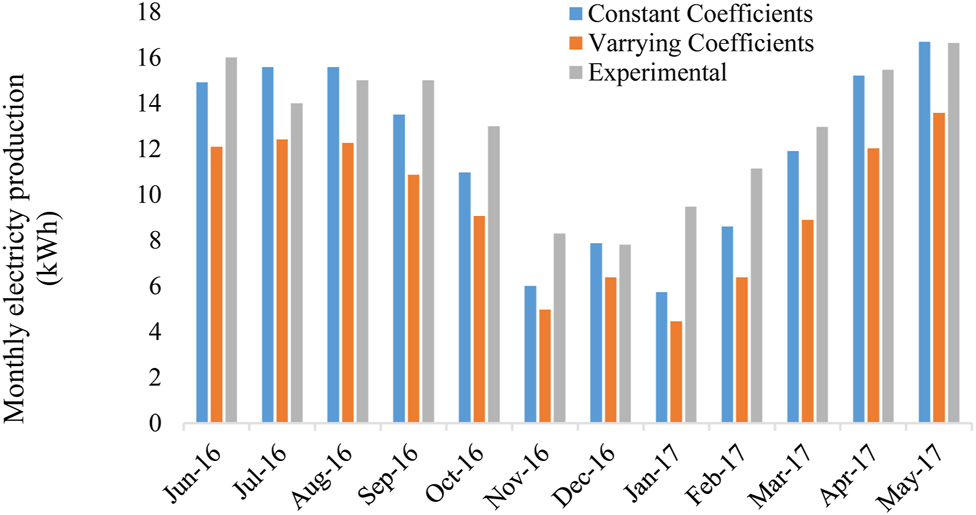
Month-wise production of electricity of two models of constant and varying optical coefficients in comparison with experimental production.
4.2 Incidence Angle Variation With Numerous Inclinations and Optimum Orientation (0o) of the PV Panel
The variation in incidence angle and in optical coefficients and the power generated with several angles of inclinations changing from 0o to 80o were studied in this study. The incidence angle normally reduces by increasing the inclination angle as shown in Figure 11. However, the distinction is only sizeable for lower angles (between 0o and 20o).
FIGURE 11

Incident angle variation and the glass transmittance because of a range of angle of inclination (°) (December).
The electricity production for numerous month simulations in the year has been carried out. Figures 12A,B show the production of electricity at some time of June and December consistent with the exclusive angle of inclination, respectively. The changes in electricity production for the months of December and March are identical to those for the months of June and September. The difference among the models is considerable for smaller angles of inclination for the month of December, whereas the difference is accountable for larger inclination angles for the month of June. The angle of incidence has been valued a long way from 0o in those instances as shown in Figure 11, and the coefficients for the classical thermal model were evaluated with a 0o value of the incident angle. As a result, a considerable difference has been observed between the two models.
FIGURE 12
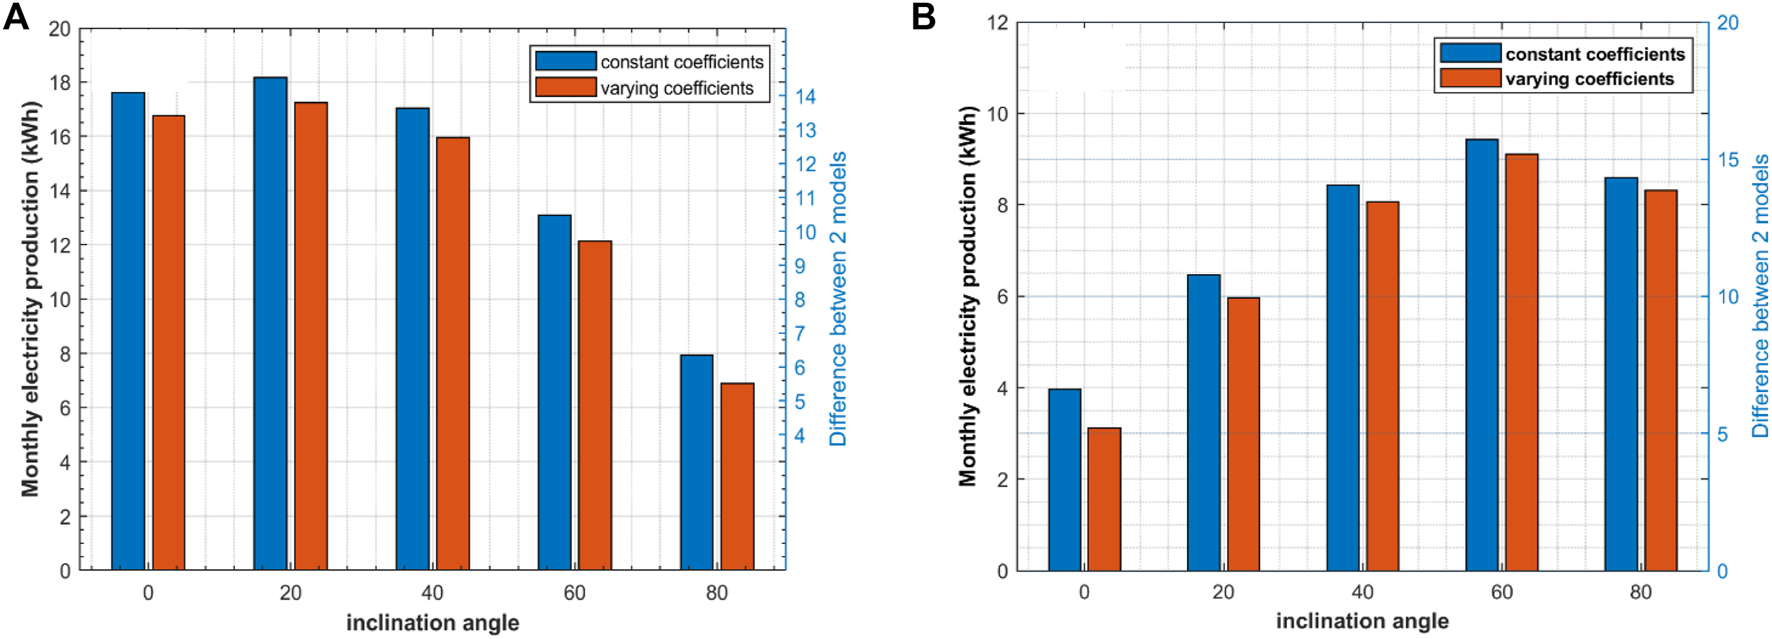
Month-wise production of electricity with two models (classical and optical) and with an angle of inclination changing from 0o to 80o for (A) June and (B) December.
4.3 Different Orientations of the PV Panel with an Inclination of 38o
The configuration of the panel at different angles of azimuth was checked; south-west (−45o and 45o) and west (−90o and 90o), east (−90o and 90o), south-east (−45o and 45o), and south (0o); the results are shown in Figure 13. In addition, greater value is obtained if the PV panel is orientated toward the south, and the bigger the angle of inclination and curves of transmittance, the smaller the angle of inclination within the noon is (while their radiance is at very best level). Hence, the orientation of the south is best to collect maximum solar flux at some stage in the year. Figures 14A,B show month-wise production of electricity corresponding to varying and constant optical coefficients models and with changing azimuth angle (−90o to 90o) in March and September, respectively. It can be observed that the difference in electricity production by the two models normally increases as the panel moves away from the south.
FIGURE 13
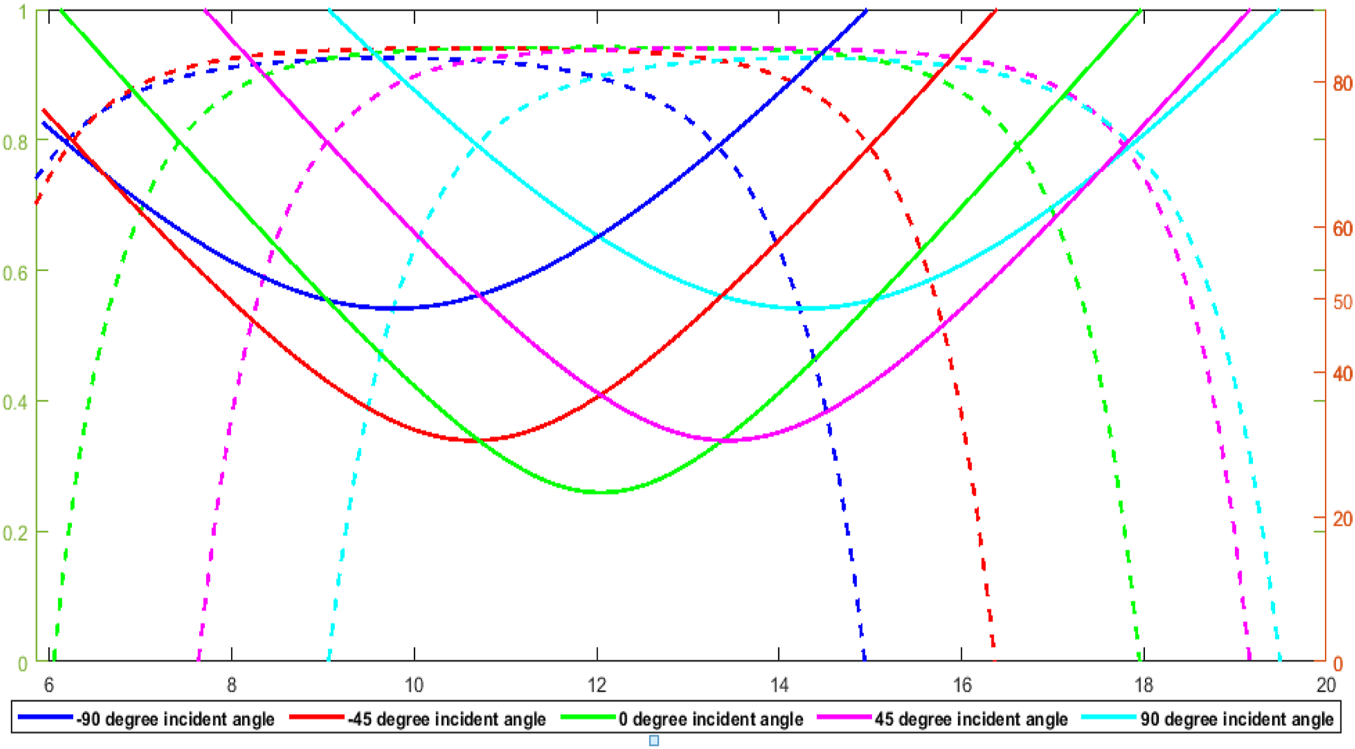
Incident angle variation and the transmittance in the result of different azimuth angles (°) (December).
FIGURE 14
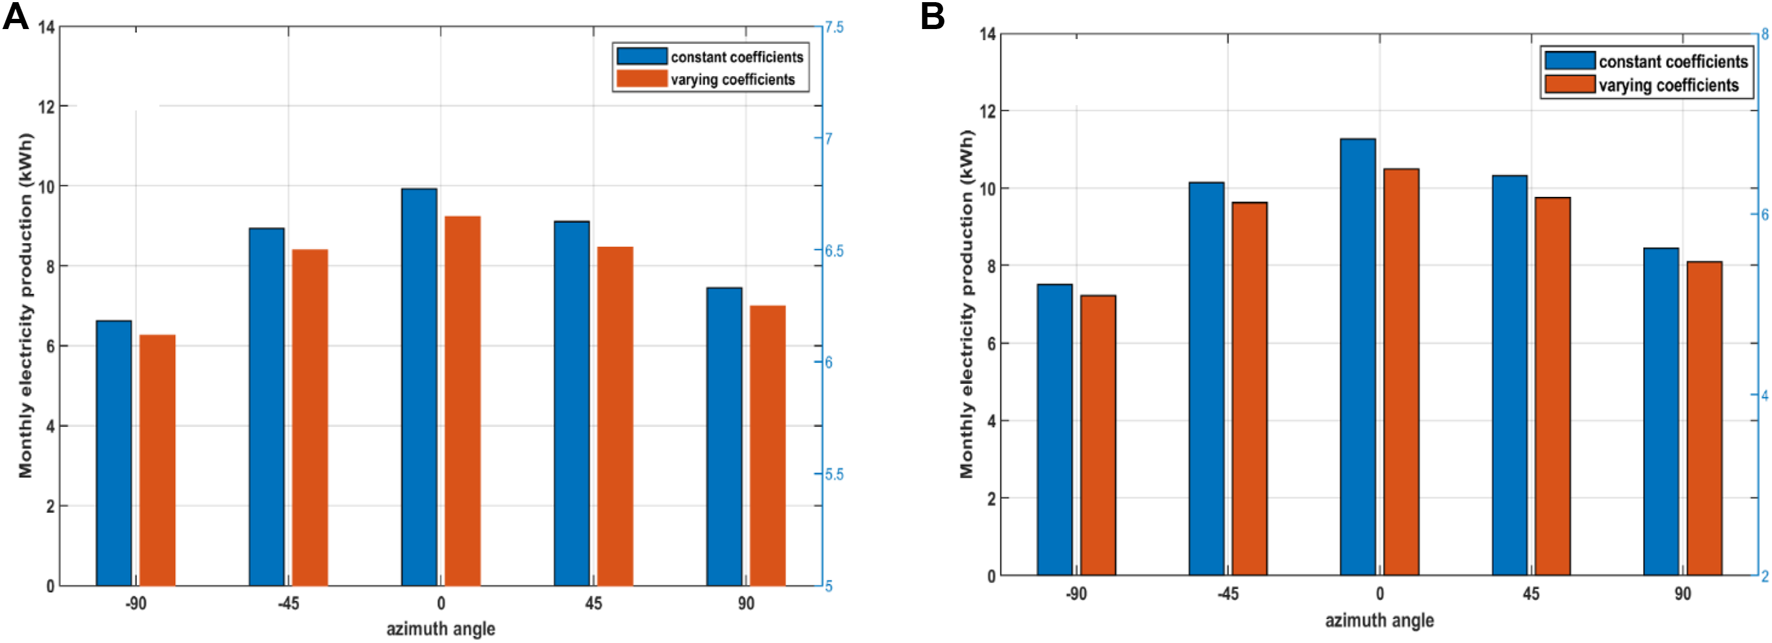
Month-wise production of electricity corresponding to varying and constant optical coefficients models and with changing azimuth angle (- 90o to 90o) for (A) March and (B) September.
5 Conclusion
This research work aims to develop theoretical models for performance evaluation of the photovoltaic (PV) system on the basis of classical thermal principles which uses constant values of optical coefficients (reflectance, transmittance, and absorbance). However, these coefficients, in fact, depend on the incident angle of the radiations approaching the PV panel and, therefore, are a function of the inclination and orientation along with the geographical position and time. The constant coefficient (classical thermal model) and the varying coefficient (optical thermal model) with an incident angle in the energy balance equations followed by experimental validation were considered in this study.
The comparison of electricity produced by both the optical–thermal and classical thermal models and experimentally assessed by the PV system installed in Jhang, Pakistan allows concluding that.
• There is significant agreement between the classical thermal model and experimentally produced electricity throughout the year which validates the modeling.
• The difference in electricity production between the optical–thermal model and experimental model is more as compared to the classical thermal model and experimental model, so it is inferred that the classic thermal model more closely shows a practical system. The reason for the accuracy of the classical model lies in constant coefficients as with constant or average coefficients, the errors become lower than varying coefficients.
• Comparison of variable and constant optical coefficients shows that the PV panel performs better with constant optical coefficients, and the difference of electricity production by the two models normally increases as the panel moves away from the south.
• The classical thermal model may be used for estimating the power production at a typical geographical location and hence may facilitate the engineers for solar power projects.
• A uniform gap in electricity production between the classical thermal model and optical thermal model was observed throughout the year, which clearly indicates that there exists a relationship between these two models.
The performance of the PV panel is evaluated by two models, that is, classical thermal model and optical thermal model and then validated experimentally, concluding that the classical thermal model is more accurate in evaluating the power output for the district Jhang in Pakistan, but there may be variations in other parts of the world due to different input parameters. For additional examination, these models should be pragmatic to other environmental concerns. Furthermore, the panel performance must be evaluated now with appreciative conditions to evaluate energy efficiency. The methodology adopted in this study can be used to evaluate the performance of PV panels according to solar conditions of other regions in the world.
Statements
Data availability statement
The raw data supporting the conclusion of this article will be made available by the authors, without undue reservation.
Author contributions
MA (writing, experimentation, and conceptualization), MU (methodology and formal analysis), JH (writing—review and editing), MF (writing—review and editing), MN (data curation), MM (formal analysis, writing—review, and editing), FA (writing—review and editing, funding acquisition), and YF (writing—review and editing).
Funding
The authors extend their appreciation to the Researchers Supporting Project number (RSP2022R515), King Saud University, Riyadh, Saudi Arabia for funding this research work.
Conflict of interest
The authors declare that the research was conducted in the absence of any commercial or financial relationships that could be construed as a potential conflict of interest.
Publisher’s note
All claims expressed in this article are solely those of the authors and do not necessarily represent those of their affiliated organizations, or those of the publisher, the editors, and the reviewers. Any product that may be evaluated in this article, or claim that may be made by its manufacturer, is not guaranteed or endorsed by the publisher.
Abbreviations
- Α
Absorption coefficient (m−1)
- C
Specific heat Jkg−1K−1
- e
Thickness of the layer m
- E
Time equation h
- F
View factor Pa
- h
Convective heat transfer coefficient Wm−2K−1
- H
True local solar time H
- H1
Local time H
- ΔH1
Time lag between the UTC and the given time zone h
- ΔHg
Time lag because of longitudinal variations within the time zone h
- I
Solar irradiance (Wm−2)
- J
The day of the year ----
- K
Thermal conductivity Wm−1K−1
- L
Latitude (o)
Traveling distance by irradiance through material M
- L
Latitude (o)
Traveling distance by irradiance through material M
- n
Refractive index ----
- P
Output electrical power W
- r
Material reflectance Wm−2
- S
Greek symbol inclination angle of the PV panel (o)
- T
Temperature K
- α
Absorbance ----
- βo
Temperature coefficient K−1
- γ
Coefficient of solar radiation ----
- δ
Sun’s declination (o)
- ε
Material emissivity ----
- ƞ
Efficiency ----
- ϴ
Incident angle (o)
- λ
Wavelength M
- t
Time s
- φ
Azimuthal angle (o)
- phi ----
- ρ
Density Kgm−3
- σ
Stefan–Boltzmann constant Wm−2K−4
- τ
Transmittance ___
- φ
Azimuthal angle (o)
- ω
Hour angle (o)
Nomenclature
Abbreviations
- Α
Absorption coefficient (m−1)
- C
Specific heat Jkg−1K−1
- e
Thickness of the layer m
- E
Time equation h
- F
View factor Pa
- h
Convective heat transfer coefficient Wm−2K−1
- H
True local solar time H
- H1
Local time H
- ΔH1
Time lag between the UTC and the given time zone h
- ΔHg
Time lag because of longitudinal variations within the time zone h
- I
Solar irradiance (Wm−2)
- J
The day of the year ----
- K
Thermal conductivity Wm−1K−1
- L
Latitude (o)
Traveling distance by irradiance through material M
- L
Latitude (o)
Traveling distance by irradiance through material M
- n
Refractive index ----
- P
Output electrical power W
- r
Material reflectance Wm−2
- S
Greek symbol inclination angle of the PV panel (o)
- T
Temperature K
- α
Absorbance ----
- βo
Temperature coefficient K−1
- γ
Coefficient of solar radiation ----
- δ
Sun’s declination (o)
- ε
Material emissivity ----
- ƞ
Efficiency ----
- ϴ
Incident angle (o)
- λ
Wavelength M
- t
Time s
- φ
Azimuthal angle (o)
- phi ----
- ρ
Density Kgm−3
- σ
Stefan–Boltzmann constant Wm−2K−4
- τ
Transmittance ___
- φ
Azimuthal angle (o)
- ω
Hour angle (o)
References
1
Abdelkareem M. A. El Haj Assad M. Sayed E. T. Soudan B. (2018). Recent Progress in the Use of Renewable Energy Sources to Power Water Desalination Plants. Desalination435, 97–113. 10.1016/j.desal.2017.11.018
2
Abdelkareem M. A. Tanveer W. H. Sayed E. T. Assad M. E. H. Allagui A. Cha S. W. (2019). On the Technical Challenges Affecting the Performance of Direct Internal Reforming Biogas Solid Oxide Fuel Cells. Renew. Sustain. Energy Rev.101, 361–375. 10.1016/j.rser.2018.10.025
3
Al-Dhaifallah M. Nassef A. M. Rezk H. Nisar K. S. (2018). Optimal Parameter Design of Fractional Order Control Based INC-MPPT for PV System. Sol. Energy159, 650–664. 10.1016/j.solener.2017.11.040
4
Armstrong S. Hurley W. (2010). A Thermal Model for Photovoltaic Panels under Varying Atmospheric Conditions. Appl. Energy Eng.30 (11-12), 1488–1495. 10.1016/j.applthermaleng.2010.03.012
5
Beckman W. A. Duffie J. A. (1974). Solar Energy Thermal Processes. Creset.
6
Cuce E. Nachan Z. Cuce P. M. Sher F. Neighbour G. B. (2019). Strategies for Ideal Indoor Environments towards Low/zero Carbon Buildings through a Biomimetic Approach. Int. J. Ambient Energy40 (1), 86–95. 10.1080/01430750.2017.1372807
7
Diab F. Lan H. Zhang L. Ali S. (2015). An Environmentally-Friendly Tourist Village in Egypt Based on a Hybrid Renewable Energy System--Part One: What Is the Optimum City?Energies8 (7), 6926–6944. 10.3390/en8076926
8
Edalati S. Ameri M. Iranmanesh M. (2015). Comparative Performance Investigation of Mono- and Poly-Crystalline Silicon Photovoltaic Modules for Use in Grid-Connected Photovoltaic Systems in Dry Climates. Appl. Energy160, 255–265. 10.1016/j.apenergy.2015.09.064
9
Evans D. L. (1981). Simplified Method for Predicting Photovoltaic Array Output. Sol. Energy27 (6), 555–560. 10.1016/0038-092x(81)90051-7
10
Ghenai C. Janajreh I. (2016). Design of Solar-Biomass Hybrid Microgrid System in Sharjah. Energy Procedia103, 357–362. 10.1016/j.egypro.2016.11.299
11
Ghenai C. Salameh T. Merabet A. (2020). Technico-economic Analysis of off Grid Solar PV/Fuel Cell Energy System for Residential Community in Desert Region. Int. J. Hydrogen Energy45 (20), 11460–11470. 10.1016/j.ijhydene.2018.05.110
12
Gomaa M. Mustafa R. Rezk H. Al-Dhaifallah M. Al-Salaymeh A. (2018). Sizing Methodology of a Multi-Mirror Solar Concentrated Hybrid PV/thermal System. Energies11 (12), 3276. 10.3390/en11123276
13
Inayat A. Nassef A. M. Rezk H. Sayed E. T. Abdelkareem M. A. Olabi A. G. (2019). Fuzzy Modeling and Parameters Optimization for the Enhancement of Biodiesel Production from Waste Frying Oil over Montmorillonite Clay K-30. Sci. Total Environ.666, 821–827. 10.1016/j.scitotenv.2019.02.321
14
Khan M. Zeb K. Sathishkumar P. Rao S. Gopi C. Kim H.-J. (2018). A Novel Off-Grid Optimal Hybrid Energy System for Rural Electrification of Tanzania Using a Closed Loop Cooled Solar System. Energies11 (4), 905. 10.3390/en11040905
15
Khatib T. Mohamed A. Sopian K. (2013). A Review of Photovoltaic Systems Size Optimization Techniques. Renew. Sustain. Energy Rev.22, 454–465. 10.1016/j.rser.2013.02.023
16
Lau K. Y. Muhamad N. A. Arief Y. Z. Tan C. W. Yatim A. H. M. (2016). Grid-connected Photovoltaic Systems for Malaysian Residential Sector: Effects of Component Costs, Feed-In Tariffs, and Carbon Taxes. Energy102, 65–82. 10.1016/j.energy.2016.02.064
17
Le Lay C. (2021). L'annuaire du Bureau des Longitudes et la Diffusion Scientifique : Enjeux et Controverses (1795-1870). L'Annuaire du Bureau des longitudes. (1795-1932).
18
Lu Z. H. Yao Q. (2007). Energy Analysis of Silicon Solar Cell Modules Based on an Optical Model for Arbitrary Layers. Sol. Energy81 (5), 636–647. 10.1016/j.solener.2006.08.014
19
Menconi M. E. dell'Anna S. Scarlato A. Grohmann D. (2016). Energy Sovereignty in Italian Inner Areas: Off-Grid Renewable Solutions for Isolated Systems and Rural Buildings. Renew. Energy93, 14–26. 10.1016/j.renene.2016.02.034
20
Mertin S. Hody-Le Caër V. Joly M. Mack I. Oelhafen P. Scartezzini J.-L. et al (2014). Reactively Sputtered Coatings on Architectural Glazing for Coloured Active Solar Thermal Façades. Energy Build.68, 764–770. 10.1016/j.enbuild.2012.12.030
21
Mohamed H. O. Obaid M. Sayed E. T. Abdelkareem M. A. Park M. Liu Y. et al (2017). Graphite Sheets as High-Performance Low-Cost Anodes for Microbial Fuel Cells Using Real Food Wastewater. Chem. Eng. Technol.40 (12), 2243–2250. 10.1002/ceat.201700058
22
Mohamed M. A. Zaki Diab A. A. Rezk H. (2019). Partial Shading Mitigation of PV Systems via Different Meta-Heuristic Techniques. Renew. Energy130, 1159–1175. 10.1016/j.renene.2018.08.077
23
Nassef A. M. Fathy A. Sayed E. T. Abdelkareem M. A. Rezk H. Tanveer W. H. et al (2019a). Maximizing SOFC Performance through Optimal Parameters Identification by Modern Optimization Algorithms. Renew. Energy138, 458–464. 10.1016/j.renene.2019.01.072
24
Nassef A. M. Sayed E. T. Rezk H. Abdelkareem M. A. Rodriguez C. Olabi A. G. (2019b). Fuzzy-modeling with Particle Swarm Optimization for Enhancing the Production of Biodiesel from MicroalgaEnergy Sources, Part A: Recovery, Utilization. Energy Sources, Part A Recovery, Util. Environ. Eff.41 (17), 2094–2103. 10.1080/15567036.2018.1549171
25
Neves D. Pina A. Silva C. A. (2018). Comparison of Different Demand Response Optimization Goals on an Isolated Microgrid. Sustain. Energy Technol. Assessments30, 209–215. 10.1016/j.seta.2018.10.006
26
Nicol J. F. Raja I. A. Allaudin A. Jamy G. N. (1999). Climatic Variations in Comfortable Temperatures: the Pakistan Projects. Energy Build.30 (3), 261–279. 10.1016/s0378-7788(99)00011-0
27
Notton G. Cristofari C. Mattei M. Poggi P. (2005). Modelling of a Double-Glass Photovoltaic Module Using Finite Differences. Appl. Therm. Eng.25 (17-18), 2854–2877. 10.1016/j.applthermaleng.2005.02.008
28
Poompavai T. Kowsalya M. (2019). Control and Energy Management Strategies Applied for Solar Photovoltaic and Wind Energy Fed Water Pumping System: A Review. Renew. Sustain. Energy Rev.107, 108–122. 10.1016/j.rser.2019.02.023
29
Rafindadi A. A. (2016a). Does the Need for Economic Growth Influence Energy Consumption and CO2 Emissions in Nigeria? Evidence from the Innovation Accounting Test. Renew. Sustain. Energy Rev.62, 1209–1225. 10.1016/j.rser.2016.05.028
30
Rafindadi A. A. Mika'Ilu A. S. (2019). Sustainable Energy Consumption and Capital Formation: Empirical Evidence from the Developed Financial Market of the United Kingdom. Sustain. Energy Technol. Assessments35, 265–277. 10.1016/j.seta.2019.07.007
31
Rafindadi A. A. Muye I. M. Kaita R. A. (2018). The Effects of FDI and Energy Consumption on Environmental Pollution in Predominantly Resource-Based Economies of the GCC. Sustain. Energy Technol. Assessments25, 126–137. 10.1016/j.seta.2017.12.008
32
Rafindadi A. A. Ozturk I. (2016). Effects of Financial Development, Economic Growth and Trade on Electricity Consumption: Evidence from Post-fukushima Japan. Renew. Sustain. Energy Rev.54, 1073–1084. 10.1016/j.rser.2015.10.023
33
Rafindadi A. A. Ozturk I. (2017). Impacts of Renewable Energy Consumption on the German Economic Growth: Evidence from Combined Cointegration Test. Renew. Sustain. Energy Rev.75, 1130–1141. 10.1016/j.rser.2016.11.093
34
Rafindadi A. A. Ozturk I. (2015). Natural Gas Consumption and Economic Growth Nexus: Is the 10th Malaysian Plan Attainable within the Limits of its Resource?Renew. Sustain. Energy Rev.49, 1221–1232. 10.1016/j.rser.2015.05.007
35
Rafindadi A. A. (2016b). Revisiting the Concept of Environmental Kuznets Curve in Period of Energy Disaster and Deteriorating Income: Empirical Evidence from Japan. Energy Policy94, 274–284. 10.1016/j.enpol.2016.03.040
36
Rakovec J. Zakšek K. Brecl K. Kastelec D. Topič M. (2011). Orientation and Tilt Dependence of a Fixed PV Array Energy Yield Based on Measurements of Solar Energy and Ground Albedo–A Case Study of Slovenia. Energy Manag. Syst., 145
37
Ren R. Han X. Zhang H. Lin H. Zhao J. Zheng Y. et al (2018). High Yield Bio-Oil Production by Hydrothermal Liquefaction of a Hydrocarbon-Rich Microalgae and Biocrude Upgrading. Carbon Resour. Convers.1 (2), 153–159. 10.1016/j.crcon.2018.07.008
38
Rezk H. Nassef A. M. Inayat A. Sayed E. T. Shahbaz M. Olabi A. G. (2019). Improving the Environmental Impact of Palm Kernel Shell through Maximizing its Production of Hydrogen and Syngas Using Advanced Artificial Intelligence. Sci. Total Environ.658, 1150–1160. 10.1016/j.scitotenv.2018.12.284
39
Santbergen R. van Zolingen R. J. C. (2008). The Absorption Factor of Crystalline Silicon PV Cells: A Numerical and Experimental Study. Sol. Energy Mater. Sol. Cells92 (4), 432–444. 10.1016/j.solmat.2007.10.005
40
Sayed E. T. Eisa T. Mohamed H. O. Abdelkareem M. A. Allagui A. Alawadhi H. et al (2019). Direct Urea Fuel Cells: Challenges and Opportunities. J. Power Sources417, 159–175. 10.1016/j.jpowsour.2018.12.024
41
Schott T. (1985). Operation Temperatures of Pv Modules: a Theoretical and Experimental Approach. EC Photovolt. Sol. energy Conf.6.
42
Sharma R. Goel S. (2017). Performance Analysis of a 11.2 kWp Roof Top Grid-Connected PV System in Eastern India. Energy Rep.3, 76–84. 10.1016/j.egyr.2017.05.001
43
Sher F. Kawai A. Güleç F. Sadiq H. (2019). Sustainable Energy Saving Alternatives in Small Buildings. Sustain. Energy Technol. Assessments32, 92–99. 10.1016/j.seta.2019.02.003
44
Shukla A. K. Sudhakar K. Baredar P. (2016a). A Comprehensive Review on Design of Building Integrated Photovoltaic System. Energy Build.128, 99–110. 10.1016/j.enbuild.2016.06.077
45
Shukla A. K. Sudhakar K. Baredar P. (2016b). Exergetic Assessment of BIPV Module Using Parametric and Photonic Energy Methods: a Review. Energy Build.119, 62–73. 10.1016/j.enbuild.2016.03.022
46
Shukla A. K. Sudhakar K. Baredar P. (2017). Recent Advancement in BIPV Product Technologies: A Review. Energy Build.140, 188–195. 10.1016/j.enbuild.2017.02.015
47
Tahir Z. u. R. Asim M. Azhar M. Moeenuddin G. Farooq M. (2021). Correcting Solar Radiation from Reanalysis and Analysis Datasets with Systematic and Seasonal Variations. Case Stud. Therm. Eng.25, 100933. 10.1016/j.csite.2021.100933
48
Tahir Z. u. R. Azhar M. Blanc P. Asim M. Imran S. Hayat N. et al (2020). The Evaluation of Reanalysis and Analysis Products of Solar Radiation for Sindh Province, Pakistan. Renew. Energy145, 347–362. 10.1016/j.renene.2019.04.107
49
Zeyringer M. Pachauri S. Schmid E. Schmidt J. Worrell E. Morawetz U. B. (2015). Analyzing Grid Extension and Stand-Alone Photovoltaic Systems for the Cost-Effective Electrification of Kenya. Energy Sustain. Dev.25, 75–86. 10.1016/j.esd.2015.01.003
Summary
Keywords
renewable energy, solar radiations, solar panels, photovoltaics, numerical study
Citation
Asim M, Usman M, Hussain J, Farooq M, Naseer MI, Fouad Y, Mujtaba MA and Almehmadi FA (2022) Experimental Validation of a Numerical Model to Predict the Performance of Solar PV Cells. Front. Energy Res. 10:873322. doi: 10.3389/fenrg.2022.873322
Received
10 February 2022
Accepted
04 May 2022
Published
22 June 2022
Volume
10 - 2022
Edited by
Enio Pedone Bandarra Filho, Federal University of Uberlandia, Brazil
Reviewed by
Gleyzer Martins, Federal University of Uberlandia, Brazil
Daniel Dall'Onder Dos Santos, Federal University of Uberlandia, Brazil
Luz Elena Chenche, Federal University of Rio de Janeiro, Brazil
Updates
Copyright
© 2022 Asim, Usman, Hussain, Farooq, Naseer, Fouad, Mujtaba and Almehmadi.
This is an open-access article distributed under the terms of the Creative Commons Attribution License (CC BY). The use, distribution or reproduction in other forums is permitted, provided the original author(s) and the copyright owner(s) are credited and that the original publication in this journal is cited, in accordance with accepted academic practice. No use, distribution or reproduction is permitted which does not comply with these terms.
*Correspondence: M.A. Mujtaba, m.mujtaba@uet.edu.pk
This article was submitted to Solar Energy, a section of the journal Frontiers in Energy Research
Disclaimer
All claims expressed in this article are solely those of the authors and do not necessarily represent those of their affiliated organizations, or those of the publisher, the editors and the reviewers. Any product that may be evaluated in this article or claim that may be made by its manufacturer is not guaranteed or endorsed by the publisher.