- 1Electric Power Research Institute of State Grid Hebei Electric Power Supply Co., Ltd., Shijiazhuang, China
- 2State Grid Hebei Electric Power Co., Ltd., Shijiazhuang, China
With the high proportion of new energy access in power distribution networks, the operation of distribution networks becomes more uncertain and complex. The mechanism on how to extract features that embody the full perspective of the distribution network from the diverse and varying conditions is of great significance to master the operating property of distribution networks under the high proportion of new energy. This study investigates the portrait construction of power distributions. A data-driven method of portrait construction for a distribution network based on a cloud model is proposed. First, the indexes describing the operation of the medium voltage distribution network (MVDN) and low-voltage station area (LVSA) are established. By means of statistics, fuzzy label templates are provided for the indexes. Then, based on the daily monitoring power grid data, the operation index is calculated to form the collected samples, and the reverse cloud generator is used as the data-driven method to process the samples, and the fuzzy model of cloud parameter representation is obtained. Finally, the fuzzy distance between the obtained fuzzy model and the label template is calculated, and the scores of operation indexes are obtained, thus forming a portrait method of distribution network operation behavior. Taking the IEEE 33 distribution network and real distribution network as examples and taking the LVSA as an example, it is verified that this method can effectively construct the distribution network operation portrait.
1 Introduction
Power systems are key aspects of the goal of “double carbon”. Developing new energy, for example, wind and solar energy is vital to solve the problem of carbon emission. The power systems with new energy as the fundamental power are facing much uncontrollable new energy, the interaction of flexible load, and stochastic operating conditions. The traditional analysis and control mechanism based on determined power systems are difficult to meet the new power system (Akhavan-Rezai et al., 2009; Nasaruddin and Muhibbuddin, 2021). Based on operational data, establishing a data-driven modeling strategy is necessary.
User’s power consumption behavior will greatly affect the operation behavior of the distribution network. Consumption behavior analysis plays an important role in load forecasting, power consumption management, demand response, situation analysis, and safety warning (Wu and Li, 2019; Chen et al., 2020). With the employment of the Internet of Things in the power grid (Lu et al., 2018), the potential value of power big data is also being explored (Liu et al., 2021). At the same time, with the rise of the big data technology, the increase in data acquisition dimension and the integration of emerging technologies were widely used in the power industry (Bertoldi and Atanasiu, 2011). It is possible to analyze user behavior (Jin et al., 2021), and extract potential consumption habits accurately (Wu and Li, 2019).
User portrait descriptions are valuable tools for mining users’ information according to the real data of users (Yu et al., 2019).. Chen et al. (2020) proposed a process of constructing a user portrait based on a wide range of users’ data. Different from ordinary exploitation of users’ information, portraits of users pay more attention to the whole features of users. Through the classification of user attributes, the features are extracted with labels. Hu et al. (2021) improved the Internet user portrait system by mining the user behaviors to extract user labels. The portrait technology brings a more intuitive and concise expression for the analysis of users’ power consumption behavior (Yu et al., 2019), so it is also widely used in the field of the power system. A multi-attribute power consumption behavior portrait including characteristics, patterns, group characteristics, and personality of users should be established to provide a theoretical basis for the intelligent power consumption technology based on “active load” collaborative interaction (Hu et al., 2017). Ran Gu et al. (2015) extracted the feature vector of users, considered the user’s power consumption pattern as the label, and proposed a customer power consumption pattern recognition method based on the stacking model fusion framework. Wu and Li (2019) used an additive model to decompose the user’s power consumption to extract the trend, law, and holiday impact of power consumption and describe the user’s power consumption behavior by constructing module vectors. Yu et al. (2019) proposed a fuzzy c-means clustering algorithm for user power consumption patterns to realize the multi-attribute power consumption behavior patterns of different types of users in the integrated energy system. Guan et al. (2021) proposed an analysis method of user’s power consumption characteristics and behavior portrait based on the ks-rf algorithm. The clustering division results and feature labels are used to comprehensively portray and visually exhibit the user’s power consumption. Wang et al. (2018) proposed an optimal clustering strategy based on an accurate index and carried out experimental verification and analysis on the optimal clustering of users’ power consumption behavior. LVSAs are important to power consumption in the power grid. Research studies were conducted on LVSA load and line loss (Lu et al., 2018; Hongyu and Jianfeng, 2020), power consumption identification (Qingning et al., 2021; Zhang et al., 2021), and substation area health assessment (Yu et al., 2019). Hongyu and Jianfeng (2020) proposed a line loss analysis method based on a clustering algorithm. According to the correlation of voltage data acquired in the same LVSA, Zhang et al. (2021) estimated the LVSA ownership relationship by calculating the probability that the acquisition equipment identified with each classification. Hu et al. (2017) deduced the power consumption mode of unmonitored stations by clustering the power consumption data on stations and analyzing the relationship between their information. In general, the aforementioned literature studies are based on the specific samples of user behavior as classified data and use the clustering method to establish the user behavior portrait. At present, in the research of clustering in the analysis of users’ electricity consumption behavior, although the clustering algorithm has good maturity and rapidity, there are still some problems, such as general clustering accuracy and low efficiency in dealing with a large amount of data. This study proposes a data-driven method based on the cloud model theory, which can effectively deal with the high-dimensional characteristics and complex computing characteristics of running data. Finally, the concept of a cloud model represented by digital features is abstracted based on a certain number of sample data. Because the specific behavior samples of users are random, they were impossible to reflect the general portrait of user behavior from the universality. At the same time, the labels of user portraits are usually fuzzy, which should be considered in the clustering. In this study, the fuzzy label system is established, the fuzzy set generated by reverse cloud transformation is used, and the fuzzy object is benchmarked with the fuzzy label by using the fuzzy concept fit method so as to realize the generation of the image of the operation behavior of each component of the distribution network. This study presents a data-driven construction method of the distribution network operation image based on a cloud model, which can effectively extract the general operation characteristics of the distribution network. The proposed method can quantitatively reflect the general operation effect of the distribution network based on operation data, identify the shortcomings of distribution network operation, and play an important role in improving the quality and economy of distribution network operation.
In this study, a portrait construction scheme is established to describe MVDN and LVSA (LI et al., 2010; Song et al., 2019).. First, indexes of characteristics that can express the operation behavior of distribution feeders and LVSA are defined. A group of typical indexes are defined as the template of labels and expressed in fuzzy manners. The second step is sample collection. The indexes in the day period are treated as a sample, and the operation characteristics are represented in the day period. Characteristic indexes are extracted from operation data in the day period of the practical distributions. Multiple samples can be obtained from data on the whole history days. Then, the samples are regarded as cloud droplets and input to the reverse cloud generator to get the parameters of the cloud model, namely, the common indexes of all samples. Last, the fuzzy distance between the obtained cloud model parameters and the template is calculated, through weighted summation to obtain the grades of the operation status, and the grades are used as portrait descriptions of the distribution networks. Clearly, the grades are with exact physical meaning and objective basis. The main innovations of this study are as follows:
(1) A data-driven method to extract the operation portrait of distribution networks based on the cloud model is proposed. The daily operation index of the distribution network is characterized as cloud droplets, and a group of droplets are statistics using the reverse cloud algorithm to obtain the general index of the distribution network.
(2) The fuzzy distance is used to measure the closeness between the practical index of distribution networks and a given label template, and the portraits expressed in grades to evaluate the distribution network can be calculated through fuzzy distance.
(3) Multi-dimensional characteristics of the daily sample are established with which to represent the operation quality of the distribution network.
2 Label Template Construction of the Medium Voltage Distribution Network
2.1 Index of the Medium Voltage Distribution Networks
2.1.1 Power Consumption indexes of the Low-Voltage Station Area
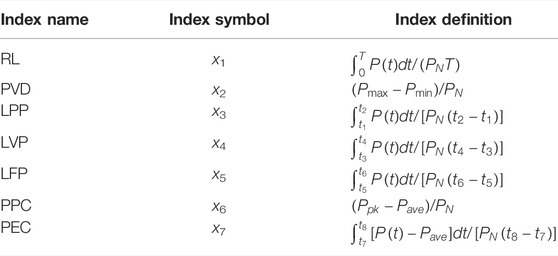
The power consumption indexes of the LVSA are analyzed in the day period and expressed by a characteristic vector reflecting daily power consumption features. The indexes should not only ensure completion but also the redundancy minimized. The completeness is to ensure that indexes can distinguish various load waveforms. Referred to the studies by Lu et al. (2018); Hongyu and Jianfeng (2020); and Zhang et al. (2021), this study uses the ratio of loading (RL), the ratio of peak and valley difference (PVD), the ratio of loading in peak period (LPP), the ratio of loading in valley period (LVP), and the ratio of loading in flat period (LFP) as the power consumption index of the LVSA. Moreover, considering the peak load getting larger in recent years, this study uses the ratio of peak power contribution (PPC) and the ratio of peak energy contribution (PEC) to reflect the contributions of the LVSA to the peak loads. See Table 1 for the definition of each index. Here, P(t) is the power at time t, PN, Pmax, Pmin, Ppk, and Pave are the power of rated, maximum, minimum, and average of daily load in the LVSA, respectively, and t is the duration of the whole day, t1, t3, t5, and t7 are the start time of daily moments of peak load, valley load, flat load, and top load, respectively, and t2, t4, t6, and t8 are the end moments of those. RL is the ratio of LVSA real consumed energy in a day divided by energy consumption in the installed capacity. PVD reflects the varying peak and valley powers of a day. LPP, LVP, and LFP reflect the power consumption in peak, valley, and flat periods. PPC uses the maximum power in the peak period excluding the average power of the LVSR to reflect the power contribution to the top loads. PEC reflects the contribution of the LVSR to top energy consumption. The power consumptions are different in regions, grids and seasons; the peak, valley, and flat moments are different correspondingly. For example, in the summer of Hebei province, 0:00–8:00 are valley periods, and 12:00–18:00 are peaks, and other periods are flats.
2.1.2Loading Indexes of MV Feeders
The loading of distribution feeders is vital to evaluate the construction and operation of the MVDN. Operation indexes of distribution feeders are mainly affected by the consumption behavior of the LVSA’s connect to it. In order to reflect the operation characteristics of MVDN, this study establishes the portraits of distribution feeders in addition to the LVSAs.
In this study, the ratio of average loading (AL), the ratio of heavy loading (HL), the ratio of light loading (LL), the ratio of energy transferred (ET), and the time of loading violation (TLV) are selected as the characteristic indexes of distribution lines, and the functional attributes of distribution lines are considered. The definitions of indexes are shown in Table 2. The AL reflects the utilization rate of the MVDN feeders. The HL and LL reflect the extreme state of the feeder loads. ET refers to the active energy transmitted by the line in 1 day. TVL means the times that the line loading violates the threshold.
In Table 2, S(t) and P(t)are the apparent power and active power of the line at time t. SN, Smax, and Smin are the rated, maximum, and minimum apparent power of the line, respectively, K is the number of times the line loading violate the threshold, and T0 is the acquisition interval of data.
2.2 Label Templates and Fuzzy Disposals
Characteristic indexes defined in Tables 1, 2 reflect the operation of LVSA and feeder loading of MVDN and can be calculated through the daily operation data on the MVDN. However, the characteristic indexes can give only the quantity, lack of direct understanding of the index value in conceptual levels. The labels are the conceptual meanings given to the indexes in different values. Label templates are aggregations of normalized labels.
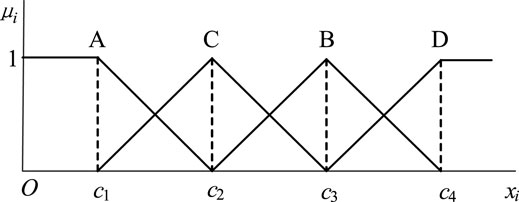
The indexes established in Tables 1, 2 have different attributes. Among these, RL, LVP, and LFP are benefit indexes. The indexes tend to be better with greater values. PDV, LPP, PPC, and PEC are cost indexes. The indexes tend to be better with fewer values. Each index should be equally divided into four levels according to the possible value of the index; the levels are labeled with “A, B, C, and D”. This process has provided the value segment of indexes with meanings and therefore implemented the construction of label templates according to the index values. Obviously, the labels are with the fuzzy attribute, and it is necessary to translate labels into fuzzy expressions. The typical membership functions include rectangular, triangular, and trapezoidal piecewise linear functions. This study adopts a triangular distributed membership function. For benefit indexes, the membership distribution of labels is shown in Figure 1. For cost indexes, the membership distribution of labels is shown in Figure 2. In Figure 1 and Figure 2, x is the index value, and b1∼b4 are the segment points of the membership functions of benefit indexes. Here, c1∼c4 are the segment points of the membership functions of cost indexes. The membership functions of benefit indexes are shown in Eq. 1 through Eq. 3. Cost indexes are similar to Eq. 1 through Eq. 3. Details are neglected。
The parameters of the membership function are usually determined subjectively or objectively. The competent method is determined according to the scores of experts. The results depend on the experience of experts and are subjective. The objective strategy gives determination through experiments or measurements. In this study, the objective strategy is used to determine the membership function. The MVDN operating platform records a large amount of operating data. Certain historical data of the typical MVDN are selected as statistical samples, and the indexes of statistical samples are calculated, respectively, and these index data are sorted in descending orders. The membership parameters b1∼b4 or c1∼c4 are determined of each index according to the percentages shown in Table 3.
3 Uncertainty Modeling of the Medium Voltage Distribution Network Based on Reverse Cloud
3.1 Principle of the Cloud Model
Cloud model theory (Wu et al., 2016) is a tool to uncertain transformation mutually between the data samples and the concept domain based on fuzzy theory and probability theory. In some cases, the large quantitative historical samples can be obtained, but the general rule cannot be obtained directly, while in other cases, the exact historical samples cannot be obtained and can only be described qualitatively in conceptual fuzzy language. The cloud model is a method to realize the mutual generation of fuzzy qualitative concepts and accurate numerical samples. The samples are called cloud droplets, and the concepts deduced from the droplets are characterized by cloud model parameters. The cloud model consists of three parameters, Ex, En, and He, respectively. Ex is the expectation of the cloud, which reflects the center of gravity of the collected cloud droplets, and is composed of the points that can best represent the qualitative concept in the number domain space. En is the entropy of the cloud and represents the uncertainty of the cloud concept. It is the measurement of fuzzy and random concepts. Also, He is hyper entropy, and it represents the dispersing property of a concept.
The normal cloud model is predominating in expression and applications, which is developed from the basis of normal distribution and fuzzy membership function. It is universal and is the most widely used form of the cloud model. The conversion algorithm of the cloud model is called cloud generator (CG), which includes a forward cloud generator and a reverse cloud generator. The process of generating a specific number of cloud droplets from the given cloud model parameters is called the forward cloud generator. The process of inducing qualitative concepts from the cloud droplet set is called the reverse cloud generator. As shown in Figure 3, the reverse cloud generator is a conversion algorithm from quantitative samples to a qualitative concept and abstracts the cloud model represented by features based on the sample data.
The input of the reverse cloud generator is the quantitative value of N cloud droplets and the uncertainty
(1) The sample mean
(2) Expectations are calculated as follows:
(3) The entropy is calculated according to Eq. 6;
(4) The hyper entropy is calculated according to Eq. 7.
3.2 Sample Modeling of the Medium Voltage Distribution Network and Low-Voltage Station Area With the Cloud Model
The operation of the MVDN is uncertain and changes with seasons and other external conditions. It is difficult to properly describe the operation characteristics in different situations. In this study, the portrait models of MVDN with different time scales are established, the yearly portrait is used to represent the MVDN characteristics of a year, and the quarterly or monthly portrait is used to represent the characteristics on the time scale of a quarter or month, and the portraits of the MVDN with different time scales are established. This study adopts the cloud model data-driven method. The historical samples are used in multi-time domain samples such as year, quarter, and month as the data source. Portraits of different time scales need to be driven by corresponding historical operation data. Year portraits are established with historical year data. Quarterly or monthly portraits can also be established with quarterly or monthly data. The steps of establishing models with different time scales based on the cloud model data-driven method are as follows:
(1) Construction of the sample sequence. Let the sample sequence be analyzed as
(2) Calculation of the index value of the samples. For each sample of the sample sequences, the index
(3) Calculation of the cloud model parameters. The values
(4) Calculation of the membership of the cloud model
(5) Steps Eqs 3, 4 are repeated to obtain the fuzzy concept
The processes mentioned earlier for MVDN indexes are also applicable to LVSAs. LVSA data can be used to establish the LVSA indexes with the same process mentioned earlier.
4 Behavior Portrait of the Medium Voltage Distribution Network
In Section 2, label templates are established for each index, which provides a reference system for the evaluation of label attributes of the MVDN. In 3.2, by using the reverse cloud generator, a statistical and fuzzy description of MVDN is summarized. This section provides the matching of the label to the cloud model to realize the MVDN mapping.
Let the label template be represented in a fuzzy power set
The distance
where
According to Eq. 10, the score of concept B can be obtained. The meaning of the score is to represent the ranking of the operation level of the MVDN in the general statistical sense and can also qualitatively represent the “A, B, C, and D” levels. The scores of all indexes are calculated according to Eq. 10 to obtain the portrait of the MVDN for all indexes.
The operation of MVDN is random and uncertain; therefore the established portraits are also dispersed. The more the MVDN operation is uncertain, the disperser the portraits are. The cloud model parameters can describe the uncertainty of MVDN operation. In this study, the variance is used to represent the uncertainty of the MVDN. According to the cloud model, the variance is calculated as Eq. 13.
5 Example Analysis
5.1 Case 1
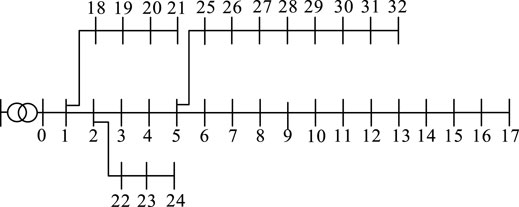
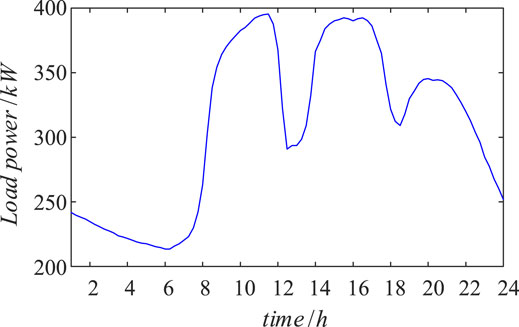
The example of the IEEE 33-node power network is used, and the LVSA portraits are taken as an example for analysis. The structure of the IEEE 33 MVDN is shown in Figure 4. The rated capacity of the LVSA is 400kVA, and the rated capacity of the feeders is 6MVA equally. A total of 2,190 days of load data from 1 January 2009, to 31 December 2014 were used with 96 per day. However, 33 sets of day load data were randomly obtained as typical load curves for 33 LVSAs. For example, the day load curve for LVSA 1 is shown in Figure 5. The day load of 33 LVSAs was calculated, and seven sets of the index were obtained for each station. The index of LVSA 1 is in Table 4 limited to the length of the study; the rest of the LVSAs are not listed. A random number is selected with the same probability from the range of −15% ∼ +15% for indexes of LVSAs. Then, 3,000 sets of data were obtained from LVSA and from 3,000 samples or cloud droplets. The membership parameters of benefit and cost indices are obtained by sorting 3,000 sets of sample data and 99,000 sets of sample data from 33 LVSAs in each area according to Table 3, as shown in Table 4.
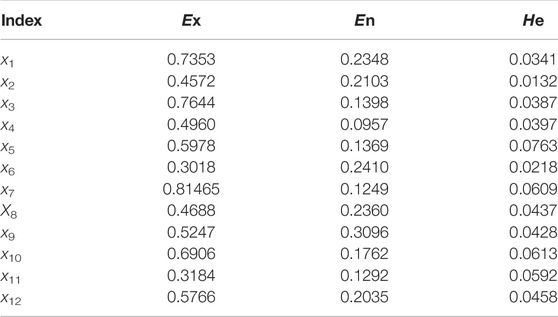
Input 3,000 samples randomly generated from each LVSA to the cloud model of the reverse cloud generator. The cloud model parameters for each index of LVSA 1 are obtained as shown in Table 5. Similarly, the cloud model parameters of the whole distribution network can be obtained, as shown in Table 6.
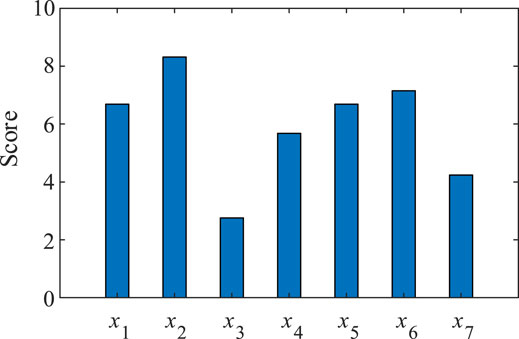
By substituting the aforementioned data into the Eqs 9, 10, the score of indexes for LVSA 1 (node 1) is obtained, as shown in Figure 6. Similarly, we can get the score of each index of other LVSAs.
5.2 Case 2
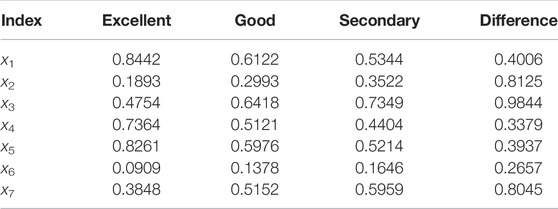
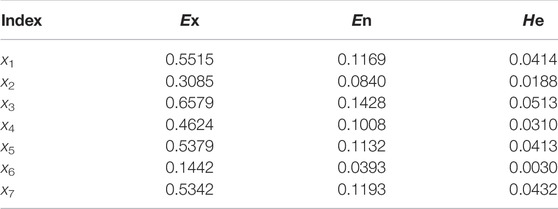
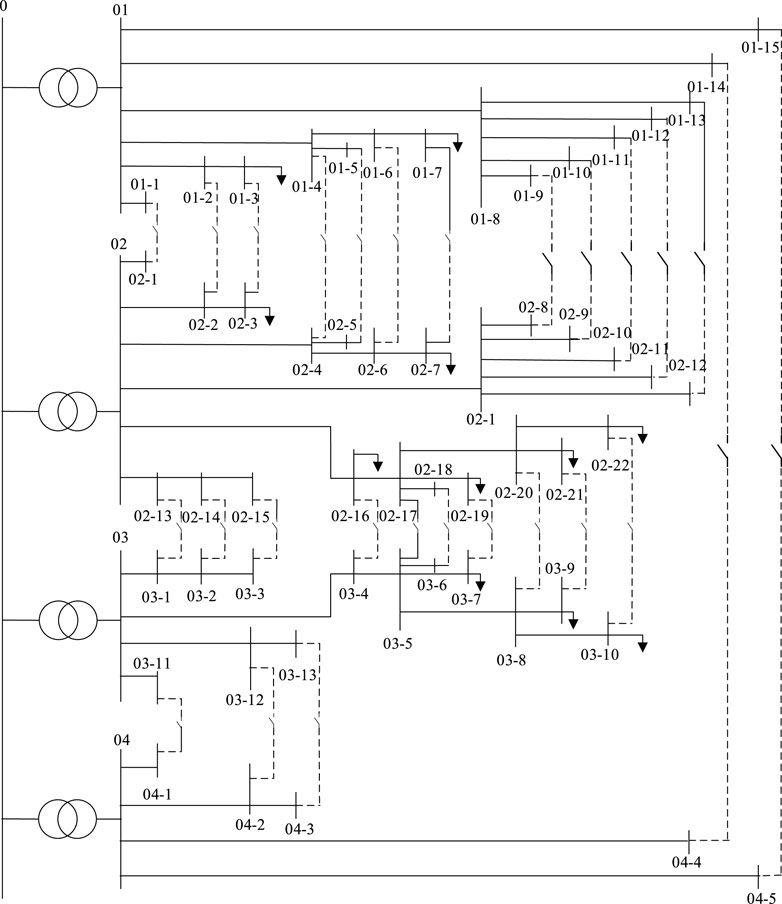
Taking an actual distribution network in Hebei as an example, the algorithm in this study is tested by monitoring and recording data of the actual distribution network. The structure of the actual distribution network is shown in Figure 7, which contains 60 LVSA and 40 lines. The SCADA system of the distribution network monitors and records the operation data of each LVSA and each line in real time, and the data interval is 15 min. Due to the limited monitoring data, this study only constructs the annual portrait based on the recorded data of LVSA and MV feeders from January to 1 December 2021, with a total of 21,600 group LVSA group station samples and 14,600 group feeder characteristic samples. The LVSA sample data and feeder sample data are input into the cloud model as cloud droplets, respectively, and the general operation status of each station area and line of the distribution network, that is, the portrait of the distribution network, is obtained. The parameters of the distribution network cloud model obtained in this example are shown in Table 7. According to the cloud model parameters and a standard template, the scores of each index of the distribution network can be obtained, as shown in Table 8.
It can be seen that the proposed scheme is able to construct portraits of the MVDN. Since the reverse cloud is used for data-driven operation modeling, the portrait-making processes are effective and depict the MVDN in detail. Based on the label templates, index portraits are characterized in grade, which can make the portraits more detailed.
6 Conclusion
This study presents a data-driven construction method of the distribution network operation image based on the cloud model and draws the following main conclusions: 1. it can effectively extract the general operation characteristics of the distribution network in different time scales; 2. calculate the fuzzy distance between the label template and the fuzzy set of the general running state generated by the cloud model and get the portrait parameters expressed by the characteristic values, which have clear physical meaning. The proposed method can quantitatively reflect the general operation effect of the distribution network based on the operation data, identify the shortcomings of distribution network operation, and play an important role in improving the quality and economy of distribution network operation. This study gives a variety of characteristic operation portraits of LVSAs and feeders, which are characterized by scores. However, how to cluster LVSAs and feeders according to general operation portraits and find the weak points of distribution network operation should be further studied. The mechanism on how to apply the distribution network portrait method proposed in this study to the distribution network management system needs to be studied. This study evaluates the running status of LVSAs and feeders by scoring, but the selection of the scoring system depends on the statistics of running big data and is influenced by statistical data with diversity and subjectivity.
Data Availability Statement
The original contributions presented in the study are included in the article/Supplementary Material; further inquiries can be directed to the corresponding authors.
Author Contributions
JL: work concept or data collection; HF: preparation, creation, and presentation of the published work, specifically writing the initial draft (including substantive translation); TL and XH: model design and simulation and statistical, mathematical, and computational applications; LW and SJ made revisions to the study, critical review, commentary, or revision—including pre-publication stages.
Funding
This work was supported in part by the Technology Project of State Grid Hebei Electric Power Company Ltd. (kj2021-001) and in part by the S&T Program of Hebei (20314301D).
Conflict of Interest
Authors JJ, TL, XH, and LW were employed by the company Electric Power Research Institute of State Grid Hebei Electric Power Supply Co., Ltd. Authors HF and SJ were employed by the company State Grid Hebei Electric Power Co., Ltd.
Publisher’s Note
All claims expressed in this article are solely those of the authors and do not necessarily represent those of their affiliated organizations, or those of the publisher, the editors, and the reviewers. Any product that may be evaluated in this article, or claim that may be made by its manufacturer, is not guaranteed or endorsed by the publisher.
References
Akhavan-Rezai, E., Haghifam, M.-R., and Fereidunian, A. (2009). Data-driven Reliability Modeling, Based on Data Mining in Distribution Network Fault Statistics. IEEE Buchar. PowerTech, 16. doi:10.1109/PTC.2009.5281796
Bertoldi, P., and Atanasiu, B. (2011). An In-Depth Analysis of the Electricity End-Use Consumption and Energy Efficiency Trends in the Tertiary Sector of the European Union. Int. J. Green Energy 8 (3), 306–331. doi:10.1080/15435075.2011.557843
Chen, T., Chen, J., Zhang, k., Shu, F., and Chen, S. (2020). Research on Power Consumption Behavior Analysis Based on Power Big Data, In Proceedings of the IEEE 9th Joint International Information Technology and Artificial Intelligence Conference (ITAIC) 11-13 Dec. 2020, 591–594. doi:10.1109/ITAIC49862.2020.9338788
Guan, W., Zhang, D., Yu, H., Peng, B., Wu, Y., Yu, T., et al. (2021). Customer Load Forecasting Method Based on the Industry Electricity Consumption Behavior Portrait. Front. Energy Res. 9, 742993. doi:10.3389/fenrg.2021.742993
Hu, H., Wang, Y., Han, J., Zhang, Y., and Yan, Q. (2021). Analysis of User Power Consumption Characteristics and Behavior Portrait Based on KS-RF Algorithm. IEEE/IAS Industrial Commer. Power Syst. Asia (I&CPS Asia), 1586–1590. doi:10.1109/ICPSAsia52756.2021.9621677
Hongyu, A., and Jianfeng, Z. (2020). Research on Auxiliary System of Big Data Abnormality in Station Area Line Loss under Smart Grid. In Proceedings of the IEEE Conference on Telecommunications, Optics and Computer Science (TOCS), 10-11 Dec. 2021, 199–202. doi:10.1109/TOCS50858.2020.9339625
Hu, M., Zheng, H., Wang, W., and Guo, Y. (2017). Estimate Health Condition of Power Supply at Base-Station Sites Based on Alarm DataProceedings of the 7th IET International Conference on Wireless, 7th: 2017, Beijing, China. Mobile & Multimedia Networks, 7–12. doi:10.1049/cp10.1049/cp.2017.0586
Jin, L., Liu, W., Wang, X., Yu, J., and Zhao, P. (2021). Analyzing Information Disclosure in the Chinese Electricity Market. Front. Energy Res. 9, 655006. doi:10.3389/fenrg.2021.655006
Li, X., Qian, X., and Qian, J. (2010). A Classifying and Synthesizing Method of Power Consumer Industry Based on the Daily Load Profile[J]. Automation Electr. Powe Syst. 34 (10), 56–61. in Chinese.
Liu, Y., Yang, X., Wen, W., and Xia, M. (2021). Smarter Grid in the 5G Era: A Framework Integrating Power Internet of Things with a Cyber Physical System. Front. Comms. Net. 2, 689590. doi:10.3389/frcmn.2021.689590
Lu, S., Jiang, H., Lin, G., Feng, X., and Li, Y. (2018). Research on Creating Multi-Attribute Power Consumption Behavior Portraits for Massive Users. In Proceedings of the International Conference on Power and Energy Systems (ICPES), 54–59. doi:10.1109/ICPESYS.2018.8626971
Nasaruddin, H. H., and Muhibbuddin, M. Z. (2021). A Critical Review of the Integration of Renewable Energy Sources with Various Technologies[J].Prot. Control Mod. Power Syst. 6(1), 37–54.
Qingning, P., Xutao, L., Feihu, H., Jin, M., and Kaimin, S. (2021). Consumers' Phase Identification in Low Voltage Station Area Based on Wavelet Analysis of Consumption Data. IEEE Int. Conf. Power, Intelligent Comput. Syst. (ICPICS), 346–350. doi:10.1109/ICPICS52425.2021.9524193
Ran, Li., Gu, C., and Li, F. (2015). Development of Low Voltage Network Templates-Part I :Substation Clustering and Classification[J].IEEE Trans. Power Syst. 30(6):3036- 3044.
Song, J., He, C., and Li, X. (2019). Daily Load Curve Clustering Method Base on Feature Index Dimension Reduction and Entropy Weight Method[J]. Automation Electr. Powe Syst. 43 (20), 65–72. in Chinese.
Wu, A. Y., Ma, Z. G., and Zeng, G. P. (2016). Set Pair Fuzzy Decision Method Based on Cloud Model. Chin. J. Electron.. doi:10.l049/cje.2016.03.00410
Wang, Y., Chen, Z., Xu, Z., Gang, G., and Lu, J. (2018). User Electricity Consumption Pattern Optimal Clustering Method for Smart Gird, In Proceedings of the IEEE International Conference on Signal Processing (ICSP), Location: Beijing, China, 567–570. doi:10.1109/icsp.2018.8652346
Wu, Y., and Li, H. (2019). Additive Model for User Electricity Consumption Behavior Analysis, In Proceedings of the IEEE 4th Advanced Information Technology, Electronic and Automation Control Conference (IAEAC), 20-22 Dec. 2019, Chengdu, China, 2019, 1703–1707. doi:10.1109/IAEAC47372.2019.8997882
Yu, Z., Liu, L., Chen, C., Zhang, W., Ju, X., and Zhang, L. (2021). Research on Situational Perception of Power Grid Business Based on User Portrait. Proceedings of the IEEE International Conference on Smart Internet of Things (SmartIoT), Aug. 14 2020 to Aug. 16 2020, Beijing, China, 2019, 350–355. doi:10.1109/SmartIoT.2019.00061
Zhang, S., Zhu, H., Li, C., Liu, T., Zang, Y., and Xing, Y. (2021). Research on Intelligent Calculation Method of Theoretical Line Loss in Station Area, In Proceedings of the 2021 IEEE International Conference on Computer Science, 20-22 Aug. 2021. Electronic Information Engineering and Intelligent Control Technology, 129–132. doi:10.1109/CEI52496.2021.9574456
Keywords: distribution networks, portrait, data-driven, cloud model, fuzzy distance
Citation: Liang J, Li T, Fan H, Hu X, Wang L and Jiang S (2022) Construction of Operation Portraits Based on a Cloud Model for Power Distribution Networks. Front. Energy Res. 10:872028. doi: 10.3389/fenrg.2022.872028
Received: 09 February 2022; Accepted: 25 April 2022;
Published: 08 June 2022.
Edited by:
Xi Chen, Global Energy Interconnection Research Institute, ChinaReviewed by:
Longfei Wei, Hitachi America Ltd., United StatesOleg Zolotarev, Russian New University, Russia
Zhongping Ji, Hangzhou Dianzi University, China
Copyright © 2022 Liang, Li, Fan, Hu, Wang and Jiang. This is an open-access article distributed under the terms of the Creative Commons Attribution License (CC BY). The use, distribution or reproduction in other forums is permitted, provided the original author(s) and the copyright owner(s) are credited and that the original publication in this journal is cited, in accordance with accepted academic practice. No use, distribution or reproduction is permitted which does not comply with these terms.
*Correspondence: Jifeng Liang, c2p6bGlhbmdqZkAxNjMuY29t; Xuekai Hu, MTEwMzEzODM0NUBxcS5jb20=
 Jifeng Liang1*
 Xuekai Hu