 Qiyuan Cai
 Han Chen
 Kangli Xiang
 Changyong Lin
 Wei Wu
- 1Economic and Technological Research Institute, State Grid Fujian Electric Power Co., Ltd., Fuzhou, China
- 2Collaborative Innovation Center for Energy Economics and Energy Policy, School of Management, China Institute for Studies in Energy Policy, Xiamen University, Xiamen, China
The reduction of general industrial and commercial prices is an important measure to further improve the business environment and stimulate market vitality. It is of great significance to study the impact of general industrial and commercial electricity price adjustment on the economy for promoting electricity price reform. Based on the policy of adjusting the general industrial and commercial electricity price issued by relevant national departments and provincial governments, this study takes Fujian province as an example and uses the provincial CGE model to analyze the impact of the reduction of the general industrial and commercial electricity price on the macro economy, the output and producer price of various industries, and the electricity consumption. The simulation results show that the reduction of general industrial and commercial electricity prices has a positive impact on the economy. A 25% cut in electricity prices increases GDP by about 0.0935%. The reduction in electricity prices promoted the growth of output and producer prices of most industries. In addition, the reduction of electricity price has a positive effect on the total social electricity consumption, among which the tertiary industry saw the biggest increase in electricity consumption. Based on the simulation results, the policy suggestions are put forward.
1 Introduction
The power industry is an important basic industry in the national economy. Electricity is an important factor input of the national economy. In the modern economic system, electric energy, as the basic energy input, will have a far-reaching impact on various industries. Therefore, the electricity price has long been fixed and strictly controlled by the government in China, contributing to a stable level of overall prices and the steady growth of the economy (He et al., 2010). In recent years, the energy consumption per unit GDP has constantly been increasing with the rapid development of China’s economy and society. The demand for electricity is also increasing, which proposes a higher requirement for the development of the electric power industry. With China’s economy entering a new normal and the deterioration of the external environment, the economic growth rate has declined. In order to reduce the production and operation costs of enterprises and help the development of the real economy, China’s general industrial and commercial electricity prices have experienced several rounds of downward adjustment in recent years.
The “Report of the State Council on 2018” puts forward the goal of “reducing power grid link charges and transmission and distribution prices, and reducing the average industrial and commercial electricity price by 10%.” Subsequently, the National Development and Reform Commission issued several documents to reduce the general industrial and commercial electricity prices. Various provinces (autonomous regions and municipalities directly under the Central Government) successively lowered the general industrial and commercial electricity price. In the “Report of the State Council on 2019,” Premier Li Keqiang further proposed to promote the reduction of enterprise-related charges through reform, deepen the reform of electricity marketization, clean up the additional charges of electricity prices, reduce the electricity cost of manufacturing industry, and reduce the average electricity price of general industry and commerce by 10%. In order to coordinate epidemic prevention and control with economic development, the government has adopted policies to encourage enterprises to resume work and production and tide over the difficulties together. In 2020, the National Development and Reform Commission (NDRC) proposed that power grid enterprises should uniformly charge the electricity fee of power users (except users in high-energy-consuming industries) who use general industrial and commercial prices, other prices, and large industrial prices for price settlement at 95% of the original price. In 2021, the National Development and Reform Commission proposed to promote industrial and commercial users to enter the market and encourage local governments to implement phased preferential policies for electricity consumption by small and micro enterprises and individual industrial and commercial households.
The downward adjustment of electricity prices in 2018–2020 has reduced the pressure on the real economy to a certain extent. However, the electricity sales revenue reduced by electricity price adjustment needs to be borne by a certain subject eventually. According to the current policy, the cost of reducing the general industrial and commercial electricity price is mainly borne by the government, the power grid side, and the power generation side (Moerenhout et al., 2019; Ohler et al., 2020).
In 2018, after introducing the policy of reducing electricity prices, the VAT rate of the power industry was adjusted from 17% to 16%, and the national collection standard for major water conservancy project construction funds was reduced by 25%. In 2019, in order to meet the goal of further reducing the general industrial and commercial electricity price by 10%, the National Development and Reform Commission proposed in the Notice on Adjusting the VAT Rate of Power Grid Enterprises to Reduce the General Industrial and Commercial Electricity Price that after the VAT rate of power grid enterprises is adjusted from 16% to 13%, the space for reducing the tax-included transmission and distribution price of provincial power grid enterprises will be used to reduce the general industrial and commercial electricity price. Synchronized with the price reduction, the policies related to the grid side mainly include promoting the reform of the transmission price of regional power grids and special projects across provinces and regions, further standardizing and reducing the grid link charges, temporarily reducing the transmission and distribution price, and so forth. In essence, these policies reduce the income of power grid enterprises and realize the downward adjustment of electricity prices. In addition, with the deepening of the new round of electricity market reform, the proportion of direct electricity trading is expanding, which also forces power generation enterprises to lower their prices and provide space for lowering the general industrial and commercial electricity prices. In addition, with the deepening of the new round of electricity market reform, the market-based pricing mechanism of “base electricity price + floating mechanism” enables the on-grid electricity price formed by market transactions to reflect the real price of electric energy in a timely manner, which reduces the revenue of electricity generation to a certain extent.
As the basic price of the national economy, the change of electricity price will affect not only the power generation, transmission, distribution, and electricity sale departments but also the production, operation, and investment decisions of the upstream and downstream industrial sectors related to the power industry; the total price level; and then the inflation of a country. In addition, for the government, the reduction in electricity sales revenue caused by lowering general industrial and commercial electricity prices should ultimately be borne by the government. Therefore, lower electricity prices will lead to reduced government revenue, which will also have a negative impact on government consumption. For people’s livelihood, the fluctuation of electricity prices will also affect the consumption level of residents (Du et al., 2015; Wang and Lin, 2017a; Sun et al., 2017). Therefore, studying the impact of price changes on the above aspects and analyzing their impact intensity is an important guarantee for the smooth implementation of price reform. It can also provide an important reference for decision-making departments to adjust the price, which is the original intention of this study.
By constructing a computable general equilibrium model, this study analyzes the influence of several price reduction policies. The relevant research conclusions have certain implications for the evaluation of electricity price reduction policies and the design of future electricity price policies. The remainder of this study is structured as follows. Section 2 presents a review of the related literature, followed by the methodology and model construction in Section 3. In Section 4, we describe the simulation results and analyze the impact of general industrial and commercial electricity price increases on the macro economy, output, and producer prices of various industries and electricity consumption. The conclusions and policy implications are presented in Section 5.
2 Literature Review
Electricity price fluctuation belongs to the category of energy price fluctuation. The impact of energy price changes has been of great concern to the international community. As the lifeblood of the national economy, oil is the most important input in the production process of an economy. Therefore, most early research studies focused on oil price shocks or fluctuations. By using the VAR method to test the data of oil price, GNP, and unemployment after World War II, Hamilton (1983) found that oil prices led every economic recession after World War II except for the one in 1960. Following the work by Hamilton (2003), Jiménez-Rodríguez and Sánchez (2005), Zhang (2008) and Rafiq et al. (2009) adopted different methods to investigate the connection between oil price shock and economic growth and found that oil price shocks have a negative impact on the economy. The study of Rehman (2018) indicated that the economic policy uncertainty of developed and developing countries responds to the global oil price shock. Zhu et al. (2021) examined the time-varying impacts of oil prices on China’s nonferrous metals industry, finding that the impact is positive in the short term but diverse in the long term. Fan et al. (2021) found that the impact of oil price uncertainty on the corporate leverage of Chinese listed companies had been enhanced with the advancement of market-oriented reform of refined oil pricing.
In recent years, the impact of electricity price adjustment has also aroused great concern, and many studies have been carried out at home and abroad. Dale (2004) estimated the impact of electricity price changes on water supply mode and cost in urban areas of Southern California and found that high electricity prices contributed to residents’ preference for water-saving and electricity-saving equipment. Kumar (2005) analyzed the response of Indian residents to electricity price changes and pointed out that reasonable electricity price adjustment would help improve energy efficiency. Nguyen (2008) took Vietnam’s electricity price as an example to study its impact on the marginal cost of other products. The results indicated that when the price was equal to long-term marginal cost, the price of all other goods would also increase, but the overall price level did not rise significantly. Silva et al. (2009) analyzed the social and environmental impacts of the electricity price increase in Montenegro, which would impose heavier burdens on poor residents and have a negative impact on the environment. Moerenhout et al. (2019) investigated commercial and industrial consumers’ perspectives on electricity pricing reform in India and found that the increment in electricity price was likely to induce a decrease in the output and the overall labor and machine productivity. Based on the micro data of manufacturing enterprises in Hunan province, Yang et al. (2021) studied the economic effect of differential electricity price (DEP) policy using the difference method and the discrete-time risk model. They found that the DEP policy reduced employment but had little influence on fixed assets and the probability of exiting the market. With a micro model, Wang and Lin (2021) estimated the changes of welfare and redistribution under different scenarios to explore an electricity price scheme that is effective in welfare redistribution and subsidy reduction.
As a powerful policy simulation tool, computable general equilibrium (CGE) models are widely and extensively applied in policy evaluation of the electric industry, including the standard CGE model and extended CGE model. Based on CGE models, He et al. (2010) analyzed the impact of coal price adjustment on the power industry and the impact of electricity price adjustment on China’s macro economy, respectively. They found that the increment in electricity price has adverse effects on the Gross Domestic Product (GDP) and the Consumer Price Index (CPI), as well as a contractionary effect on economic development. He et al. (2011) simulated the impact of electricity price adjustment on electricity demand under the framework of the CGE model and obtained the electricity price elasticities of different categories of electricity users. With the CGE model including environment and energy, Zhang (2014) assessed the realistic impact of step tariff policy on the macroeconomic from the perspective of commodity price, economic growth, and import and export trade. Bhattacharayya and Ganguly (2017) used the CGE model to evaluate the impact of reducing cross-subsidies from industry to agricultural electricity on the Indian economy. The results indicated that the removal of cross-subsidies would lead to a decline in rural household income, whereas replacing cross-subsidies with progressive tax rates would only make up a small part of the negative impact of income decline. Wang et al. (2019) established a dynamic recursive computable general equilibrium (CGE) model to evaluate the impact of different electricity production taxes on the economy, energy, and environment of China, finding that the output of the coal industry is the most sensitive to electricity tax, and increasing electricity tax will directly increase electricity price. Wang et al. (2020) analyzed the impact of electricity price subsidies on economic development, energy consumption, and carbon emission reduction by simulating the increase of biomass price electricity price subsidies with CGE models. Zhang et al. (2021) used the CGE model to explore how China can deregulate electricity prices in two stages in the context of the implementation of carbon pricing in the power sector. With the deepening of our country’s power system reform, reducing general industrial and commercial electricity prices has become a realistic path to solve the problem of cross-subsidization of electricity prices and promote economic growth. Wang and Lin (2017b) adopted a price-gap approach to estimate the scale of electricity subsidy with or without external costs in China, indicating that the current subsidy is substantial. They believed that the sound electricity tariff subsidy and initiate subsidy-reducing strategies should be designed to improve efficiency and equality. Moreover, the price reduction space generated by the reform of the electricity market should be used to reduce large-scale industrial and general industrial and commercial electricity prices. Lin et al. (2021) simulated the effect of an electricity price decline by constructing a general equilibrium model. The results show that the decline in electricity price will reduce product prices in other sectors to varying degrees, increase sectoral output, and increase income to residents and enterprises level. Therefore, reducing the electricity price of industrial and commercial enterprises through the reform of transmission and distribution prices and market-oriented transactions not only responds to the requirements of supply-side structural reform to reduce costs but also drives the economic growth of various regions.
As can be seen from the research review, domestic and foreign scholars have conducted abundant studies on the relationship between energy prices, including electricity price, and the economy. However, due to the differences in the system and structural framework between the power sector and other economic sectors, as well as the energy endowments and economic conditions of different countries, there are differences in the policy implementation and research methods of different countries, and the research conclusions of the literature cannot be unified. Existing research on the impact of electricity price adjustment mostly focuses on the impact of electricity price rise on the macro economy, environment, and industrial structure. In contrast, rare studies focus on the economic effect brought by electricity price reduction. Therefore, this study takes Fujian province as an example to study the economic impact of general industrial and commercial electricity price reduction policies, in order to provide a reference for future design of electricity price policies.
3 Methodology
3.1 Computable General Equilibrium Model
By constructing a computable general equilibrium model, this study simulates the economic impact of electricity price policy adjustment in Fujian province. The computable general equilibrium model is also the core content in the process of project design. The computable general equilibrium model (CGE) is based on the general equilibrium theory, which can be widely used in the fields of resources and environment, finance and taxation, international trade, energy, and climate change, and has become one of the mainstream analysis tools in the field of policy research. The price change of output in one market usually affects other markets, which in turn affects the whole economy. It even affects the price-quantity equilibrium in the original market to some extent. In order to explain this complex relationship in the economy, it is necessary to go beyond local equilibrium analysis and establish a model that can consider multiple markets at the same time. The general equilibrium model is an analytical framework for analyzing the relationships among different markets, industries, resources, and institutions. In the past, due to the insufficiency of data and the limitation of computing power, the application range of general equilibrium analysis methods was limited. However, with the rapid development of computer computing capability, the general equilibrium model develops toward computability.
Combined with the characteristics of the provincial economy, the provincial CGE model is constructed, and its structure is shown in Figure 1. The production department is the main body of production activities, which buys intermediate inputs from commodity markets and obtains capital and labor inputs from factor markets. The output of the production department flows into the commodity market in the form of production in the province, while the factor reward it receives is distributed to the factor market.
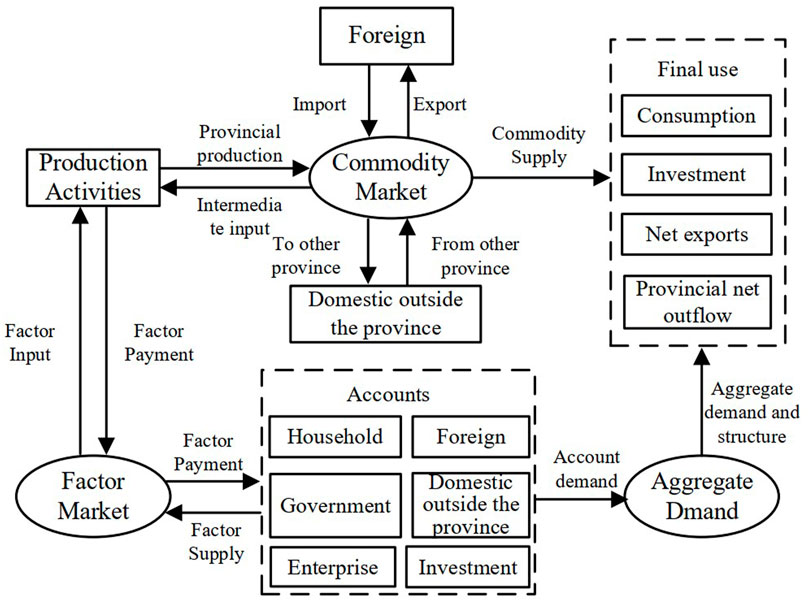
FIGURE 1. Provincial CGE model structure.
In the commodity market, besides the products produced in the province, there are also import and export trade and inter-provincial trade with domestic and foreign markets. The output of the commodity market finally supplies consumption, investment, net exports, and inter-provincial net outflow.
In the factor market, factor rewards are paid to various subjects of national accounts, including resident accounts, government accounts, enterprise accounts, external accounts, and domestic and provincial accounts. There are also various payments between accounts. Each account meets the principle of balance between income and expenditure.
The demand for commodities in each account constitutes the total demand. According to the total demand and structure, it constitutes the final use demand. In this way, the CGE model is closed macroscopically.
3.2 Production Function
The production activities of the production department are described by the production function. The production function structure of the CGE model is shown in Figure 2. This project refers to the setting of the mainstream CGE model and adopts the setting of the six-level production function. Among them, in the output function, energy input is separated from intermediate input, and energy is combined with capital and labor input requirements. In the first-level nesting, the inputs in the CES function include “factor-energy” and “non-energy intermediate inputs.” “Factor-energy” is composed of “labor” and “capital-energy.” Non-energy intermediate inputs are calculated according to the Leontief function according to the proportion of different intermediate inputs. “Energy-capital” is composed of “capital” input and “energy” input.
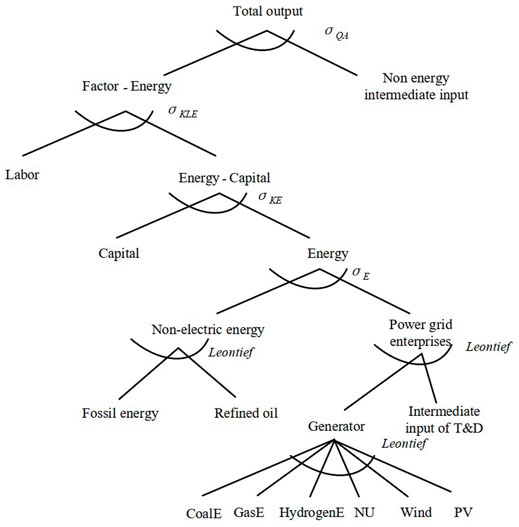
FIGURE 2. Production function structure.
With regard to energy input, the models adopted in this study are divided into non-electric energy input and electric power input. Non-electric energy input includes primary fossil energy input and refined oil input. Different energy varieties within non-electric energy sources are generally difficult to replace. For example, refined oil products are mainly used in transportation fields or used as raw materials for chemical production, which cannot be replaced by other energy sources in a short time. Because the price of refined oil is much higher than that of coal, the demand for coal in industrial fields (such as power generation) is generally not replaced by other fossil energy sources. Therefore, the production function of non-electric energy input is set as a Leontief type.
In order to meet the needs of electricity price policy determination, the CGE model structure is designed with reference to different power input structures in the GTAP database, and the power sector is split. The split power supply consists of intermediate inputs of power generation and transmission and distribution. Because the input of power transmission and distribution is indispensable from power generation enterprises to end users, the production function of power supply is a Leontief type; that is, for every unit of power supplied to the terminal, the ratio of input to power generation and transmission and distribution is constant. The power generation sector is also divided into six kinds of power: coal power, gas power, hydropower, nuclear power, wind power, and photovoltaic. Because the power supply structure will not change greatly in the short term, in the static model, it is assumed that the structural proportions of the six power supplies are unchanged. If the power supply structure changes in the future, it can also be updated by adjusting the structural coefficient of the Leontief function in the power sector.
By taking the total output production function as an example, the CES function's form is shown in Eq. 1. Among them,
According to the properties of the CES function, each variable has the following relationship, where
The forms of CES functions at all levels in the production function are similar to the above formula and will not be introduced here. In addition, for intermediate input, its function form is Leontief type, and its function structure is shown in the following formula, where
In the CGE model, the correction of related parameters is an important work. Generally, the calibration work is based on the initial data of the SAM table, and each parameter value can be obtained by combining with substitution elasticity. The alternative elasticity of this study refers to the methods adopted in the current mainstream research, mainly from the relevant calculation of Qi et al. (2014) and Antoszewski (2019).
3.3 Trade Module
The trade module of the provincial CGE model is more complex than that of the national CGE model. There are two main reasons: first, for the national CGE model, the trade module only needs to consider import and export. For a certain province, besides foreign trade, there is also a large-scale inter-provincial trade, which needs to be considered. Secondly, the traditional CGE model generally divides domestic production into domestic supply and export. For a certain province, there may be much transit trade. For example, the export volume is far greater than the production volume. This may lead to negative domestic supply, which cannot be calculated by the CGE model. Therefore, it is necessary to adjust the trade module.
The trade module of this project is set as shown in Figure 3. Among them, the net outflow of domestic trade is equal to the outflow of domestic provinces minus the outflow of domestic provinces. After deducting the net outflow of domestic trade from the total output of the province, the domestic production supply is obtained. Among these variables, the total output in the province is calculated according to the production function of each department, and the domestic inter-provincial trade is set as an exogenous variable according to the original data of the input-output table. The domestic production supply is distributed to the provincial supply and export using the Armington function. Supply and import in the province are combined into consumption in the province.
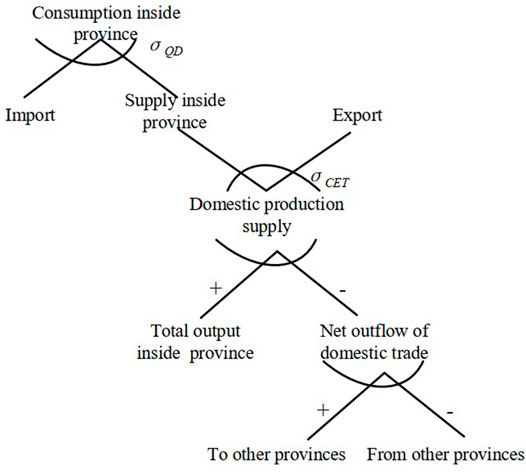
FIGURE 3. Trade module structure.
3.4 Flow of National Accounts
The account of the CGE model constructed in this project corresponds to the SAM table. Besides the commodity and activity account describing commodity production flow and the labor and capital account describing factor supply, there are also six accounts of residents, enterprises, government, foreign countries, other parts of China, and investment. The relationship of each account is shown in Figure 4.
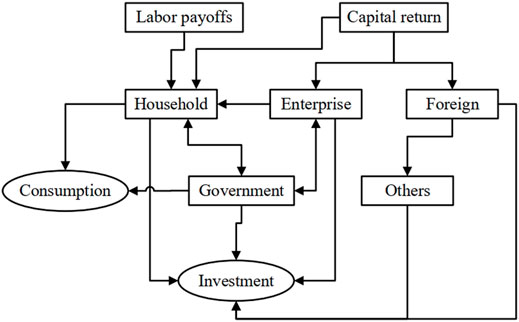
FIGURE 4. Flow direction of each account.
Labor remuneration, as wage remuneration, is totally distributed to residents. The capital reward is distributed to residents, enterprises, and foreign countries according to the nature of owners. Residents’ income is used to pay income tax, household consumption, and household savings. Enterprise income is used to pay income tax and dividends to the government and distribute them to residents. The rest of the enterprise income is used for investment. After deducting government consumption, government revenue is mainly transferred to residents and other parts of China, and the rest is used for investment. The external account is used to purchase export commodities in the province, and the rest includes investment in other parts of the country.
In the final demand, the investment function is calculated according to the Leontief function; that is, the internal structure of the investment product remains unchanged. The consumption function adopts a linear expenditure system function. In the case of maximizing consumer utility, it satisfies the following formula:
After obtaining the first-order optimization conditions of the above formula, the consumption function can be deduced as follows:
4 Simulation Result and Discussion
4.1 Scenario Simulation Settings
Under the background of lowering the general industrial and commercial electricity price, Fujian province has adjusted the electricity price many times in recent years. As early as 2017, Fujian Provincial Price Bureau issued the Notice on Reasonable Adjustment of Electricity Price Structure [Minjiashang (2017) No. 177], which adjusted the general industrial electricity price. After that, in 2018, the Fujian Provincial Price Bureau issued the Notice on the Relevant Matters Concerning the Adjustment of VAT Rate in Power Industry to Reduce Electricity Price of General Industry and Commerce [Minjiashang (2018) No. 115], proposing to appropriately reduce the sales price of general industry and commerce and other electricity consumption catalogs and the transmission and distribution price of general industry and commerce and other electricity consumption in our province. In 2019, the Fujian Provincial Development and Reform Commission further proposed to reduce the sales price of general industrial and commercial and other electricity consumption catalogs in the “Notice on Continued Reduction of General Industrial and Commercial Electricity Prices” [Yufa Change Business Price (2019) No. 318]. Moreover, transmission and distribution prices continue to promote the parallel pricing of industrial and commercial electricity, as well as the adjustment of on-grid tariff including tax for some enterprises due to the reduction of VAT rate. In 2020, the National Development and Reform Commission issued the Notice on Phased Reduction of Enterprise Electricity Costs to Support Enterprises to Resume Work and Resume Production [Development and Reform Price (2020) No. 258] and the Notice on Extending the Policy of Phased Reduction of Enterprise Electricity Costs [Development and Reform Price (2020) No. 994]. The documents stipulate that the users using general industrial and commercial tariffs will be charged 95% of the original price from February 1 to December 31, 2020. After many downward adjustments, the general industrial and commercial electricity prices in 2020 are reduced by 25% compared with those in 2017. In 2021, Fujian province issued a policy to appropriately reduce the “two-part transmission and distribution price for industrial, commercial, and other electricity consumption” and “appropriately reduce the two-part system for industrial, commercial, and other electricity consumption, and the sales price of agricultural electricity catalog.”
Regarding industries with lower electricity prices, the general industrial and commercial electricity price adjustment mainly involves industries with lower voltage levels, such as the light and tertiary industries. Specifically, it includes food and tobacco, cotton, chemical fiber textile, printing and dyeing finished products, other textiles, textiles and clothing, shoes, hats, leather, down and their products, wood processed products and furniture, paper printing, cultural and educational sporting goods, transportation, warehousing and postal services, information transmission, software and information technology services, commerce, accommodation and catering, finance, real estate, business and residential services, public utilities, and residential organizations.
The input-output table is the key to constructing the CGE model. At present, the latest one of Fujian province is the 2017 Input-Output Table of Fujian Province compiled in 2020, with 142 departments. In order to facilitate the construction of the model, the input-output table was merged and split in this study, and the production and supply departments were divided into transmission and distribution departments and six power generation departments. The other departments were merged according to the characteristics of the industry, and the input-output tables of 30 departments were finally obtained, as shown in Table 1. The social accounting matrix (SAM) table is compiled based on the data from China Statistical Yearbook, China Financial Yearbook Fujian Financial Yearbook, and Fujian Statistical Yearbook. Among them, the energy consumption data of each department in Fujian province come from the China Statistical Yearbook. Furthermore, the emission data of the industrial sector come from the China Environmental Statistics Yearbook. In the input-output table of Fujian, the power sector is taken as a whole. To characterize the power sector, we further split the power sector, which first needs to determine the proportion of transmission and distribution costs in the total cost and the cost composition of different types of power sources. In this study, the proportion of transmission and distribution costs in the total cost is obtained by dividing the price of electricity transmission and distribution by the retail electricity price in the “2017 National Electricity Price Regulatory Bulletin” issued by the National Energy Administration. For the cost proportion of different types of power sources, we first calculated the on-grid costs of different power sources using the on-grid tariffs and on-grid rate of different power sources published in the 2018 China Power Yearbook and then calculated the ratio of the on-grid costs of different power sources to the terminal power cost.
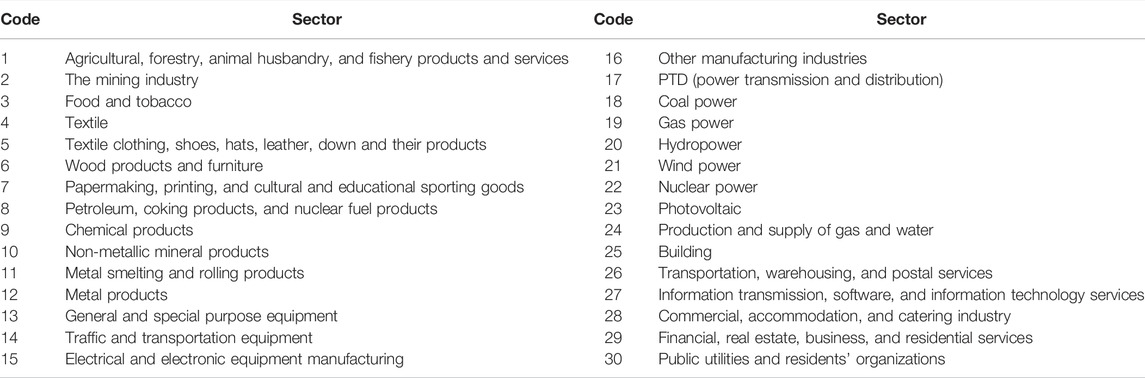
TABLE 1. The settings of 30 sectors in SAM.
4.2 Simulation Results and Analysis
The variation in macroeconomic variables at different reduction ratios of general industrial and commercial electricity prices is shown in Table 2. In the GDP calculated by the income method, the income of factors accounts for a large proportion. The reduction of electricity price reduces the cost of the department, increases the profit margin, and improves the return rate of production factors. Therefore, the reduction of general industrial and commercial electricity prices will lead to the growth in GDP. The higher the proportion of electricity price reduction, the greater the economic growth. When the general industrial and commercial electricity price is reduced by 25%, the GDP will increase by about 0.0935%. From the perspective of income and consumption, affected by the reduction of electricity price, residents’ income and consumption will rise accordingly. When the electricity price is reduced by 25%, the residents’ income will increase by 0.9006%, and their consumption will increase by 0.4562%. In our model, the residents’ physical consumption of various commodities depends on the changes in residents’ income and the prices of corresponding commodities. Under the influence of lowering electricity prices and the reduction of factor income of the power industry, other factor income, such as the return of labor, has increased, resulting in an increase in residents’ total income and a consequent impact on consumption. Similarly, the return on capital increases with the decrease in electricity prices, which leads to an increase in enterprises’ income. Specifically, when the electricity price is reduced by 25%, the enterprises’ revenue increases by 1.2293%. Because the part of electricity sales revenue reduced by the reduction of general industrial and commercial electricity price should be ultimately borne by the government according to the current policy, the reduction of electricity price will lead to the decline of government revenue, which will also have a negative impact on government consumption. Specifically, when the general industrial and commercial electricity price decreases by 25%, the government income decreases by 0.0194%, and then the government consumption decreases by 0.4583%. As can be seen from Table 2, when the electricity price is reduced by 25%, the total net export increases by 0.1083%, which is mainly related to the output level changes of various sectors and the relative changes of domestic commodity prices. Besides, the reduction in general industrial and commercial electricity prices also has a positive impact on foreign income and investment.
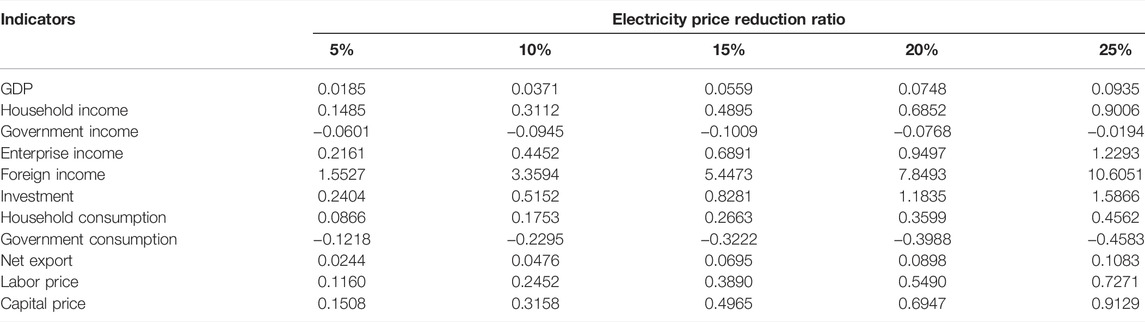
TABLE 2. Impact of general industrial and commercial electricity price reduction on macroeconomy (%).
The following is an analysis of the impact of the adjustment of general industrial and commercial electricity prices on the change of commodity output (supply) of various departments. In our model, electricity is involved in the production process as a basic input. Therefore, reducing the electricity price of general industry and commerce will produce two effects at the same time. One effect is the substitution effect, which is using electricity to replace other inputs in the production process, such as the substitution of energy for labor and capital, and the substitution between energy. The second one is called the output effect, which indicates that the substitution adjustment between inputs will have a positive impact on the output level. When the substitution elasticity between inputs is 0 (i.e., the production function is in the form of Leontief), the output increases with the increase in input electricity. In this case, there is only an output effect and no substitution effect. The other extreme case is the complete substitution between inputs (i.e., the linear production function form is adopted); then, there is only a substitution effect and no output effect. In our model, the elasticity of substitution between capital, electricity, and labor is set between the above two extreme cases, so the electricity price reduction will cause the commodity demand curve to shift outward in most sectors. When the price of electricity as an input falls, the cost of production falls, so most industries will appropriately expand their production scale and thus increase output.
As can be seen from Table 3, except for the sectors of petroleum, coking products and nuclear fuel products, general and special purpose equipment, and the sector of building, the output levels of other departments have increased. In addition to PTD (power transmission and distribution) (4.3918%), the mining industry (0.4001%) and other manufacturing industries (0.3811%) are the most prominent ones in output increase, which belong to the secondary industry. In the tertiary industry, the sectors of information transmission, software, and information technology services (0.3804%) and commercial, communication, and catering industry (0.3285%) increased significantly in output. The smallest increase in output is the sector of wood products and furniture, with an increase of 0.0244%, which belongs to the industrial category.
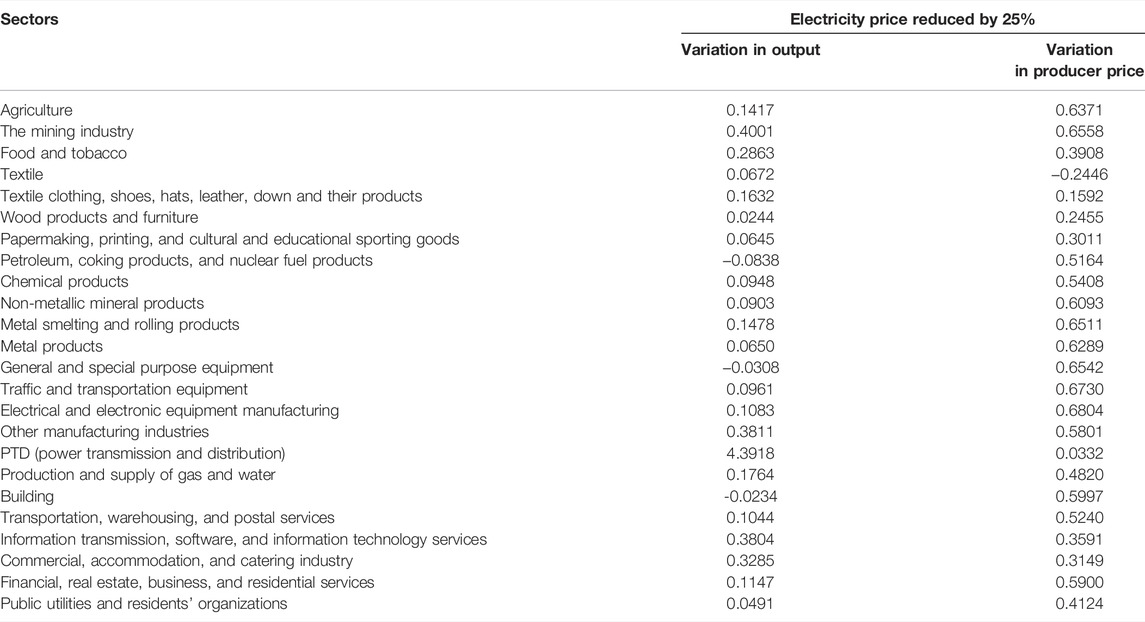
TABLE 3. Impact of general industrial and commercial electricity price reduction on the output and producer price of sectors (%).
As electricity is essential to the activities of all economic sectors, lower electricity prices will have a direct impact on the cost of goods and services in each sector, which in turn will drive changes in the relative output prices of these goods or services, which is called the direct impact of the reduction of electricity prices on the producer prices of products or services in various sectors. Because the change of electricity price will also promote the change of the price of other production inputs, it will also indirectly promote the change of the relative price of the output of products or services in various sectors. Column 2 of Table 4 shows the final change in the relative output prices of goods (or services) by sector. It can be seen from Table 4 that although the price changes of products (or services) in different sectors are different, the output price of all other sectors except for textile has increased. The producer prices of products in the sector of production and supply of gas and water increased by 0.4820%. The five sectors with the highest relative producer price increase were electrical and electronic equipment manufacturing (0.6804%), traffic and transportation equipment (0.6730%), mining industry (0.6558%), general and special purpose equipment (0.6542%), and metal smiling and rolling products (0.6511%), all of which belong to the secondary industry. In addition to the industrial sector, agriculture; sector of financial, real estate, business, and residential services; and sector of transportation, warehousing, and postal services also showed a large increase, with 0.6371%, 0.5900%, and 0.5240%, respectively.
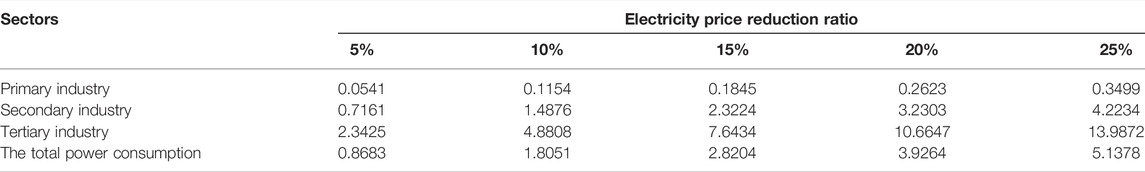
TABLE 4. Impact of general industrial and commercial electricity price reduction on the electricity consumption of sectors (%).
As the above analysis shows, due to the rise of labor wages, residents’ income and disposable income have increased, and coupled with the reduction of electricity prices, residents’ electricity consumption has increased. In addition, the electricity price reduction reduces the cost of electric power relative to other fossil energy, so some enterprises that do not necessarily use fossil energy will use electric power to replace part of fossil energy as an intermediate input, reflecting the substitution effect of electric power. Therefore, electricity consumption in most sectors will rise. In this study, 30 sectors are divided into three categories: agriculture, industry, and tertiary industry, and the changes in electricity consumption of these three sectors are simulated respectively under different general industrial and commercial electricity price reduction ratios. As is shown in Table 4, the reduction of electricity price has led to the increase in electricity consumption in the whole society, among which the electricity consumption of tertiary industry has increased significantly, followed by that of secondary industry, and the increase in electricity consumption of primary industry has been the smallest. When the electricity price was reduced by 25%, the electricity consumption of primary industry, secondary industry, tertiary industry, and total electricity consumption increased by 0.3499%, 4.2234%, 13.9872%, and 5.1378%, respectively.
5 Conclusion and Policy Implications
Electricity price is related to the production and operation costs of enterprises. General industrial and commercial electricity prices mainly involve small and medium-sized enterprises with a very wide range and high degree of social concern. Since 2018, the Chinese government has repeatedly issued relevant policies to reduce the electricity price of general industry and commerce to improve the business environment of enterprises and stimulate market vitality. Therefore, studying the impact of general industrial and commercial electricity price adjustment on the economy has become a key issue in the electricity price reform. However, at present, there are few studies about the influence of general industrial and commercial electricity price reduction. Most of the existing studies focus on the impact of residential electricity price adjustment and electricity price reform. This study fills the research gap to some extent. Taking Fujian province as an example, this study uses the provincial CGE model to study the impact of general industrial and commercial electricity price reduction on the macro economy, output, producer price, electricity consumption of various sectors, and the whole society’s electricity consumption. The relevant research conclusions have certain implications for evaluating general industrial and commercial electricity price reduction policies and the design of future electricity price policies. Through simulation, this study draws the following conclusions.
1) The reduction of general industrial and commercial electricity prices has a positive effect on the economy. According to a series of related policies issued by the National Development and Reform Commission and Fujian province, the electricity price of general industrial and commercial enterprises has been reduced by 25% compared with that of 2017, resulting in an increase of about 0.0935% in GDP. Residents’ income and consumption have also risen with the reduction in electricity prices. However, the reduced electricity sales revenue due to the reduction in electricity prices ultimately needs to be partly borne by the government, so government revenues will decrease with the reduction in electricity prices.
2) With the reduction of electricity prices, except for sectors of petroleum, coking products and nuclear fuel products, and general and special purpose equipment and building, the output levels of other sectors have risen, among which the increment of the sectors of PTD (power transmission and distribution) (4.3918%) is prominent. Apart from textile, producer prices of other sectors have increased with the reduction of general industrial and commercial electricity prices. Among them, the producer price of the industrial sector increased most significantly.
3) The reduction of general industrial and commercial electricity prices has posed a positive effect on the total electricity consumption of society. Electricity consumption in primary, secondary, and tertiary industries has increased with the reduction in electricity prices, with the tertiary industry rising the most, which shows that the reduction of general industrial and commercial electricity prices has effectively stimulated the development of the service industry.
In short, the reduction of general industrial and commercial electricity prices has a significant impact on the economy, which is conducive to promoting the operation and development of major industrial and commercial sectors. Reducing the electricity price of general industry and commerce is an important measure of the government to improve the business environment, which reflects the attention and support of the government to the circulation of commerce and trade. Based on the above discussion and conclusion, the following suggestions are proposed.
1) As is seen from the impact of the general industrial and commercial electricity price reduction on various sectors, in addition to the service industry, the high-consumption industries in some economic systems are greatly affected by the electricity price. However, in 2021, the added value of the six high-energy-consuming industries in Fujian province increases by 7.1%, accounting for 26.3% of the added value of industries above the designated size, which is higher than the national average in the same period. From the perspective of optimizing industrial structure, the government can further implement differential electricity prices, as well as different electricity prices for different industrial sectors, to regulate the development of high-energy consuming industries.
2) At present, the national unified carbon market and carbon-neutral targets provide policy support for the high proportion of renewable energy in the total electricity. Fujian province is the first national ecological civilization pilot zone and has a variety of clean energy sources such as wind, light, water, gas, and nuclear. Therefore, the government can seize the favorable opportunity to ease the contradiction between power supply and demand and appropriately increase the proportion of clean energy power generation such as hydropower and wind power. With the technological progress and the decline of clean energy power generation cost in the future, the average power consumption cost of users is expected to continue to decline, which can provide sustainable support for the policy of general industrial and commercial electricity price reduction.
3) In terms of policy implementation, in the first half of 2021, the energy consumption intensity of Fujian province increased rather than decreased year on year, and it is of great significance to guide the province to do its work in a solid, effective, and orderly manner. Therefore, relevant departments should strengthen supervision and inspection to ensure that all communities and commercial complexes implement national and provincial policies and prevent the phenomenon that the electricity charge standard is still higher than the electricity price standard stipulated by the state. At the same time, it is necessary to take effective measures to strengthen publicity and ensure that all end users are aware of the price reduction policy and implement it.
Data Availability Statement
The original contributions presented in the study are included in the article/Supplementary Material, further inquiries can be directed to the corresponding author.
Author Contributions
QC: writing—original draft, formal analysis, methodology, and software. HC: writing—review and editing, investigation, and software. KX: writing—original draft, conceptualization, and data curation. CL: writing—review and editing and methodology. WW: writing—review and editing, supervision, methodology, and validation.
Funding
This paper is supported by the National Natural Science Foundation of China (Grant No. 71874149, 71934001), National Social Science Fund of China (Grant No. 20ZDA084), and the State Grid Fujian Electric Power Company research project “Quantitative Influence of Electricity Price Policy and Business Strategy Optimization Analysis” (Grant SGFJJY00ZCWT2000071).
Conflict of Interest
Authors QC, HC, KX, and CL were employed by the Economic and Technological Research Institute, State Grid Fujian Electric Power Co., Ltd. And this study was supported by the State Grid Fujian Electric Power Company research project “Quantitative Influence of Electricity Price Policy and Business Strategy Optimization Analysis.”
The remaining author declares that the research was conducted in the absence of any commercial or financial relationships that could be construed as a potential conflict of interest.
Publisher’s Note
All claims expressed in this article are solely those of the authors and do not necessarily represent those of their affiliated organizations, or those of the publisher, the editors and the reviewers. Any product that may be evaluated in this article, or claim that may be made by its manufacturer, is not guaranteed or endorsed by the publisher.
Reference
Antoszewski, M. (2019). Wide-range Estimation of Various Substitution Elasticities for CES Production Functions at the Sectoral Level. Energ. Econ. 83, 272–289. doi:10.1016/j.eneco.2019.07.016
Bhattacharyya, R., and Ganguly, A. (2017). Cross Subsidy Removal in Electricity Pricing in India. Energy Policy 100, 181–190. doi:10.1016/j.enpol.2016.10.024
Dale, L. (2004). Electricity price and Southern California's Water Supply Options. Resour. Conservation Recycling 42, 337–350. doi:10.1016/j.resconrec.2004.03.002
Du, G., Lin, W., Sun, C., and Zhang, D. (2015). Residential Electricity Consumption after the Reform of Tiered Pricing for Household Electricity in China. Appl. Energ. 157, 276–283. doi:10.1016/j.apenergy.2015.08.003
Fan, Z., Zhang, Z., and Zhao, Y. (2021). Does Oil price Uncertainty Affect Corporate Leverage? Evidence from China. Energ. Econ. 98, 105252. doi:10.1016/j.eneco.2021.105252
Hamilton, J. D. (1983). Oil and the Macroeconomy since World War II. J. Polit. Economy 91, 228–248. doi:10.1086/261140
Hamilton, J. D. (2003). What is an oil shock? J. Econom. 113 (2), 363–398. doi:10.1016/S0304-4076(02)00207-5
He, Y. X., Yang, L. F., He, H. Y., Luo, T., and Wang, Y. J. (2011). Electricity Demand price Elasticity in China Based on Computable General Equilibrium Model Analysis. Energy 36, 1115–1123. doi:10.1016/j.energy.2010.11.038
He, Y. X., Zhang, S. L., Yang, L. Y., Wang, Y. J., and Wang, J. (2010). Economic Analysis of Coal price-electricity price Adjustment in China Based on the CGE Model. Energy Policy 38, 6629–6637. doi:10.1016/j.enpol.2010.06.033
Jiménez-Rodríguez, R., and Sánchez, M. (2005). Oil price Shocks and Real GDP Growth: Empirical Evidence for Some OECD Countries. Appl. Econ. 37, 201–228. doi:10.1080/0003684042000281561
Kumar, M. D. (2005). Impact of Electricity Prices and Volumetric Water Allocation on Energy and Groundwater Demand Management:. Energy Policy 33, 39–51. doi:10.1016/s0301-4215(03)00196-4
Lin, C., Li, Y., Cai, Q., Shi, P., Song, M., and Wu, W. (2021). Evaluation on the Cost of Energy Transition: A Case Study of Fujian, China. Front. Energ. Res. 9, 29. doi:10.3389/fenrg.2021.630847
Moerenhout, T. S. H., Sharma, S., and Urpelainen, J. (2019). Commercial and Industrial Consumers' Perspectives on Electricity Pricing Reform: Evidence from India. Energy Policy 130, 162–171. doi:10.1016/j.enpol.2019.03.046
Nguyen, K. Q. (2008). Impacts of a Rise in Electricity Tariff on Prices of Other Products in Vietnam. Energy Policy 36, 3145–3149. doi:10.1016/j.enpol.2008.04.013
Ohler, A., Mohammadi, H., and Loomis, D. G. (2020). Electricity Restructuring and the Relationship between Fuel Costs and Electricity Prices for Industrial and Residential Customers. Energy Policy 142, 111559. doi:10.1016/j.enpol.2020.111559
Qi, T., Winchester, N., Zhang, D., Zhang, X., and Karplus, V. J. (2014). The China-in-Global Energy Model. Joint Program Report Series Report 262, 32.
Rafiq, S., Salim, R., and Bloch, H. (2009). Impact of Crude Oil price Volatility on Economic Activities: An Empirical Investigation in the Thai Economy. Resour. Pol. 34, 121–132. doi:10.1016/j.resourpol.2008.09.001
Rehman, M. U. (2018). Do oil Shocks Predict Economic Policy Uncertainty? Physica A: Stat. Mech. its Appl. 498, 123–136. doi:10.1016/j.physa.2017.12.133
Silva, P., Klytchnikova, I., and Radevic, D. (2009). Poverty and Environmental Impacts of Electricity price Reforms in Montenegro. Utilities Policy 17, 102–113. doi:10.1016/j.jup.2008.02.008
Sun, M., Li, J., Gao, C., and Han, D. (2017). Identifying Regime Shifts in the US Electricity Market Based on price Fluctuations. Appl. Energ. 194, 658–666. doi:10.1016/j.apenergy.2016.04.032
Wang, X., and Lin, B. (2017b). Electricity Subsidy Reform in China. Energ. Environ. 28 (3), 245–262. doi:10.1177/0958305X16681681
Wang, X., and Lin, B. (2017a). Impacts of Residential Electricity Subsidy Reform in China. Energy Efficiency 10 (2), 499–511. doi:10.1007/s12053-016-9466-3
Wang, Y., Fan, Q., Ma, Y., and Zhang, J. (2020). “Research on Electricity price Subsidy Policy of Biomass Energy in Shandong Province of china by CGE Model,” in Proceedings - 2020 5th Asia Conference on Power and Electrical Engineering, ACPEE 2020 (Chengdu, China: Institute of Electrical and Electronics Engineers Inc.), 1056–1060. doi:10.1109/ACPEE48638.2020.9136562
Wang, Y., and Lin, B. (2021). Performance of Alternative Electricity Prices on Residential Welfare in China. Energy Policy 153, 112233. doi:10.1016/j.enpol.2021.112233
Wang, Y. Q., Dong, Z., Wang, Y., Liu, G., Yang, H., and Wang, D. (2019). Impact of Electricity Production Tax on China’s Economy, Energy, and Environment: A CGE-Based Study. Polish J. Environ. Stud. 28, 371–383. doi:10.15244/pjoes/96256
Yang, M., Yuan, Y., and Sun, C. (2021). The Economic Impacts of China's Differential Electricity Pricing Policy: Evidence from Energy-Intensive Firms in Hunan Province. Energ. Econ. 94, 105088. doi:10.1016/j.eneco.2020.105088
Zhang, D. (2008). Oil Shock and Economic Growth in Japan: A Nonlinear Approach. Energ. Econ. 30, 2374–2390. doi:10.1016/j.eneco.2008.01.006
Zhang, K., Yao, Y.-F., Liang, Q.-M., and Saren, G. (2021). How Should China Prioritize the Deregulation of Electricity Prices in the Context of Carbon Pricing? A Computable General Equilibrium Analysis. Energ. Econ. 96, 105187. doi:10.1016/j.eneco.2021.105187
Zhang, L. (2014). “Electricity Consumers' Behavior and Macroeconomic Influence of Step Tariff Policy—An Empirical Test Based on Guangdong Province,” in China International Conference on Electricity Distribution, CICED (IEEE Computer Society), 1114–1117. doi:10.1109/CICED.2014.6991879
Keywords: CGE model, general industrial and commercial electricity price, electricity price reform, case study, electric power industry
Citation: Cai Q, Chen H, Xiang K, Lin C and Wu W (2022) Evaluation on the Impact of General Industrial and Commercial Electricity Price Reduction: A Case Study of Fujian Province. Front. Energy Res. 10:871681. doi: 10.3389/fenrg.2022.871681
Received: 08 February 2022; Accepted: 14 March 2022;
Published: 26 April 2022.
Edited by:
Xunpeng (Roc) Shi, University of Technology Sydney, AustraliaReviewed by:
Jiasha Fu, Southwestern University of Finance and Economics, ChinaHuiming Xie, Ningbo University, China
Copyright © 2022 Cai, Chen, Xiang, Lin and Wu. This is an open-access article distributed under the terms of the Creative Commons Attribution License (CC BY). The use, distribution or reproduction in other forums is permitted, provided the original author(s) and the copyright owner(s) are credited and that the original publication in this journal is cited, in accordance with accepted academic practice. No use, distribution or reproduction is permitted which does not comply with these terms.
*Correspondence: Wei Wu, d3V3ZWlfZXBAMTYzLmNvbQ==