 Zhao Huang
 Pengbo Ma1
 Baling Fang
 Ming Zhang
- 1College of Railway Transportation, Hunan University of Technology, Zhuzhou, China
- 2Key Laboratory for Micro-Nano Optoelectronic Devices of Ministry of Education, School of Physics and Electronics, Hunan University, Changsha, China
As an important part of smart grid construction, the distribution network (DN) optimization problem has always attracted great attention, especially under the background that large-scale penetration of distributed generators (DGs) and electric vehicles (EVs) into building cluster poses both opportunities and challenges to the energy management. This research presents a hierarchical optimization strategy, for improving the safe and economical operation of DN considering the DGs and EVs integration. In Stage 1, the MPPT control model of DGs is designed to obtain the best energy conversion efficiency. In Stage 2, load models of EVs and battery energy storage system (BESS) under coordinate charging/discharging stimulated by a time-of-use incentive mechanism are established respectively, to achieve a load curve with a minimized peak-to-valley difference (PVD). In Stage 3, aiming for the best compromise between the active power loss and node voltage excursion, daily optimal scheduling of the static Var compensator (SVC) capacitors is dynamically worked out according to the varying power demand, as the solution for the defined multi-objective optimization problem. For enhancing the convergence speed, an advanced genetic algorithm with elite preservation strategy is employed. The proposed hierarchical strategy is demonstrated on an IEEE 33-node DN test case, and the simulation results show that first, the MPPT control ensures the maximum power outputs of DGs; next, power supply pressure could be relieved by the load shifting effects of the coordinated vehicle-to-grid (V2G) service and BESS configuration, reflected in the decreased load peak from 4,370.1 to 3,424.99 kW, and the optimized PVD from 1763.8 to 703.8 kW; meanwhile, via applicable power planning of the SVC components, optimized power loss and voltage quality can both be achieved, proving the feasibility of the optimization strategy, which promotes the economic and reliable operation of the DN system.
1 Introduction
With the sustainable development of the energy industry, the excessive exploitation of traditional fossil energy has brought increasingly severe environmental pollution problems such as energy resource shortage and climate change, making it extremely urgent to utilize renewable energy as an alternative for fossil fuels (Brockway et al., 2019; Xiong et al., 2020). In recent years, the large-scale penetration of renewable resources and new energy equipment alleviates the energy crisis, while also bringing rigorous challenges to the power system optimizing configuration and secondary energy rational utilization (Peidong et al., 2009). For example, the randomness and intermittency of power generated from wind turbines (WTs) or photovoltaic cells (PVs) and the time-space dimensional decentralization of electric vehicle (EV) charging, induce more uncertainty for present distribution network (DN) operations than ever before, as well as problems involving harmonic pollution (Siahroodi et al., 2021), three-phase voltage imbalance (Islam et al., 2020), and transformers aging (Elbatawy and Morsi, 2022). Particularly, the enlarged peak-to-valley difference (PVD) of the load curve puts forward higher requirements for the power system. The safety and economy, expressed as node voltage excursion and active power loss respectively, are commonly regarded as crucial indices reflecting the operation state of the DN (Dong et al., 2019). The serious peak load arisen from the aggregated charging behaviors of EV owners probably causes low-voltage even blackout, concurrently increasing system loss. Hence, guiding measures for coordinated regulation should be taken to minimize the negative influences of integrated renewable energy and EVs while satisfying the power and travel demands of customers.
Recently, the integrated energy system (IES) has been greatly supported by the Chinese government and turned into a research hotspot, since it benefits the integration of renewable energy and the coordinated development of the multi-energy system. Under the background of the IES, the management idea for the DN has changed from supply-oriented to demand-oriented (Zhang et al., 2018), which integrates the functions of distributed generation control, real-time monitoring, information sharing, and market transactions. This makes for better accommodation and scheduling abilities to diversify distributed energy equipment.
To stabilize the output fluctuation of renewable power generation, the battery energy storage system (BESS) has become a key supporting unit to improve the compatibility level for the WT and PV of the DN. By power transferring through electrochemical charging/discharging, the BESS not only enhances the utilization of clean energies, bringing higher economic benefits to the regional grid but further improves the reliability of the power supply. A hierarchical coordinated control strategy with the fast-response BESS to suppress high fluctuations associated with DGs outputs has been developed based on the MPC framework (Zhang et al., 2021). Moreover, as part of a vehicle-to-grid (V2G) system (Luo et al., 2020), EV can also be regarded as a controllable power resource, to realize the bidirectional power flow between the building cluster and DN. According to previous studies (Zeng et al., 2020; Fang et al., 2021), the time-of-use (TOU) price mechanism is an effective method for integrated demand side management, which creates an economic incentive for users to adjust their charging/discharging time. For example, residential customers plug in their vehicles during off-peak hours and discharge in peak regions to produce V2G profits. This helps to reduce the risks of distribution transformer overloading and power outage and stabilizes the load fluctuation by valley filling and peak shaving, thus balancing the demand and supply. These findings could enlighten us about solving the optimizing configuration problem of the EV-integrated DN.
Tremendous efforts have been devoted to DN optimization referring to multi-source cooperation. A voltage regulation model was proposed in a study by Mahmoudi et al. (2021) to enhance the voltage quality of the power system with EVs penetration; nevertheless, the active loss is not included in the objective function. Contrarily, Chen G. et al. (2013) analyzed the model for DN reconfiguration, with the single optimization function of power loss. Zarei M et al. designed a multi-objective optimization model for DN reconfiguration, considering the uncertainties of load variations and power production of DGs (Zarei and Zangeneh, 2017). For simultaneous optimization of power loss and voltage stability of the DN, reactive compensation measures, carried out through static Var compensator (SVC) capacitor generally in studies by (Xu et al., 2021) and (GholamiFarkoush et al., 2019), are always taken. Studies by (Wu et al., 2021) and (Tan and Chen, 2020) mainly focus on power management under the predictive control strategy for charging EVs, while they are only regarded as stochastic charging loads rather than controllable units which could participate in energy dispatch, and the V2G functions are not included. In a study by Jiao et al. (2021), a multi-objective optimization model emphasizing the EV integration to a smart DN is described, with the EVs scheduled in response to TOU price. Since the charging or discharging plan is generated with fixed peak and valley periods, it may not be suitable for the time-varying loads.
As analyzed above, earlier reports on the DN optimization operation concentrated on single or combinative objective functions of node voltage fluctuation and active power loss; however, these works entailed some deficiencies including the following aspects: (1) optimization scheduling did not involve wide-range types of energy resources, such as EVs or DGs, which were disregarded in some previous works; (2) utilization efficiency perfection of DGs was ignored; (3) EVs were only treated as stochastic charging loads; and (4) the dynamic dispatch of EVs was not considered.
To overcome the shortcomings of previous works, a hierarchical optimization strategy is proposed in this study, which combines the maximum power point tracking (MPPT) control of the DGs (Stage 1), coordinated V2G service, and BESS dispatch for minimized PVD via the positive guidance of the TOU mechanism (Stage 2), with dynamic reactive compensation for maintaining the reliable and economic operation of the DN (Stage 3). The tradeoff between node voltage excursion and active power loss is selected as the objective function to be optimized, and an improved genetic algorithm (GA) with elite preservation strategy (EPS) owning fast convergence is adopted to solve the best daily scheduling plan for the SVC component while meeting all constraints of the DN. An IEEE 33-bus system involving WT, PV, BESS, and EVs accessed to the building cluster is taken as the research object, to validate the effectiveness of the optimization model. In Stage 1, MPPT control improves the energy conversion efficiency of DGs and reduces the power supply pressure of the DN. In Stage 2, EVs participate in energy management as flexible loads, and functions including stabilization of the DGs’ output fluctuation and power load shifting are realized through coordinated dispatch of EVs and the BESS. In Stage 3, the multi-objective economic-secure optimization problem is dynamically worked out through SVC being put into operation, and the significant advantage of load shifting is highlighted by the statistical result comparison of relative voltage fluctuation and power loss, further confirming the effectiveness of the hierarchical scheduling approach.
2 A Hierarchical Optimization Framework
A smart DN is mostly configured as an energy cascade utilization system, enabling free power flow among multiple energy sources, and provides power to residents through building cluster. Figure 1 briefly illustrates the structure of the DN containing dispersed multi-source. Specifically, the demand side involves basic power load, BESS to be charged, and scattered EVs connected to the building cluster. The schedulable supply side includes diversified distributed energy sources (such as WT, PV, bidirectional EV chargers, and BESS), to satisfy the power demand of residents. EVs are not regarded as traditional loads since they can also act as power suppliers. For the V2G application, EV devices not only provide customers with charging services but also allow the owners to interact with the power grid and make V2G profits by selling excessive energy back to the grid at an appointed electricity price level. Overall, the optimization strategy of the multi-source DN is intended to maintain stability and improve the energy efficiency of the whole system through power control over the distributed energy resources based on their operation features. On the premise of that daily power demand, information is collected, and the impacts of EV traveling and distributed energy equipment working are confirmed; the efficient planning and operation of the supply side can be carried out according to users’ willingness, under the guidance of distributed cooperative control, to finally achieve the comprehensive optimization dispatch from the demand side response, energy interaction, and DN operation perspectives. In this study, a hierarchical optimization strategy for the smart DN with multi-source integration is proposed, and the framework is presented in Figure 2.
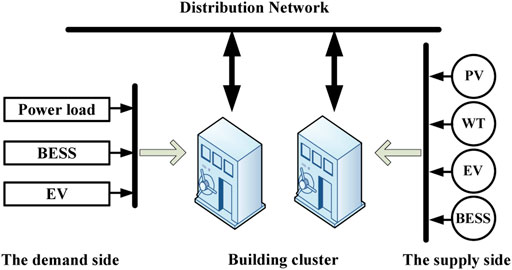
FIGURE 1. Schematic of the multi-source DN.
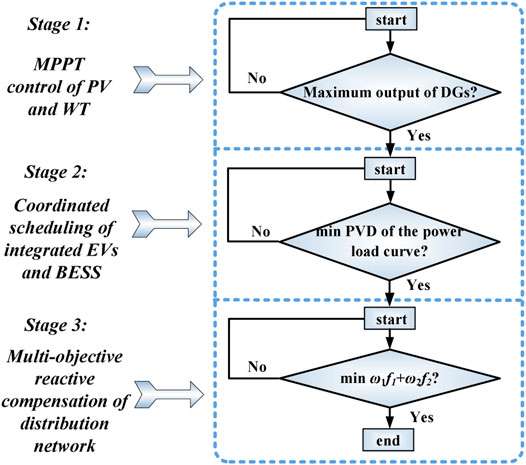
FIGURE 2. Block diagram of the hierarchical optimization procedure.
In Stage 1, the optimal operation control of distributed renewable energy generators is implemented. MPPT measures are taken to maximize the working efficiency of WT and PV, to make full use of clean energies to alleviate the power supply pressure of the grid. In Stage 2, from the economic and security views of the power system, minimizing the PVD concurrently suppressing the power fluctuation created by DGs is selected to be the optimization objective in this stage, and an incentive method for EVs coordinated scheduling is introduced, wherein TOU measure is utilized to provide an economic incentive to make EV owners charge during less congested regions and discharge in peak hours, combined with the variable power charge/discharge control of the BESS. Resultantly, the charge/discharge guidance of the connected EVs could be determined by figuring out the optimal peak and valley periods, and the real-time output plan of the BESS configuration associated with load shifting could also be solved. In Stage 3, based on the power load after peak shaking and valley filling function of EVs and BESS collaborative services, SVC is put into operation for reactive power compensation. The coordinated structure formulated as a comprehensive objective function aiming to concurrently minimize the active power loss and node voltage excursion of the DN is established, and the optimal daily output schedule of SVC capacitors can be dynamically obtained. The strategy not only maintains the balance of power supply and demand but favors the running costs and voltage quality, merging the high energy efficiency, economy, and security for system operation. Analysis of mathematical modeling of the hierarchical optimization problem is given next.
3 Stage 1: MPPT Control of DGs
Renewable energy power generation such as WT and PV has the characteristics of non-pollution and sustainability but is intermittent and time-varying. The MPPT control method is employed to maximize the output efficiency and improve the response speed of the renewable power generation system, which is directly related to the effective utilization of wind and solar energy and the safe operation performances of the generation system. Specifically for the WT running characteristics, as provided in Figure 3, under a constant blade pitch angle, the wind energy utilization coefficient changes with the tip speed ratio (Luo and Niu, 2016), and each wind velocity corresponds to an optimal mechanical speed of WT ωmax, for example, S for wind velocity V1 and P for V2, which makes the WT operate at MPP. By depicting all MPPs under different wind velocities, it forms a maximum power curve. Hence, it can be seen that satisfying the equation ωm = ωmax is the essential task for the MPPT control of WT. Similarly, for the PV generation system, which usually covers the PV panel, Boost circuit, inverter, and load, the duty cycle D of the switching device in the Boost circuit can be taken as the control parameter for MPPT to well reduce the complexity of the system. More precisely, the temperature changes mainly affect the PV output voltage, while the irradiation changes mainly affect the PV output current, and under a given temperature and sunlight intensity, the intersection point of the load-line with the PV characteristic determines the operating point (Koutroulis et al., 2001). Consequently, the maximum power production is based on the load-line regulation by means of adjusting D to realize impedance matching, that is, the equivalent input resistance of the power converter equals the internal resistance of the PV cell (Podder et al., 2019), to impel the working point to move toward the MPP correctly, and the process is declared in Figure 4.
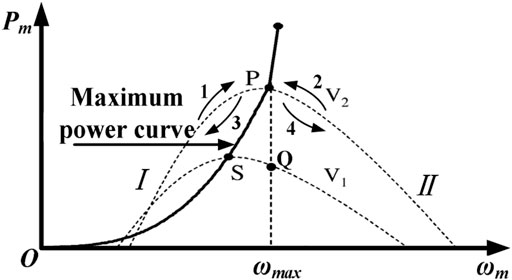
FIGURE 3. Characteristic curve of WT generation.
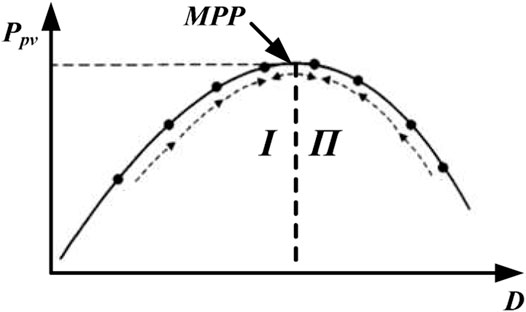
FIGURE 4. Characteristic curve of PV generation.
Due to the connection through a gear box, the WT rotational speed ωm is directly proportional to the wind generator speed ωr; thus, the optimal ωmax of WT corresponds to a reference ωr* of the generator. According to Figure 3, if the detected ωr is equal to ωr*, which indicates that the generation system operates at the MPP as expected, the excitation current value ic of the wind power generator can be maintained. If the detected ωr<ωr*, manifesting that the generation system works at Region І, and it is necessary to increase ωr to approach the MPP; while ωr>ωr* represents the operation state of the WT generation system at Region Ⅱ, and ωr should be decreased to improve the conversion efficiency. Under such a non-equilibrium condition, regulation principles are established:
1) Region І: a positive speed variation Δωr illustrates that the working point is close to the MPP along the path 1 direction, and ωm increasing indicates that the output of the WT Pm may be greater than the generator Pg, and the excitation current ic of the generator should be enhanced for power matching; contrastively, a negative Δωr signifies that the working point moves far away from the MPP along the path 3 direction, and the excitation current ic needs to be rapidly reduced to satisfy Pm > Pg, which drives the increase of ωm and ωr, and guarantee the correct moving direction.
2) Region Ⅱ: the WT generation system works in the high-speed area of the characteristic curves, and thus whether the working point moves along path 2 or 4, the generator output power Pg should be improved for optimal efficiency, that is, the excitation current ic needs to be increased in this region.
Similar to WT analyzed above, the MPP tracking principle for PV generation also can be summarized as follows: if the PV generation system operates in Region І, the duty cycle D of Boost circuit should be increased, while D must be reduced as a response to the operating points in Region Ⅱ.
4 Stage 2: Coordinated Scheduling of Integrated EVs and BESS
The explosive growth of these DGs’ penetration brings power rush and uncertainty problems to the DN. Since the connected EVs and BESS can both function as power buffer for intermittent DGs and backup power supply, matching the bidirectional EVs and BESS equipment for power smoothing is always considered as a simple and effective measure to solve the above problems.
4.1 Coordinated Scheduling of Integrated EVs
In the presence of large-scale penetration of EVs into the building cluster, the load pressure, operating costs, and reliance on DN will be increased. Dispatch facilitates are coordinated to boost the utilization efficiency of EVs and improve the demand side flexibility. Due to the intrinsic advantages such as operational safety and energy density, the lithium-ion batteries of 25 kWh are selected as the power battery for EVs (Barcellona et al., 2019), and the charging power maintains at 2.5 kW for a single vehicle. Concurrently, the safety threshold of the state of charge (SOC) is defined to be (10%, 90%); hence, it can be inferred that the charging/discharging could not last for more than 8 h. This is supposing that the power consumption for an EV is 15 kWh per 100 km, and the theoretical endurance mileage can be calculated as 133 km.
4.1.1 Aggregated Charging of EVs
Aggregated charging of EVs could be explained as charging behavior only according to customers’ travel needs or living habits, without any guiding principle. The EV travel follows a probability density distribution represented in Eq. 1 (Qian et al., 2010) and depicted in Figure 5 as well, as follows:
where μd = 3.20, σd = 0.88, and x denotes the daily mileage of EV (mostly lies between 32 and 97 km), so a charged 25-kWh battery can provide sufficient energy to meet daily driving requirements. Monte Carlo random sampling can be used to predict the charging power demand for a single EV during a day. In this study, a day is divided into 24 periods, with sampling of the states of EVs per hour. The charging expectation for a single vehicle is shown in Figure 6.
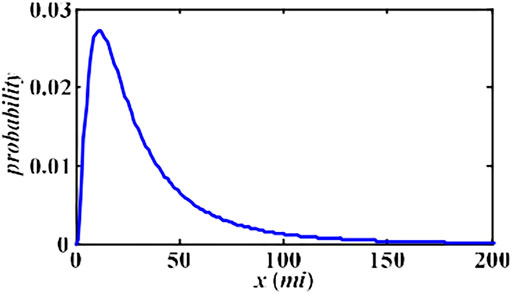
FIGURE 5. Daily probability of driving distance.
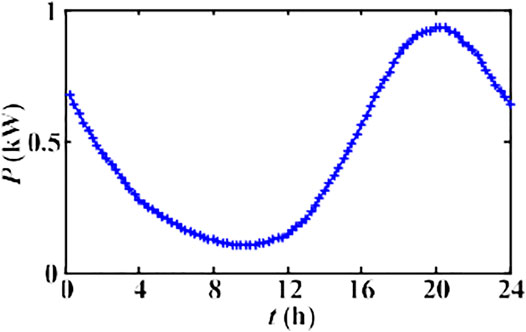
FIGURE 6. Original charging requirements for a single EV.
4.1.2 Coordinated Dispatch of EVs
The three-stage TOU price is designated to establish a positive guidance for the charging/discharging process of the EV owners. Depending on the load change of the power grid, the corresponding electricity price level of each period is confirmed, to achieve peak shaving and valley filling. In the modeling process for V2G service based on TOU, minimizing the PVD of the power load in the DN is chosen as the optimization objective, and some application background is specified as follows:
1) The battery power meets the driving demand of the EV owners, and there is no other power consumption behavior besides the normal travel.
2) User charge or discharge without exceeding the safe range of the SOC, and 80% of the total owners participate in the coordinated dispatch (d = 0.8).
3) mv, mp, and mf are defined as the electricity price of the valley, peak, and normal period, respectively, and then the price model mt can be described as follows:
where t1–t4 represents the start and end moment of the valley period and the peak period, respectively.
4) Before charging/discharging, the owners can query the current battery status of the EVs and independently select the charging/discharging time. The parameters tsc, tc, tsd, and td are defined as follows:
tsc, tsd -the start moment for users to charge/discharge; tc, td -duration of the charging/discharge process.
EV users participating in the V2G dispatch can severally choose tsc or tsd according to Eqs 3, 4:
where rc and rd are random numbers ⊂ [0, 1] interval. It can be known that for the coordinated EVs dispatch model, t1–t4 determine the peak and valley areas, and hence are key factors for optimal V2G service quality, which lays an important foundation for the subsequent multi-objective DN scheduling.
4.2 Optimal Planning of BESS
The BESS system is commonly connected to the power grid together with the DGs, for smoothing the power fluctuation of renewable power generation. Similar to EVs, BESS can also operate in both charge and discharge states, and it can run through all parts of the power system. Recent research on the application of BESS mainly focuses on two issues: a dispatch from the perspective of BESS cost and load shifting to directly achieve peak shaving and valley filling. Through BESS modeling, the best charge/discharge plan can be solved. BESS could work in both of fixed and variable power mode, considering that although the control process of the fixed power mode is relatively simple, the output of BESS may exceed the power demand; hence, the variable power control mode is selected in this study to guide the charging or discharging behaviors of the BESS system and satisfy the real-time power demand of residents dynamically and, finally, acquire a daily load curve with minimized PVD. Suppose that the initial SOC of the BESS is 10%, pc_bess(t) and pd_bess(t) denote the charge and discharge power demand of BESS at the tth moment, and ηc and ηd demonstrate the charge and discharge efficiency factors, respectively, Under the BESS power balance principle in Eq. 5, the variable power charge/discharge control is designed as the following steps and represented in Figure 7:
1) Collect temporary data of basic power demand, PV and WT power generation with MPPT control, and coordinated charging/discharging states of EVs in the regional DN.
2) According to the gathered information in (1), determine the peak shaving line of the BESS, and calculate the capacity required for daily load peak shaving, which concurrently equals to the capacity to be absorbed for the BESS during off-peak hours.
3) Set a horizontal line at the minimum load as the valley filling line and gradually move it upward with a certain step size until the output power balance is satisfied.
4) Confirm the optimal peak shaving and valley filling line, thus obtaining the solution of the daily output plan of the BESS and completing the BESS scheduling process.
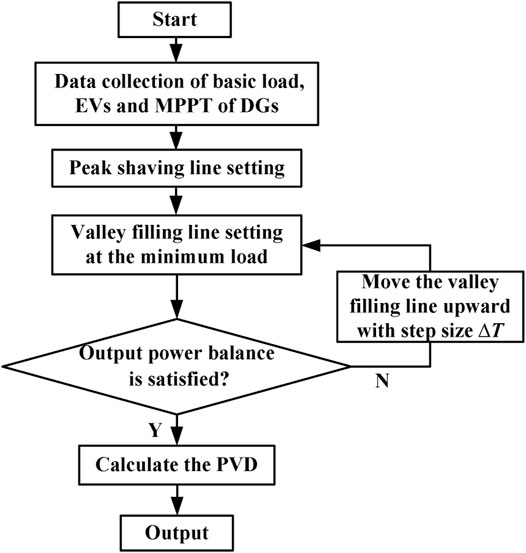
FIGURE 7. Variable power charge/discharge control flow of the BESS.
5 Stage 3: Multi-Objective Reactive Compensation of DN
The guiding ideology for the whole DN optimization can be concluded as follows: on the premise that the parameters including branches and loads are known and various constraints are satisfied, dynamically adjust the output of the SVC capacitor banks to optimize the comprehensive indices of active power loss and voltage excursion. Finally, the economic and safe operation of the multi-source DN can be achieved.
5.1 Objective Function
The optimization objective function comprises two important issues: active power loss and node voltage excursion of the DN.
1) Active power loss
The first objective is the minimization of the total active power loss of the DN, which can be mathematically modeled using Eq. 6:
where P′Lij and PLij, denote the active power loss of the branch (i, j) before and after optimization, respectively.
2) Voltage excursion
Node voltage is an important indicator reflecting the security and service quality. To avoid all the voltages moving toward their maximum limits after optimization, the deviation of voltage from the rated value is chosen as an objective function as shown below:
where U’j, Uj, and UjN, respectively, represent the actual voltage of the node j before and after optimization, and the rated voltage of the node j.
Combining the above two indicators, the objective function can be expressed as follows:
where ω1 and ω2 are the weight coefficients for the two optimization objectives (ω1 = ω2 = 0.5). The penalty function is used to deal with the node voltage out-of-limit problem and Ujmin and Ujmax are the minimum and maximum voltage values of the node j, while μ indicates the penalty factor (μ = 1000), and ΔUj is defined as follows:
5.2 Constraints
The basic constraints of DN optimization mainly include equality constraints (power flow) and inequality constraints as follows:
1) Equality constraints:
where
2) Inequality constraints:
1) SOC constraint of EVs and BESS:
where
5.3 Algorithm
The purpose of multi-objective optimization is to determine a set of Pareto solutions, which take each optimization objective into account. GA is a global probability searching tool, including selection, crossover, and mutation operators to retain the high-quality individuals in the population. Herein, in order to improve the convergence speed of the traditional GA, EPS policy is introduced, which is featured with that the excellent individuals owing the best fitness are gathered to form a sub population and directly copied to the next generation without participating in the crossover and mutation steps. It could protect the elite individuals from the disturbance of crossover and mutation operations in the traditional GA, thus improving the stability and convergence of the algorithm. Moreover, the crossover probability Pc and mutation probability Pm are adaptively adjusted following the fitness values, which are perfected as Eqs 15, 16 (Huang et al., 2020):
where Favg, Fmax, F′, and F″, demonstrate the average and maximum fitness value of individuals, the better fitness of the two crossover individuals, and the mutation individuals, respectively. k1–k4 are set to be 0.5, 0.9, 0.02, and 0.05. By improving Pc and Pm, individuals with higher fitness value than the average correspond to lower crossover and mutation probability, while individuals below the average correspond to higher Pc and Pm, which helps to duplicate the good individuals and eliminate the bad solutions. Figure 8 shows the flowchart of the algorithm. After the load flow calculation of the initialized population, 20% of the individuals with the best compromise effects between the two objective functions are reproduced directly to the next generation, while the rest are selected using the roulette wheel method and generated according to the crossover and mutation operations. The global optimal solution is acquired through an iterative calculation, with the group size 30 and iteration 500.
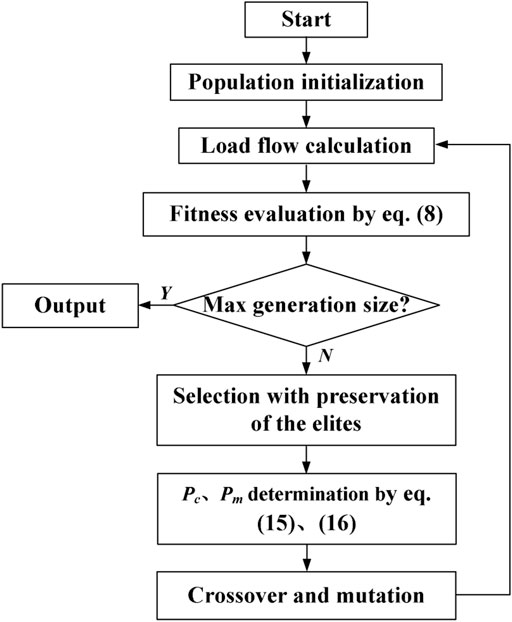
FIGURE 8. Flowchart of the optimizing process via the developed GA with EPS.
6 Results and Discussion
The standard IEEE 33-node power DN system shown in Figure 9 is taken for verification, and its load information is detailed in Reference (Huang et al., 2020). The basic parameters of the network for the per-unit system are 10 MVA and 12.66 kV. The proposed hierarchical optimization strategy is implemented on the MATLAB platform, and the research cycle is 24 h. The IEEE 33-node DN mainly contains: (1) residential building load (original power load without DGs and EVs integration), which is assumed to evenly distribute on four nodes: 3, 10, 18, and 32. Considering the time-varying characteristics of the daily load, a series of residential building load data for a certain day are collected from the study by Huang et al. (2020), with the PVD of 1763.8 kW, as shown in Figure 10. (2) Renewable energy power generation. DG1 (WT) and DG2 (PV) are installed on nodes 2 and 5, respectively, with the optimal output power under MPPT control. For the day studied, meteorological data involving wind velocity, temperature, and sunlight intensity (Hosseinalizadeh et al., 2016) associated with renewable energy power generation are depicted in Figures 11, 12, with sampling per hour in view of the randomness and uncertainty of climate. (3) BESS, positioned at nodes 3 and 10, with individually rated power of 100 kW and capacity of 500 kWh. According to (Yao et al., 2017), the charge/discharge efficiencies are selected as ηc = 0.95, ηd = 0.9, respectively. (4) SVC, placed on the weakest two nodes for compensation, and each capacitor bank is supposed to provide the maximum capacity Cjmax = 1 Mvar. (5) EV charging loads, which can also be deemed as power suppliers under the V2G mode. It is assumed that 500 EVs are accessed to the building cluster, with the charge/discharge power of 2.5 kW. Furthermore, the convergence accuracy of power flow calculation is 10–4.
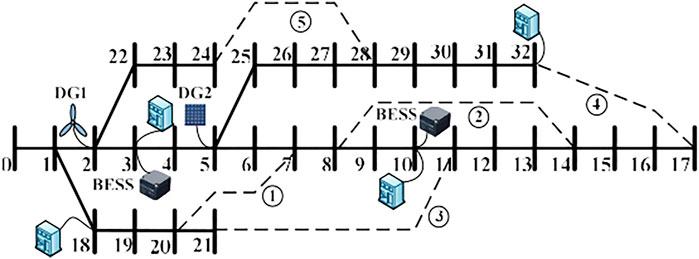
FIGURE 9. IEEE 33-node system.
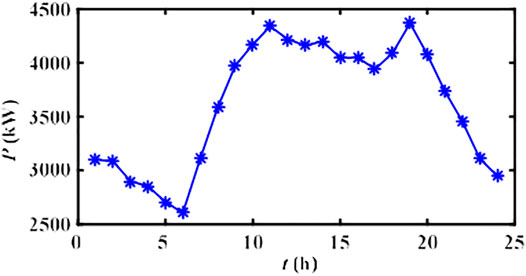
FIGURE 10. Daily original power load.
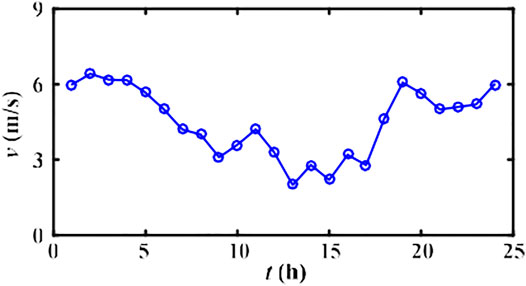
FIGURE 11. Daily wind velocity data.
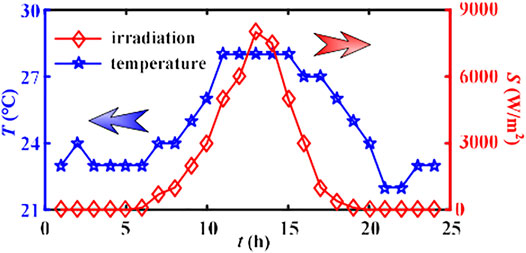
FIGURE 12. Daily temperature and irradiation intensity.
6.1 Discussion of Simulation Results in Stage 1
Based on the collected daily wind velocity, temperature, and irradiation intensity distribution data in Figures 11, 12, the output of WT and PV under MPPT control can be obtained, as shown in Figure 13. Despite the randomness of the climate, the DGs achieve the maximum output power within a short self-regulation time, concurrently with small oscillation and thus desired power equality. Concretely, from the original building load curve, it is obvious that the power system is most prone to blackout at about 19:00, with the peak load of 4,370.1 kW. The MPPT control impels the WT and PV system efficiently operates with 631.82 and 23.28 kW, making the power demand optimized to 3,715 kW under Scenario 1 (decreased by 14.99%), which is conducive to alleviating the power supply burden of the DN (Figure 14). Besides, among all the MPPs, the PV system has the maximum daily output power of 610.35 kW at 13:00, due to the high temperature and sunlight at noon, while the maximum power of WT (747.80 kW) occurs at 2:00. These moments are not identified as peak power demand hours, and hence the high-efficiency operation of DGs may not be beneficial for valley filling of the load curve and affect the load rate as well as peak regulation management of the power system.
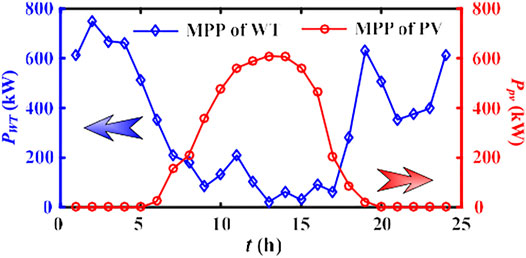
FIGURE 13. Output of DGs under MPPT control.
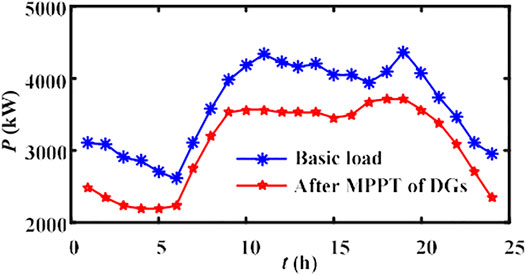
FIGURE 14. Load curve after MPPT control of DGs.
6.2 Discussion of Simulation Results in Stage 2
According to the operation modes of EVs analyzed in Section 4, the simulation research is carried out for three scenarios: Scenario 1 represents the power load with DGs compensation, whereas without integrated EVs or BESS; Scenario 2 is the aggregated charging mode of the 500 EVs, which are connected to charge station without guiding measures; while 80% of the EVs are turned on to be coordinated V2G operation mode in Scenario 3. Based on Stage 1, fully considering the travel demands of the EV owners, the load curves with integrated EVs under Scenario 2 and 3 are obtained, respectively, as exhibited in Figure 15.
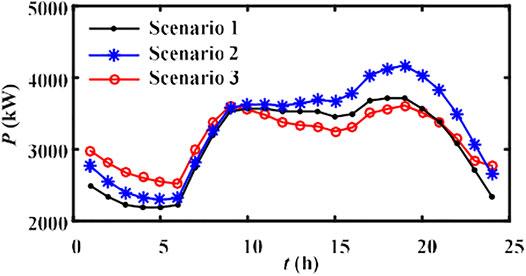
FIGURE 15. Load curves under different scenarios.
It can be observed that the original power load between 17:00 and 20:00 is intensified by aggregated EVs charging behavior, which puts forward higher requirements for the power supply of the DN. Concretely, for the load curve under Scenario 1, the peak load of 3,715 kW occurs at about 19:00, which would be further increased to 4,166.9 kW under Scenario 2, meaning that the overloading even power outage is most likely to take place at 19:00. Contrastively, under Scenario 3, the introduction of TOU price fully makes use of the energy reserve capacity and bidirectional power flow of EVs and realizes the power load shifting by encouraging owners to charge in valley hours and discharge in peak hours. The optimal peak and valley periods are, solved as (15:00–23:00) and (23:00–7:00), respectively, and the peak load at 19:00 is optimized to 3,608.3 kW (decreased by 13.41% compared to that of Scenario 2); concurrently, the PVD is evaluated to be 1,087.1 kW, decreased by 41.75% in contrast to the PVD of 1866.3 kW under Scenario 2. From the above analysis, it can be noted that residential power demands during peak hours can be effectively reduced, and the load curve is remarkably smoothed after peak shaving and valley filling, conducive to the subsequent active power loss and node voltage excursion optimization.
Through the power flow analysis, voltages for all of the nodes at 19:00 are also calculated (exhibited in Figure 16). Supposing that a voltage dip lower than 0.95 p.u. or a voltage higher than 1.05 p.u. is deemed as voltage out-of-limit, then it is discovered that the integration of the building load increases the power supply burden of the DN system, since the voltage drop problems are more serious. Only 11 node voltages are better than the lower bound, and the worst two occur on nodes 17 and 32 of 0.8378 and 0.8294 p.u.. DG1 and DG2 separately connected to nodes 2 and 5 can further support the system voltage. After the MPPT control for DG input (Scenario 1), the lowest value is still on the nodes of 17 and 32, which are raised to 0.8535 and 0.8472 p.u., and the relative voltage excursion of each node adds up to 2.9347 p.u., decreased by 10.54% compared to 3.2806 p.u. of the original building load. Next, with the integration of the EVs, it is discovered that the system voltage quality problem is intensified under the EV aggregated charging (Scenario 2), which causes the voltages of the two weakest nodes to seriously drop to 0.8451 p.u. and 0.8373 p.u. Contrastively, the system voltage is overall heightened on the coordinated regulation mode (Scenario 3), and the voltages of nodes 17 and 32 are raised up to 0.8555 p.u. and 0.8495 p.u., slightly better than the DN system operates in Scenario 1. Moreover, Table 1 illustrates the statistical results of the key indices involving the relative voltage excursion and power loss for the DN system under different scenarios. It is obvious that first, based on the flexible power supply of the DGs, MPPT control improves the utilization efficiency of clean energy and power capacity. Furthermore, due to the introduction of the TOU mechanism, the coordinated management of flexible loads inside the buildings not only boosts the utilization of EV but is conducive to the high efficiency and reliability of the DN operation. These follow the concept of energy conservation and emission reduction of the modern power system.
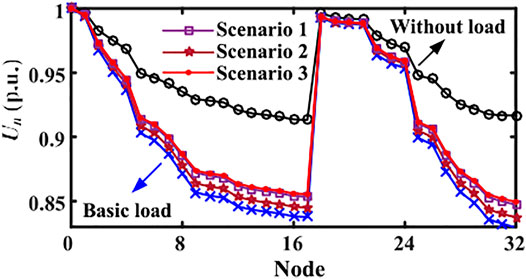
FIGURE 16. Voltage curves under different scenarios at 19:00.
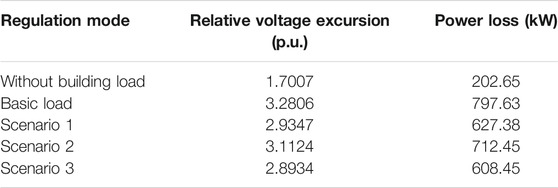
TABLE 1. Indices under different scenarios for the load peak at 19:00.
Furthermore, to elaborate the regulation results for the next control stage, the other two scenarios are defined.
Scenario 4: variable power dispatch of BESS, based on Scenario 3.
Scenario 5: SVC, capacitor banks put into operation based on Scenario 4.
Considering the impact of the intermittent generation from the integrated DGs on the power grid, the BESS system is commonly necessary for power load smoothing. Since the BESS has the attributes of source and load, it could further flatten the load curve by reasonably transferring power demand from peak to valley. Based on the variable power charge/discharge dispatch control of the BESS in Figure 7, it could be calculated that the peak shaving line (boundary 1) of 3,424.99 kW and valley filling line (boundary 2) of 2,793.49 kW make the PVD of the load curve reduce from 1,087.1 kW (Scenario 3) to 703.80 kW (Scenario 4, decreased about 35.26%). The peak shaving and valley filling effects and the real-time output of the BESS are shown in Figures 17, 18, respectively. The optimal scheduling of the BESS further consolidates the load shifting function, making the load curve more flat and centralized and conducive to power saving, to ensure more economic and safe operation of the power grid on the basis of the MPPT control of DGs and coordinated dispatch of EVs.
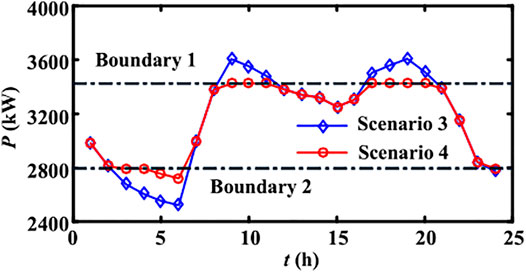
FIGURE 17. Load curves under different scenarios of EVs.
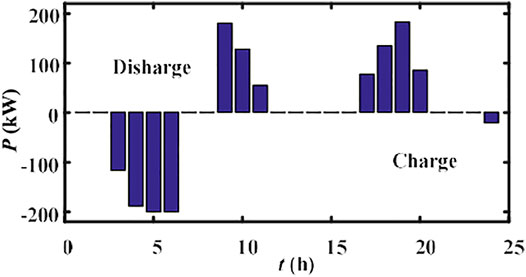
FIGURE 18. Daily dispatch plan of the BESS.
6.3 Discussion of Simulation Results in Stage 3
Ultimately, by using the improved GA with the EPS method analyzed in 5.3, the optimal compensation capacities of the SVC capacitor banks on nodes 17 and 32 are solved as 0.8513 and 0.9130 MVar, respectively. The risk of voltage out-of-limit is effectively reduced after reactive compensation, which can be testified by the final node voltage of 17 and 32 (0.9224 and 0.8961 p.u.), a significant improvement compared to values of Scenario 4 (0.8603 and 0.8520 p.u.). Based on the coordinated dispatch of EVs and BESS devices, Figure 19 declares the node voltages of the DN system at 19:00 before and after SVC capacitor compensation, emphasizing its excellent effect on voltage fluctuation suppression. After the proposed hierarchical optimization, the total voltage excursion is optimized to 2.0605 p.u. (decreased by 37.19% compared to that of the basic building load). More concretely, the daily output dispatch plan of the SVC can be dynamically solved out, as described in Figure 20. It can be observed that with the daily power load changing, the output capacity of the SVC is adjusted dynamically, to concurrently reduce the node voltage fluctuation and active power loss.
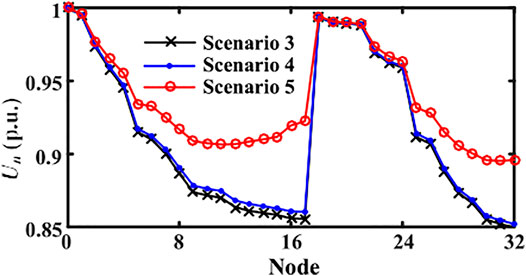
FIGURE 19. Voltage curves under different scenarios at 19:00.
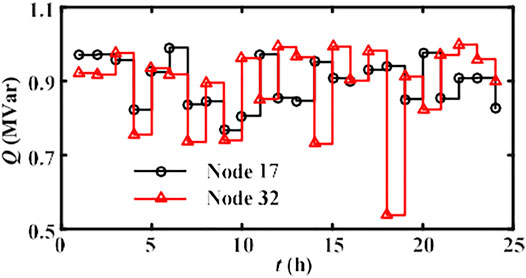
FIGURE 20. Daily dispatch plan of the SVC.
In addition, as shown in Table 2, when the SVC devices are not installed (Scenario 4), the active power loss of the system is decreased to 575.99 kW; which will be further reduced to 514.90 kW when the reactive compensation is available (Scenario 5). Compared with the power consumption of 797.63 kW for the original building load, the reduction under Scenario 1–5 achieves 21.34, 10.68, 23.72, 27.79, and 35.45%, respectively. Therefore, the MPPT control of the penetrated DGs, combined with the reasonable dispatch of EVs and BESS, could weaken the burden of the DN for power supply. Concurrently, the multi-objective reactive optimization approach also ensures the significant improvements of system power loss and node voltage quality, proving that the proposed hierarchical optimization strategy in this study could obtain outstanding performances. It is noteworthy that the response degree of total EV owners d has a crucial impact on the optimal effects. A higher d means more owners participating in the V2G management and the more obvious effect of minimizing the PVD resultantly, which makes for enhancing the initiative of users by economic interests and, concurrently, the economy and security operation of the DN system.
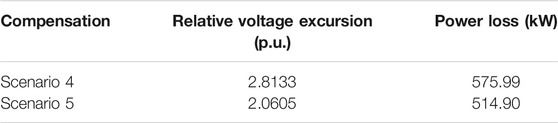
TABLE 2. Indices before and after compensation at 19:00.
7 Conclusion
As a demand-oriented energy supply system, a smart DN with multi-source coupling is a major strategic measure for domestic energy development and the trend of the global power system. However, owing to the hybrid access of user resources, natural resources, and time-space dispersed resources making the power supply diversified and unstable, the DN system faces great changes in architecture, which brings great challenges to the upper collaborative dispatch and optimization. Consequently, establishing on the fundamental principle of multi-source integration and DN optimization control, the hierarchical multi-source coordinated regulation strategy considering the penetration of DGs, EVs, and BESS is proposed in this study. Combining the efficient utilization of DGs, load shifting function of EVs and BESS, and the dynamic reactive compensation of SVC capacitor banks, the optimization strategy could effectively balance the tradeoff between active power loss and node voltage fluctuation, and its feasibility and effectiveness are illustrated through MATLAB simulation results. First, based on MPPT control, the self-optimizing processes of WT and PV output power are implemented for improving the power production efficiency of the DGs. Next, according to the dynamic load change, the TOU price mechanism is introduced to improve the initiative and utilization of bidirectional EVs and BESS by guiding the charging/discharging plans of the owners and achieving the peak shaving and valley filling function, which is significant for alleviating the power supply pressure of the DN. Finally, both total active power loss and node voltage fluctuation are selected as the optimization objectives, under the basic constraints, and the improved GA with EPS method is employed to determine the daily optimal SVC capacitor bank compensation plan for the multi-objective economic-secure scheduling problem. After the above hierarchical dispatch steps, the entire power loss and node voltage out-of-limit risk in the DN can be improved simultaneously, which promotes the economic and reliable operation of the regional DN. The research results in this study have good extensibility and may provide certain reference significance for exploring effective flexible load modeling and synergetic management technology of “source-grid-storage-load” system in the subsequent construction of smart DNs. Nevertheless, the application would be subject to some limitations. First, if other objective functions are also paid attention to, it is better to adopt efficient multi-objective solvers instead of a single-objective optimizer by regulating the weight coefficients ω1 and ω2. Moreover, influences of parameter uncertainties, such as DGs and power load are not taken into account in this study. Finally, if different types of distributed energy equipment are to be surveyed, mathematical models should be modified according to the actual running characteristics.
Data Availability Statement
The original contributions presented in the study are included in the article/Supplementary Material; further inquiries can be directed to the corresponding authors.
Author Contributions
Conceptualization and methodology: ZH; software: PM and MW; modeling: ZH, PM, and MW; validation: ZH; writing—original draft preparation: ZH; writing—review and editing: BF and MZ; supervision: MZ; project administration: BF.
Funding
This work was supported by the Natural Science Foundation of Hunan Province (2017JJ5044), the Scientific Research Foundation of Hunan Provincial Education Department (20C0613, 21C0428), and the Hunan High-Tech Industry Science and Technology Innovation Leading Foundation of China (2022GK4055).
Conflict of Interest
The authors declare that the research was conducted in the absence of any commercial or financial relationships that could be construed as a potential conflict of interest.
Publisher’s Note
All claims expressed in this article are solely those of the authors and do not necessarily represent those of their affiliated organizations, or those of the publisher, the editors, and the reviewers. Any product that may be evaluated in this article, or claim that may be made by its manufacturer, is not guaranteed or endorsed by the publisher.
Acknowledgments
Most sincere thanks are due to Miss Hong and Dr. Wang for the kind care during my injury and the great encouragements to me to finish this work.
References
Barcellona, S., Piegari, L., and Villa, A. (2019). Passive Hybrid Energy Storage System for Electric Vehicles at Very Low Temperatures. J. Energ. Storage 25, 100833. doi:10.1016/j.est.2019.100833
Brockway, P. E., Owen, A., Brand-Correa, L. I., and Hardt, L. (2019). Estimation of Global Final-Stage Energy-Return-On-Investment for Fossil Fuels with Comparison to Renewable Energy Sources. Nat. Energ. 4 (7), 612–621. doi:10.1038/s41560-019-0425-z
Chen, G., Dai, P., and Zhou, H. (2013). Distribution System Reconfiguration Considering Distributed Generators and Plug-In Electric Vehicles [J]. Power Syst. Tech. 37 (1), 82–88.
Dong, L., Li, J., Pu, T., and Chen, N. (2019). Distributionally Robust Optimization Model of Active Distribution Network Considering Uncertainties of Source and Load. J. Mod. Power Syst. Clean. Energ. 7 (6), 1585–1595. doi:10.1007/s40565-019-0558-x
Elbatawy, S., and Morsi, W. (2022). Integration of Prosumers with Battery Storage and Electric Vehicles via Transactive Energy. IEEE Trans. Power Deliv. 37 (1), 383–394. doi:10.1109/tpwrd.2021.3060922
Fang, B., Li, B., Li, X., Jia, Y., Xu, W., and Liao, Y. (2021). Multi-Objective Comprehensive Charging/Discharging Scheduling Strategy for Electric Vehicles Based on the Improved Particle Swarm Optimization Algorithm. Front. Energ. Res. 9, 811964. doi:10.3389/fenrg.2021.811964
Gholami Farkoush, S., Wadood, A., Khurshaid, T., Kim, C.-H., and Rhee, S.-B. (2019). Minimizing Static VAR Compensator Capacitor Size by Using SMC and ASRFC Controllers in Smart Grid with Connected EV Charger. Int. J. Electr. Power Energ. Syst. 107, 656–667. doi:10.1016/j.ijepes.2018.12.029
Hosseinalizadeh, R., Shakouri G, H., Amalnick, M. S., and Taghipour, P. (2016). Economic Sizing of a Hybrid (PV-WT-FC) Renewable Energy System (HRES) for Stand-Alone Usages by an Optimization-Simulation Model: Case Study of Iran. Renew. Sust. Energ. Rev. 54, 139–150. doi:10.1016/j.rser.2015.09.046
Huang, Z., Fang, B., and Deng, J. (2020). Multi-objective Optimization Strategy for Distribution Network Considering V2G-Enabled Electric Vehicles in Building Integrated Energy System [J]. Prot. Control. Mod. Power Syst. 5 (1), 1–8. doi:10.1186/s41601-020-0154-0
Islam, M. R., Lu, H., Hossain, J., Islam, M. R., and Li, L. (2020). Multiobjective Optimization Technique for Mitigating Unbalance and Improving Voltage Considering Higher Penetration of Electric Vehicles and Distributed Generation. IEEE Syst. J. 14 (3), 3676–3686. doi:10.1109/jsyst.2020.2967752
Jiao, F., Zou, Y., and Zhang, X. (2021). A Three-Stage Multi-Timescale Framework for Online Dispatch in a Microgrid with EVs and Renewable Energy [J]. IEEE Trans. Trans Electri. 1 1. doi:10.1109/tte.2021.3098687
Koutroulis, E., Kalaitzakis, K., and Voulgaris, N. C. (2001). Development of a Microcontroller-Based, Photovoltaic Maximum Power point Tracking Control System. IEEE Trans. Power Electron. 16 (1), 46–54. doi:10.1109/63.903988
Luo, X., and Niu, S. (2016). A Novel Contra-rotating Power Split Transmission System for Wind Power Generation and its Dual MPPT Control Strategy [J]. IEEE Trans. Power Elect. 32 (9), 6924–6935.
Luo, Y., Feng, G., Wan, S., Zhang, S., Li, V., and Kong, W. (2020). Charging Scheduling Strategy for Different Electric Vehicles with Optimization for Convenience of Drivers, Performance of Transport System and Distribution Network. Energy 194, 116807. doi:10.1016/j.energy.2019.116807
Mahmoudi, S. K., Golshan, M. E. H., and Zamani, R. (2021). Coordinated Voltage Control Scheme for Transmission System Considering Objectives and Constraints of Network and Control Devices. Electric Power Syst. Res. 192, 106908. doi:10.1016/j.epsr.2020.106908
Peidong, Z., Yanli, Y., jin, S., Yonghong, Z., Lisheng, W., and Xinrong, L. (2009). Opportunities and Challenges for Renewable Energy Policy in China. Renew. Sust. Energ. Rev. 13 (2), 439–449. doi:10.1016/j.rser.2007.11.005
Podder, A. K., Roy, N. K., and Pota, H. R. (2019). MPPT Methods for Solar PV Systems: a Critical Review Based on Tracking Nature. IET Renew. Power Generation 13 (10), 1615–1632. doi:10.1049/iet-rpg.2018.5946
Qian, K., Zhou, C., and Allan, M. (2010). Modeling of Load Demand Due to EV Battery Charging in Distribution Systems [J]. IEEE Trans. Power Syst. 26 (2), 802–810.
Siahroodi, H. J., Mojallali, H., and Mohtavipour, S. s. (2021). Scenario-based Stochastic Framework for Harmonic Power Markets Using Plug-In Electric Vehicles. J. Energ. Storage 35, 102290. doi:10.1016/j.est.2021.102290
Tan, B., and Chen, H. (2020). Multi-objective Energy Management of Multiple Microgrids under Random Electric Vehicle Charging. Energy 208, 118360. doi:10.1016/j.energy.2020.118360
Wu, C., Gao, S., Liu, Y., Song, T. E., and Han, H. (2021). A Model Predictive Control Approach in Microgrid Considering Multi-Uncertainty of Electric Vehicles. Renew. Energ. 163, 1385–1396. doi:10.1016/j.renene.2020.08.137
Xiong, L., Liu, X., and Liu, Y. (2020). Modeling and Stability Issues of Voltage-Source Converter Dominated Power Systems: A Review. Csee Jpes, 1–18. doi:10.17775/CSEEJPES.2020.03590
Xu, T., Ren, Y., Guo, L., Wang, X., Liang, L., and Wu, Y. (2021). Multi-objective Robust Optimization of Active Distribution Networks Considering Uncertainties of Photovoltaic. Int. J. Electr. Power Energ. Syst. 133, 107197. doi:10.1016/j.ijepes.2021.107197
Yao, C., Chen, M., and Hong, Y. Y. (2017). Novel Adaptive Multi-Clustering Algorithm-Based Optimal ESS Sizing in Ship Power System Considering Uncertainty [J]. IEEE Trans. Power Syst. 33 (1), 307–316.
Zarei, M., and Zangeneh, A. (2017). Multi-objective Optimization Model for Distribution Network Reconfiguration in the Presence of Distributed Generations [J]. Int. Trans. Electr. Energ. Syst. 27 (12), e2425. doi:10.1002/etep.2425
Zeng, L., Li, C., and Li, Z. (2020). Hierarchical Bipartite Graph Matching Method for Transactive V2V Power Exchange in Distribution Power System [J]. IEEE Trans. Smart Grid 12 (1), 301–311. doi:10.1109/TSG.2020.3016597
Zhang, H., Xu, Z., Sun, C., and Elahi, E. (2018). Targeted Poverty Alleviation Using Photovoltaic Power: Review of Chinese Policies. Energy Policy 120, 550–558. doi:10.1016/j.enpol.2018.06.004
Keywords: distribution network, distributed generators, electric vehicles, vehicle-to-grid, multi-objective optimization, coordinated dispatch
Citation: Huang Z, Ma P, Wang M, Fang B and Zhang M (2022) A Hierarchical Strategy for Multi-Objective Optimization of Distribution Network Considering DGs and V2G-Enabled EVs Integration. Front. Energy Res. 10:869844. doi: 10.3389/fenrg.2022.869844
Received: 05 February 2022; Accepted: 18 February 2022;
Published: 10 March 2022.
Edited by:
Liansong Xiong, Nanjing Institute of Technology (NJIT), ChinaReviewed by:
Long Zeng, Guangdong University of Technology, ChinaPu Liu, Zhengzhou University of Light Industry, China
Copyright © 2022 Huang, Ma, Wang, Fang and Zhang. This is an open-access article distributed under the terms of the Creative Commons Attribution License (CC BY). The use, distribution or reproduction in other forums is permitted, provided the original author(s) and the copyright owner(s) are credited and that the original publication in this journal is cited, in accordance with accepted academic practice. No use, distribution or reproduction is permitted which does not comply with these terms.
*Correspondence: Zhao Huang, c2t5aHVhbmcxOTg1QGhvdG1haWwuY29t; Baling Fang, NTkxMTg2NkBxcS5jb20=