 Wang Xiong
 Yuan Fang1
 Shengfei Wang
95% of researchers rate our articles as excellent or good
Learn more about the work of our research integrity team to safeguard the quality of each article we publish.
Find out more
ORIGINAL RESEARCH article
Front. Energy Res. , 01 April 2022
Sec. Nuclear Energy
Volume 10 - 2022 | https://doi.org/10.3389/fenrg.2022.869240
This article is part of the Research Topic Experimental and Analytical Investigations on Nuclear Reactor Safety, Severe Accident Phenomena and Severe Accident Mitigation of Nuclear Power Plants View all 20 articles
In the main steam line break (MSLB) accident, the rise in temperature and pressure threatens the integrity of the containment, which is caused by a large amount of mixed gas injected into the containment rapidly. Due to the structural difference between small and large containment, it is necessary to study the heat transfer in the complex space of the small containment. Based on the research method, which is from simple to complex, in this study, a series of experiments and numerical simulations are carried out with different jet positions and sizes using hot air without phase change as the working medium. The results show that the temperature field above the jet is complex and affected by many factors such as buoyancy, initial kinetic energy, and internal structure. When the jet flow rate is constant, the jet size is smaller and the velocity is faster, which results in a large circulation and stronger heat exchange with the wall of containment. This means that the temperature above the jet is lower than the large jet size, and the temperature below the jet is slightly higher. The jet position mainly affects the relative position of the jet and the complex space in the containment. When the jet is located in a narrow space, the overall temperature in the containment is higher than the jet located in a large space. In addition, when it is close to the obstacle, the core region of the jet will shift slightly toward the obstacle.
As the last barrier of the reactor, the containment must ensure its integrity by preventing over-temperature and over-pressure in it. When MSLB accidents or LOCAs occur, a large amount of high-temperature and high-pressure mixed gas will be released from the break into the containment and threatens the integrity of the containment. Therefore, the heat transfer in the containment is the key problem during the MSLB accident/LOCA. Currently, research on large-scale containment is nearly mature. However, the volume of small-scale containments is significantly smaller than that of large-scale containments, and the low heat capacity and rapid boost pressure after an accident are the main characteristics that distinguish them from large-scale containments. Therefore, the heat transfer mechanism and empirical formulas in the containment of large reactors are not suitable for small containment completely. Papini et al. (2011) implemented a simplified model of IRIS containment drywell with RELAP5 to investigate the effect of drywell temperature and pressure response, heat transfer coefficient (HTC) and steam volume fraction distribution, and internal recirculating mass flow rate on containment behavior prediction. Zhang et al. (2015) developed a new code, which is based on thermal stratification and is used to solve heat transfer problems in large enclosures, which can give good results in a short time without complex meshing. Niu et al. (2016) conducted the experiment with various jet inlet temperatures and flow rates to identify the influence of plumes or buoyant jets on thermal stratification phenomena. Wang et al. (2017) conducted the experiment with various jet inlet temperatures and spray water flow rates to identify their influence on the thermal stratification phenomena during the LOCA or MSLB accidents. Albadawi et al. (2018) explained the phenomenon of thermal stratification in SMR’s reactor pool by comparing experimental data and simulation results. In Kim et al. (2020), the accident sequence during an SBO accident was simulated using the CINEMA-SMART (code for integrated severe accident management and analysis–SMART) code to evaluate the transient scenario inside the reactor vessel after an initiating event, core heating and melting by core uncovery, relocation of debris, reactor vessel failure, discharge of molten core, and pressurization of the containment. Liu et al. (2020) analyzed the steam mass and energy released from the break, in comparison with the prototype and the experimental facility modeled by MELCOR.
Due to the complex factors, the study is divided into 3 stages. Stage 1 used hot air without phase change as a working medium, and stages 2 and 3 used steam and mixed gas, respectively. In our previous work (Lin et al., 2021), we have studied the heat transfer phenomenon in the complex space of small steel containment using hot air as the working medium with various jet inlet temperatures, velocities, and heights. In this study, we studied the influence of different jet sizes and different jet positions on it, which are two other factors with air as the working medium. A series of experiments were carried out, and the experimental results were compared with the simulation results to analyze the heat transfer phenomenon.
The previous experimental facility (Lin et al., 2021) was retrofitted to suit this research. As shown in Figure 1, the experimental facility mainly consists of six devices: high-pressure fan, heater, measuring system, containment, data acquisition system, and computer. The equipment and instruments used in the experiment have been calibrated. According to the calibration result, the measurement error and uncertainty are shown in Table 1. The height of the containment is 2.4 m, which has a platform with a height of 0.77 m at the bottom. The material of the containment shell is 304 stainless steel without coating. The containment consists of two accumulated tanks (ACC) and two core makeup tanks (CMT). The interval of each layer between A-1 and A-7 is 200 mm, and the interval of A-7 and A-8 is 1,000 mm. In addition, another temperature measurement point is set in the heater and near the jet. The size of the containment and the distribution of the measuring points are shown in Figure 2 (units = mm).
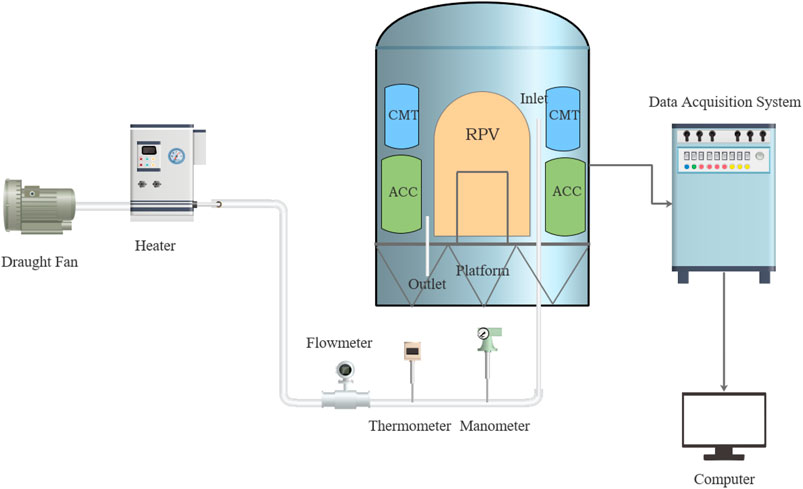
FIGURE 1. Schematic of the experimental facility.
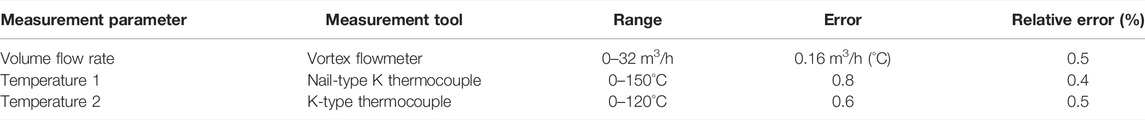
TABLE 1. Measurement error and uncertainty.
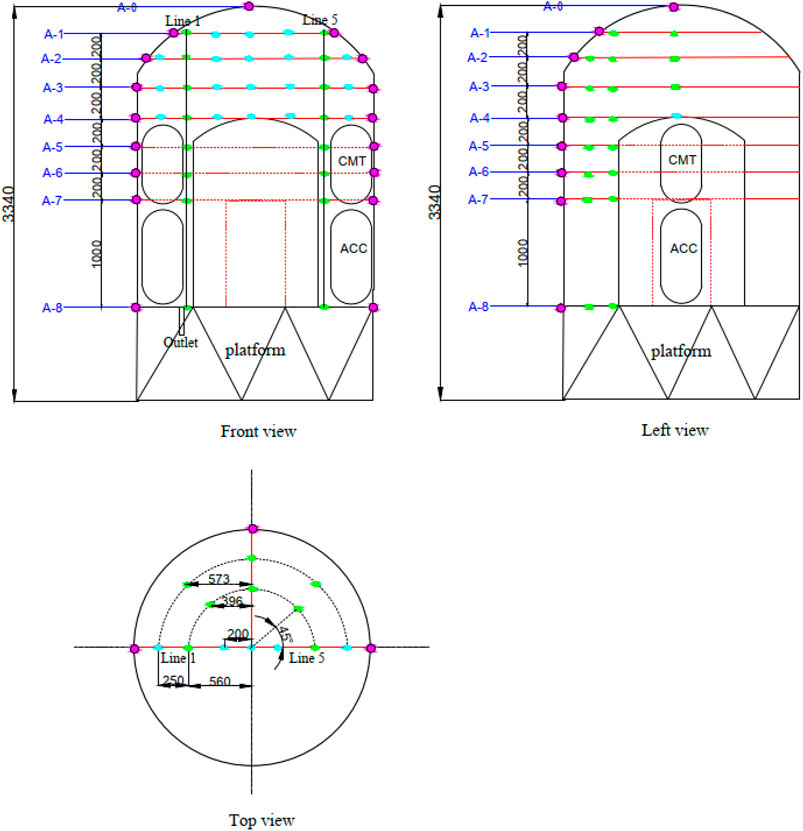
FIGURE 2. Distribution of thermocouples.
Air is used as the working medium to study the influence of different jet sizes and jet positions on temperature distribution. The specific experimental data are shown in Table 2. The jet position corresponding to the horizontal location of the jet at different angles is shown in Figure 3.
TABLE 2. Experimental conditions.
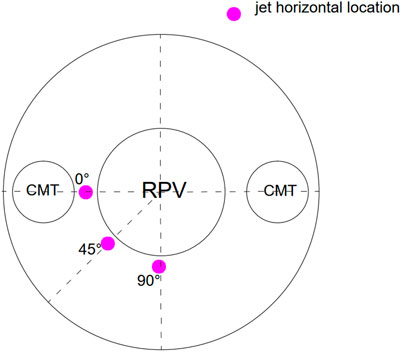
FIGURE 3. Top view of various jet horizontal locations.
The experiment procedure is divided into 4 steps:
1) The initial temperature of the experiment facility is the room temperature of the laboratory, and the cooling condition is natural convection of air.
2) The airflow rate is adjusted by changing the power of the high-pressure fan; meanwhile, the heater is adjusted so that the temperature of the jet reaches the working temperature.
3) With hot air injected by the jet, the temperature inside the containment increased rapidly. At the same time, the external environment continuously cooled down the wall of the containment by natural convection until stabilization.
4) It takes about 2 h for the temperature field to enter the quasi-steady state. Each experiment lasts for more than 3 h to ensure the accuracy of the experimental results.
Figure 4 shows the temperature distribution with height at line 1 (L1) and line 5 (L5) under different jet positions. It can be seen from Figure 4 that the temperature distribution at L1 and L5 at case 2 and case 3 is similar, while the upper temperature of L1 at case 1 is higher than that of the other two cases because the injected hot air directly reaches the position of L5. Then, hot air went through the dome of the containment and downward along the L1. The reason why the bottom temperature (x = 0.0 m) of case 2 and case 3 at L5 is higher than that of x = 1.0 m is that the jet pipe penetrates through the containment from the bottom near L5 in the experimental facility. Although there is insulation outside the jet pipe, the temperature of the air near the jet pipe is a little higher. It can be seen from Figure 4B that the temperature of case 1 is generally higher than that of the other two cases, because in case 1, the jet flow is located near L5, and the temperature measuring point at the lower space of the jet is affected by the jet pipe heat dissipation, while x = 1.5 m is the highest because of the jet core region.
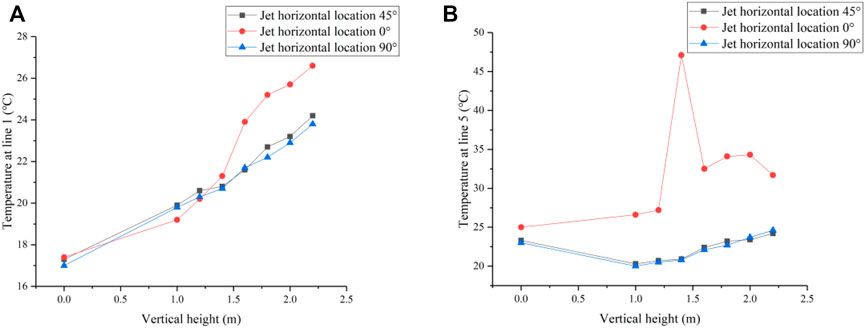
FIGURE 4. Temperature distribution with height at L1 and L5 under different jet positions. (A) L1. (B) L5.
Figure 5 illustrates radial temperature distribution at H = 1.8 m and H = 2.2 m. The temperature of case 1 is generally higher than that of the other two working conditions when H = 1.8 m and H = 2.2 m. This is mainly determined by two factors: The first is that the jet of case 1 is located in a narrow space between the two tanks, which results in the jet in this case being a restricted jet flow, whereas it is a free-developing jet flow in case 2 and case 3. The second is that the measuring point is located in the core region of the jet in case 1, which leads to a peak temperature of x = 0.5 m.
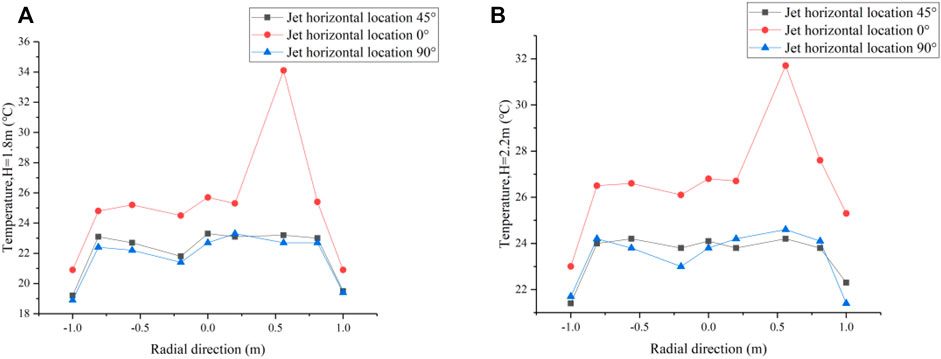
FIGURE 5. Radial temperature distribution at H = 1.8 m and H = 2.2 m under different jet positions. (A) H = 1.8 m. (B) H = 2.2 m.
The change of jet position is equivalent to the change of the relative position in the complex space of the containment, thus affecting the flow and heat transfer of the jet.
Figure 6 shows the temperature distribution with height at L1 and L5 under different jet sizes. In the upper space (H ≥ 1.8 m) of the containment, the temperature of case 4 is the lowest, and the temperatures of other cases are similar. The temperature distributions of the 3 cases are similar in the middle space (1.2 m < H < 1.8 m). In the lower space (H ≤ 1.2 m), the temperature of case 4 is the highest, and the temperatures of the other two cases are similar. This is because when the mass flow rate is the same, the larger the diameter of the jet is, the lower the jet velocity. Case 4, with a higher jet velocity, easily forms a large circulation in the containment, which results in a lower temperature of the upper space and a higher temperature of the lower space than other cases. In Figure 6B, only case 1 has a peak temperature. The possible reason for this is that the measuring point (x = 1.4 m) is located in the core region of the jet flow in case 1.
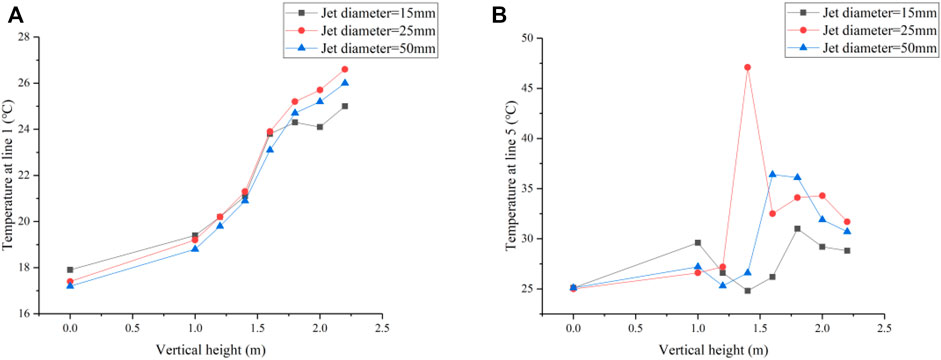
FIGURE 6. Temperature distribution with height at L1 and L5 under different jet diameters. (A) L1. (B) L5.
Figure 7 illustrates radial temperature distribution at H = 1.8 m and H = 2.2 m. When H = 1.8 m and x = 0.5 m, the temperature increases with the increase in the jet size. This is because it is close to the jet, and the increase in the jet size leads to a decrease in the velocity, so the temperature is high here. However, when H = 2.2 m, the peak temperature of case 1 is the highest. As the height increases, it needs more kinetics to transfer heat to this position. The smaller the size of the jet, the higher the velocity, and the stronger the heat dissipation around, but at the same time, the cone of the jet core region is also smaller, which leads to decreased heat dissipation, and the final temperature depends on which is the main factor.
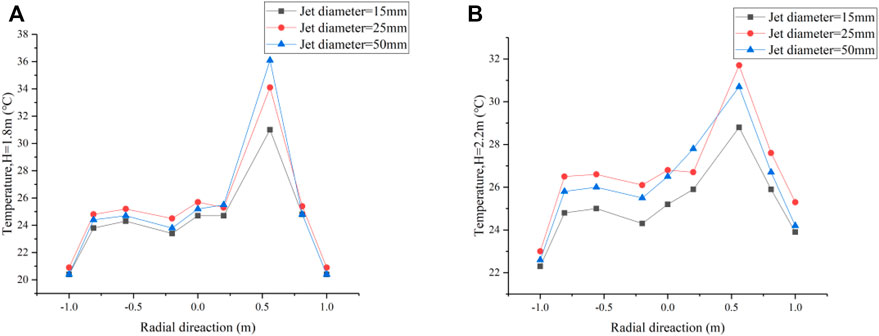
FIGURE 7. Radial temperature distribution at H = 1.8 m and H = 2.2 m under different jet positions. (A) H = 1.8 m. (B) H = 2.2 m.
When the jet size changes, the most important effect is that the jet velocity changes. A large loop is formed throughout the containment vessel because of the high velocity. It only circulates in the upper space of the containment vessel at a moderate velocity. However, when the jet velocity is lower, the jet’s kinetic energy is too small to form a circulation after it reaches the dome of the containment, and the main force is buoyancy.
Steady simulation using ANSYS CFX was performed based on the experimental conditions. The following experimental model (Figure 8) is established, and its mesh quality is shown in Figure 8. A jet size of 25 mm was taken as an example to verify the mesh independence. The total number of grids was selected as 1 million, 2 million, and 3 million, respectively. The temperature of the center in the containment dome (H = 2.0 m) was taken as a reference, and the errors were compared with 3 million grids. As shown in Tables 2, 3, million grids can meet the computing requirements.
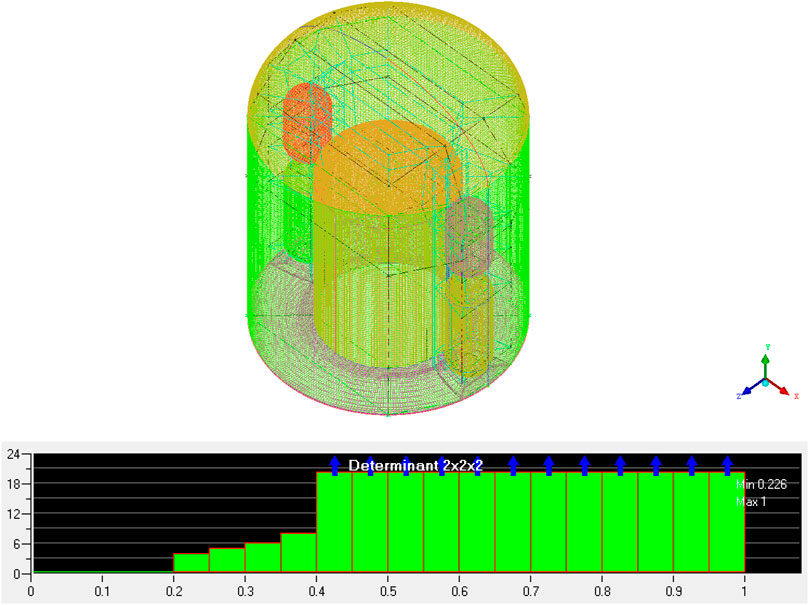
FIGURE 8. Meshing model and quality.
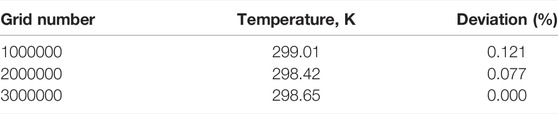
TABLE 3. Grid independence test.
In the numerical simulation, the outer wall temperature was set at 15°C. Taking the jet size = 25 mm and jet horizontal location 45° as examples, the experimental results of L1 were compared with the numerical simulation results. According to Figure 9, the trend of temperature variation between the experimental results and the numerical simulation results is similar, but the results of the simulation are generally lower than those of the experiment. The reason is that the simulations used constant wall temperatures, but the temperature of the containment wall increased during the experiment.
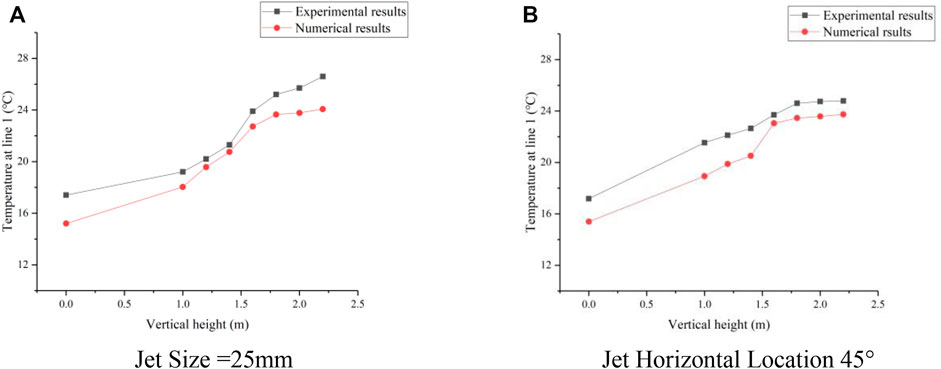
FIGURE 9. Comparison of experiment results and numerical results. (A) Jet size = 25 mm. (B) Jet horizontal location 45°.
Figures 10–13 show the numerical simulation results of jet sections under different jet sizes and jet positions.
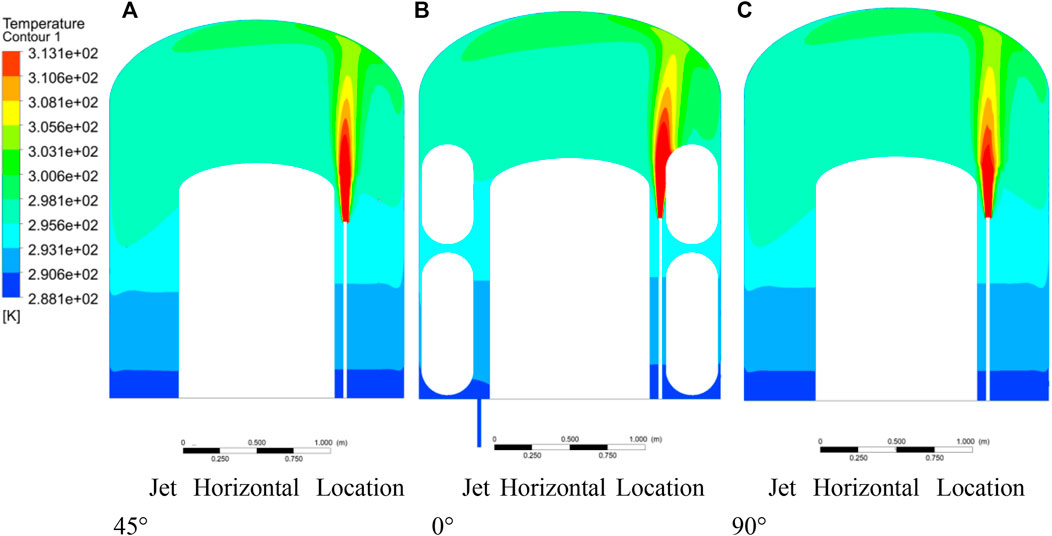
FIGURE 10. Temperature filed of the containment at different jet positions. (A) Jet horizontal location 45°. (B) Jet horizontal location 0°. (C) Jet horizontal location 90°.
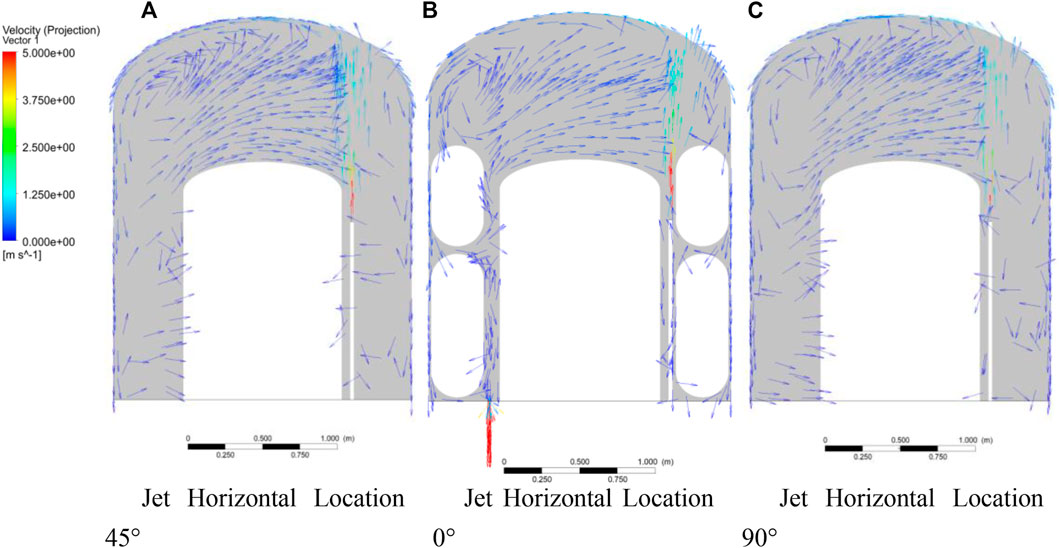
FIGURE 11. Distribution of velocity vectors in the containment at different jet diameters. (A) Jet horizontal location 45°. (B) Jet horizontal location 0°. (C) Jet horizontal location 90°.
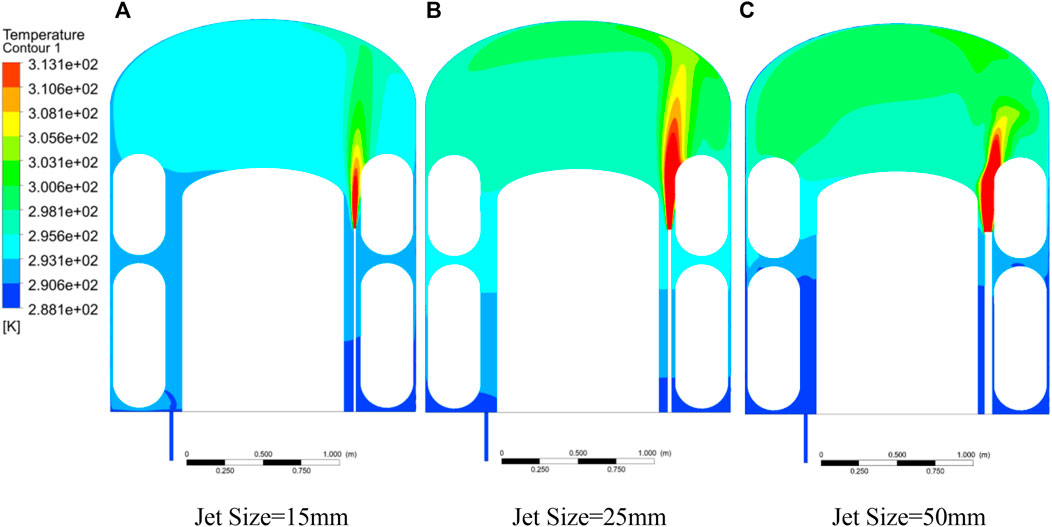
FIGURE 12. Temperature filed of the containment at different jet diameters. (A) Jet size = 15 mm. (B) Jet size = 25 mm. (C) Jet size = 50 mm.
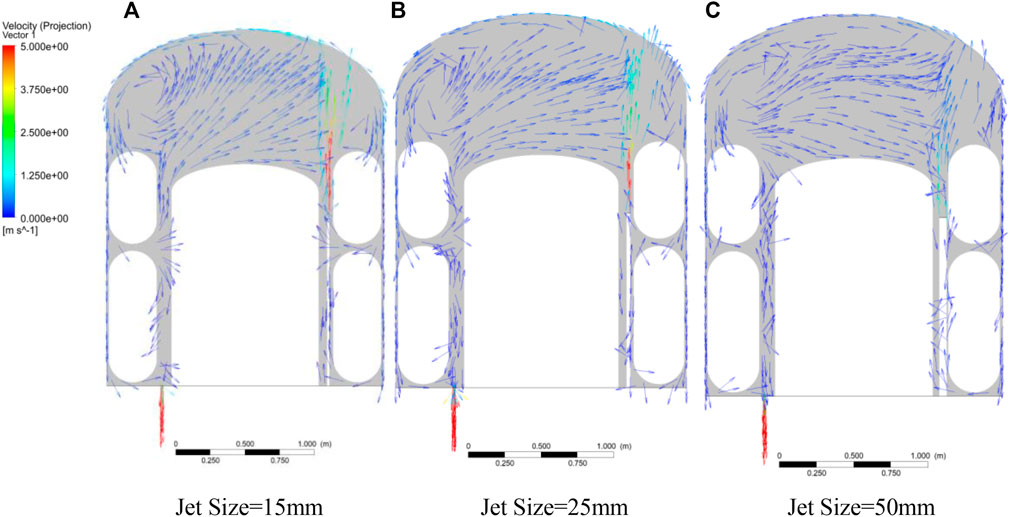
FIGURE 13. Distribution of velocity vectors in the containment at different jet diameters. (A) Jet size = 15 mm. (B) Jet size = 25 mm. (C) Jet size = 50 mm.
It can be seen from Figure 10 that the temperature fields of the three working conditions at the core region are similar, but there is some difference in the temperature field in the middle of the containment. The temperature in this area in Figure 10B is slightly lower than that in the other two working conditions, which indicates that obstacles have an influence on heat transfer and restrain heat transfer in the local area. In addition, the core region in Figure 10B is disturbed by obstacles and tends to tilt slightly toward the side with higher obstacles. Figure 11 shows the velocity vectors in the containment. The velocity distribution is similar between Figures 11A,C, and it is different in Figure 11B because of the obstacles (4 small tanks). For the length of the core region of the jet, Figure 11B is also the largest. This is mainly because the obstacles limited the jet diffused and reduced kinetic dissipation.
It can be seen from Figure 12 that the temperature difference between the upper and lower spaces of Figure 12A is the smallest, and the temperature difference between the upper and lower spaces of Figure 12C is the largest. Furthermore, the jet flow to the dome of the containment and transform to plume are shown in Figure 12C. In addition, both the areas of core regions of temperature in Figure 12A and Figure 12C are smaller than that of Figure 12B. This is because high velocity at the dome surface leads to strong heat exchange with the environment in Figure 12A. The core region of Figure 12C is small because the velocity is too small to transfer heat far in vertical direction. Obstacles (tanks) on both sides block the development of the jet core region. Moreover, the lower the velocity, the easier it is to swerve to the side of the obstacle because of the Coanda effect, which states that a fluid or gas stream will hug a convex contour when directed at a tangent to that surface. It can be seen from Figure 13 that the smaller the jet size, the larger the core region of velocity. Moreover, the larger the core region of velocity, the more intense the entrainment effect, which leads to a difference of the flow field in the dome of the containment.
To study the heat transfer phenomenon in the complex space of small and medium steel containment vessels during jet flow, a series of experiments and numerical simulations were carried out with hot air as the working medium. The diameter and location of the jet are mainly considered, and the following conclusions are drawn:
1) The jet position mainly affects the jet flow pattern by relative position in the complex structure of the containment. When the jet is located in a narrow space, the overall temperature in the containment is higher than the jet located in a large space. When it is close to the obstacle, the core region of the jet will shift slightly toward the obstacle because of the Coanda effect.
2) With the jet sizes changing, the main effect is that the jet velocity changes. The smaller the jet size, the higher the velocity. It is easy to form a circulation in the containment to enhance heat transfer, and the overall temperature is lower. The jet kinetic energy is too small to form a circulation after it reaches the dome of the containment, and the main force is buoyancy.
3) The temperature field inside the small containment vessel is affected by the jet parameters and local structure. In the upper space of the containment, it is mainly affected by the jet parameters, and in the lower space, it is mainly affected by the buoyancy and local structure.
The raw data supporting the conclusion of this article will be made available by the authors, without undue reservation.
WX: writing—original draft, investigation, and formal analysis. YF carried out the experiments and analysis. SL: construction of the facility and analysis. SW: conceptualization, methodology, formal analysis, resources, data curation, writing—editing, and project administration.
This research is supported by the National Key Research Development Project of China (Grant No. 2020YFB1901405), the National Natural Science Foundation of China (No. 11805068), and the Fundamental Research Funds for the Central Universities (2020MS030).
Author SL was employed by the company China Nuclear Power Engineering Co., Ltd.
The remaining authors declare that the research was conducted in the absence of any commercial or financial relationships that could be construed as a potential conflict of interest.
All claims expressed in this article are solely those of the authors and do not necessarily represent those of their affiliated organizations, or those of the publisher, the editors and the reviewers. Any product that may be evaluated in this article, or claim that may be made by its manufacturer, is not guaranteed or endorsed by the publisher.
Albadawi, G., Wang, S., and Cao, X. (2018). Numerical and Experimental Study of Thermal Stratification outside a Small SMR Containment Vessel. Sustainability 10 (7), 2332. doi:10.3390/su10072332
Kim, H. T., Song, J. H., and Park, R-J. (2020). Simulation of a Station Blackout Accident for the SMART Using the CINEMA Code. Front. Energ. Res. 8. doi:10.3389/fenrg.2020.503918
Lin, S., Wang, S., Niu, F., and Jiang, X. (2021). Experimental Study of Heat Transfer with a Jet Flow in the Complex Space of Small Steel Containment. Ann. Nucl. Energ. 154, 108124. doi:10.1016/j.anucene.2020.108124
Liu, X., Meng, Z., Zhang, N., and Sun, Z. (2020). Scaling Design of the Pressure Response Experimental Facility for Pressure Suppression Containment. Front. Energ. Res. 8. doi:10.3389/fenrg.2020.524445
Niu, F., Zhuo, W., Cai, J., Su, X., Hu, Y., Zhao, Y., et al. (2016). The Studies of Mixing and thermal Stratification in SMR Containments. Nucl. Eng. Des. 298, 14–24. doi:10.1016/j.nucengdes.2015.11.018
Papini, D., Grgić, D., Cammi, A., and Ricotti, M. E. (2011). Analysis of Different Containment Models for IRIS Small Break LOCA, Using Gothic and RELAP5 Codes. Nucl. Eng. Des. 241 (4), 1152–1164. doi:10.1016/j.nucengdes.2010.06.016
Wang, S., Wang, Y., Zhuo, W., Niu, F., Yu, Y., Guo, Z., et al. (2017). Experimental Analysis of Steam Mixing and thermal Stratification Phenomena Related to Small Steel Containment Studies. Ann. Nucl. Energ. 109, 103–112. doi:10.1016/j.anucene.2017.05.021
Keywords: small steel containment, complex space, heat transfer, jet position, jet size
Citation: Xiong W, Fang Y, Lin S and Wang S (2022) Study on the Effect of Jet Position and Size on Heat Transfer in a Small Containment. Front. Energy Res. 10:869240. doi: 10.3389/fenrg.2022.869240
Received: 04 February 2022; Accepted: 28 February 2022;
Published: 01 April 2022.
Edited by:
Yapei Zhang, Xi’an Jiaotong University, ChinaReviewed by:
Zhaoming Meng, Harbin Engineering University, ChinaCopyright © 2022 Xiong, Fang, Lin and Wang. This is an open-access article distributed under the terms of the Creative Commons Attribution License (CC BY). The use, distribution or reproduction in other forums is permitted, provided the original author(s) and the copyright owner(s) are credited and that the original publication in this journal is cited, in accordance with accepted academic practice. No use, distribution or reproduction is permitted which does not comply with these terms.
*Correspondence: Shengfei Wang, enQ5NzA4MzFAbmNlcHUuZWR1LmNu
Disclaimer: All claims expressed in this article are solely those of the authors and do not necessarily represent those of their affiliated organizations, or those of the publisher, the editors and the reviewers. Any product that may be evaluated in this article or claim that may be made by its manufacturer is not guaranteed or endorsed by the publisher.
Research integrity at Frontiers
Learn more about the work of our research integrity team to safeguard the quality of each article we publish.