 Yidong Wang
 Cagfer Yanarates
- Electrical and Electronic Engineering Department, Swansea University Bay Campus, Swansea, United Kingdom
In this study, a novel PV emulator and the state-of-art learning–based real-time hybrid global search adaptive perturb and observe (P&O) maximum power point tracking (MPPT) algorithm have been presented. The prime objective of the constructed emulator based on integration of unilluminated solar panels with an external current source to overcome the constraints such as the need for wide surrounding space, high installation cost, and lack of control over the environmental conditions. Moreover, the developed algorithm resolved the drawbacks of the conventional P&O MPPT method associated with the use of a constant perturbation size that leads to poor transient response, high continuous steady-state oscillation, and inefficient tracking performance of maximum power point voltage in the presence of partial shading. The intended algorithm has been verified using MATLAB/Simulink by applying comparative analysis with the conventional P&O MPPT. In addition, the performance of the proposed control scheme is validated experimentally with the implementation of MATLAB/Simulink/Stateflow a on dSPACE Real-Time-Interface (RTI) 1007 processor board and DS2004 A/D and CP4002 Digital I/O boards. The results indicate that the algorithm is effective in reducing power losses and faster in tracking the speed of the maximum power point with less oscillation. In addition, excellent dynamic characteristics of the proposed emulator have been proven to be an ideal tool for testing PV inverters and various maximum power point tracking (MPPT) algorithms for commercial applications and university studies.
Introduction
Over the last several decades, utilization of the renewable energy sources for power generation has shown a prominent increase due to the underlying reasons such as depletion of unsustainable energy resources, environmental considerations, and technological advances in renewable energy (Andújar et al., 2016). When considering the lifecycle of emissions from cleaner energy sources, specifically from each stage in a technology’s lifespan (from manufacturing to decommissioning), global warming emissions from sustainable energy sources are almost non-existent (Edenhofer et al., 2011).
PV systems basically consist of a PV array and switch mode power supply (SMPS). SMPSs are the most essential components in PV systems owing to their functions of increasing the efficiency, providing reliability, and cost-effectiveness (Yanarates and Zhou, 2022). The primary function of power electronic converters in PV systems is to capture the maximum power generation from the PV array and feed the power into the grid (Li et al., 2011; Beriber and Talha, 2013). It is imperative to consider the variation of temperature, irradiance, and nonlinear behavior of solar cells when developing high-performance power electronic converters and MPPT algorithms (Fathabadi, 2016; Wan et al., 2019). To test the MPPT algorithms and power electronic converters with the real installed solar panels is challenging because of the constraints surrounding space, high installation costs, and lack of control regarding environmental conditions (Moussa et al., 2019). Under such constraints, the use of PV emulators is the most cost-effective solution to test MPPT algorithms and power electronic converters (Pelin et al., 2014). The use of cost-effective emulators provides a clear incentive for global enterprise and scientific development (Ram et al., 2018). For the ideal PV emulator, there are specific requirements which include a proper emulation of nonlinear I-V and P-V characteristics of a PV panel, which function under varying atmospheric conditions, including temperature and irradiance (Pelin et al., 2014). The emulator must be able to integrate power electronic converter interfaces for testing. It must also be able to function appropriately under frequent load changes and the generation of the characteristic curves of a PV panel under static and dynamic partial shading requirements (Shahabuddin et al., 2018). Contemporary scientific enquiry has found that emulated I-V and P-V curves produce similar results to real PV panel outcomes (in terms of the datasheet) (Azharuddin et al., 2014). However, the advantages and disadvantages have been identified in terms of performance criteria, such as implementation costs, efficiency, accuracy, the level of complexity, sensitivity to variable environmental conditions, and frequent load changes (Shahabuddin et al., 2018). Most of the partial shading behavior is simulated using software simulation. In addition, previous studies on PV emulators have been mostly conducted under static shading conditions that do not cover the sudden irradiance changes (Bulanyi and Zhang, 2014). In addition, the PV array simulator (PVAS) is easy to be applied but very expensive (Kermadi et al., 2018; Kermadi et al., 2020). For outdoor testing, uncertain irradiation and temperature may introduce uncertainty into the experiment and, thus, prevent the expected results from being obtained (Miyatake et al., 2011; Ghasemi et al., 2015). There is a need for a flexible, easy, interactive, hardware-based PV array emulator that can simulate the operation of PV systems under general or partial shading conditions.
The proposed PV emulator consists of two solar panels and two external current sources. The system can be connected either with two PV panels in series or parallel and feeding them with different currents from external current sources to emulate various partial shading conditions of the PV array. Such variations of external currents represent different irradiance levels of partial shading conditions, where the generation of dynamic shading effects can be obtained by rapidly changing the currents from external current sources. It is a very flexible PV source emulation system in laboratory environments. The proposed PV emulator can demonstrate both dynamic and static partial shading conditions easily in laboratory environments.
Due to the changing current voltage (I-V) and power voltage (P-V) electrical characteristics of the solar panels under different conditions (e.g., varying irradiance and temperature), the PV system must operate at the maximum power point voltage to extract the maximum available power. Extracting the maximum power under different environmental conditions and increasing the system efficiency necessitate the use of maximum power point tracking techniques (Ali et al., 2020). Among the methods proposed in the literature, the traditional perturb and observe (P&O) is one of the most popular MPPT algorithms due to their simplicity and practicality (Ahmed and Salam, 2018). However, the principle of the P&O algorithm is to track the MPP by observing the power variation in relation to the voltage variation which suffers from two serious shortcomings. The first is the constant oscillation that occurs around the maximum power point. Second, when the solar panels are operating in partial shading conditions (PSCs), the traditional MPPT algorithm can easily be trapped in local peaks rather than tracking global peaks due to the multipeak nature of the solar panel. Therefore, it can only track the maximum power point under uniform irradiation condition (UIC); otherwise, it will result in power loss. In order to extract the maximum power under PSC, several advanced MPPT algorithms have been proposed, such as fuzzy logic control (FLC), artificial neural network (ANN), particle swarm optimization (PSO), and gray wolf optimization (GWO) (Mohanty et al., 2015; Wei et al., 2016; Ali et al., 2020; Bhattacharyya et al., 2020; Guo and Abdul, 2021). Although these algorithms can continuously track the MPP using the vast computing power of computers, the stochastic nature and complexity of the algorithms result in more time being required to track the maximum power point. In order to improve the tracking performance under partial shading condition and reduce the power loss during tracking, this study presents a simple hybrid global search adaptive P&O MPPT algorithm that can track the global MPP with fast response under PSC. By combining it with the previously mentioned PV emulator, the practicality and reliability of the indoor PV emulated system can be verified in a real system.
This article is organized as follows. Following the Introduction, the indoor PV emulator under UIC and PSC is presented and its measured characteristic data are given as well. The proposed MPPT algorithm is shown in Proposed MPPT Algorithm. In Simulation Results of the Emulation PV System Under Partial Shading Conditions, the simulation results of the PV emulator and MPPT algorithm are shown and analyzed. Finally, the experiment results based on the PV emulator and dSPACE system can be seen in Experimental Verification.
Partial Shading Emulation of the PV Array Using the Proposed PV Source Emulating System
The output voltage of a single solar panel is relatively low, and solar system power generation can be increased by connecting solar panels in series or parallel. However, if solar panels are connected in series under PSC, the shaded panels will generate less power than the normally working solar panels and consume part of the generated power from the solar system. Partial shading not only reduces the power generation of the PV system but also causes hot spots on the shaded solar panels (Mirhassani et al., 2014; Mohandes et al., 2021). To solve these problems, bypass diodes are deployed in the PV system which can be seen in Figure 1.
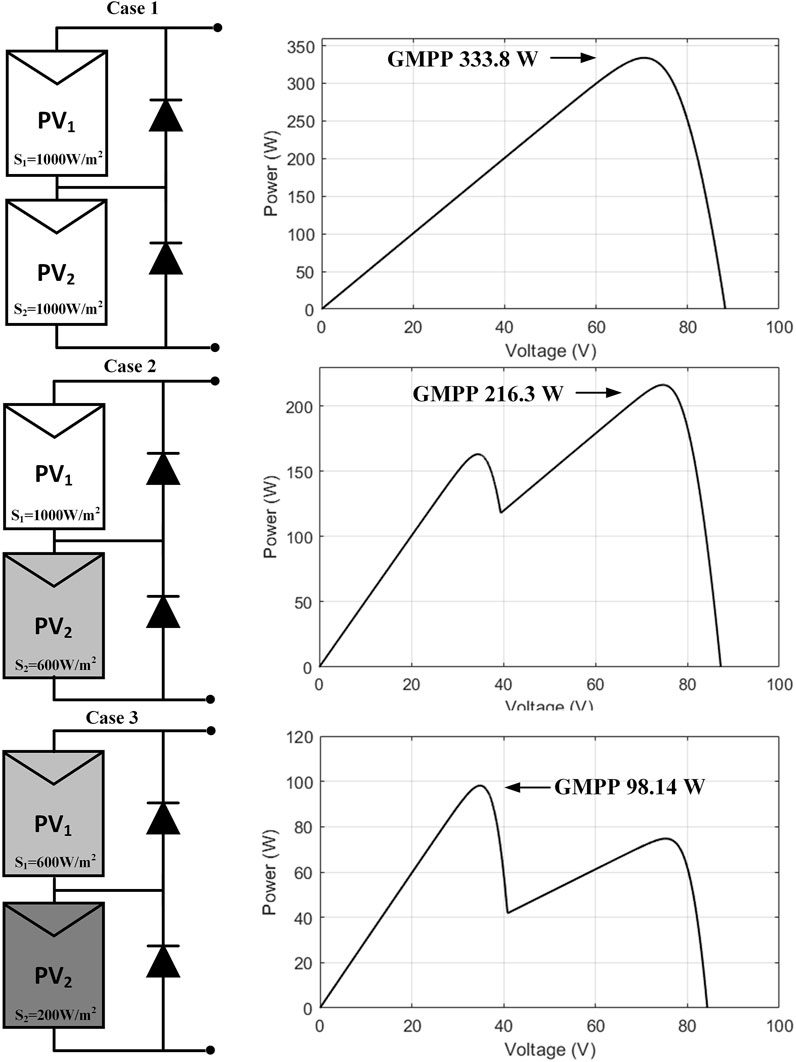
FIGURE 1. Series-connected PV panels with the bypass diode under different irradiation.
Based on further experimental verification and taking three cases with two PV panels in series as an example, when a solar panel is shaded to varying degrees, the position of the global maximum power point (MPP) will also change. When the solar system works under uniform irradiation, the P-V curve has only a single MPP. However, under PSC, bypass diodes will transform the P-V curve into a multipeak shape, which is characterized by multiple local MPPs and a global MPP.
The Operational Principle and Circuit Connection of the Emulated PV System
The operational principle of the proposed PV source emulating system is by connecting an external current source in parallel with a solar panel (Zhou and Macaulay, 2017; Yanarates et al., 2021). The equivalent circuit of the emulated PV source is shown in Figure 2.
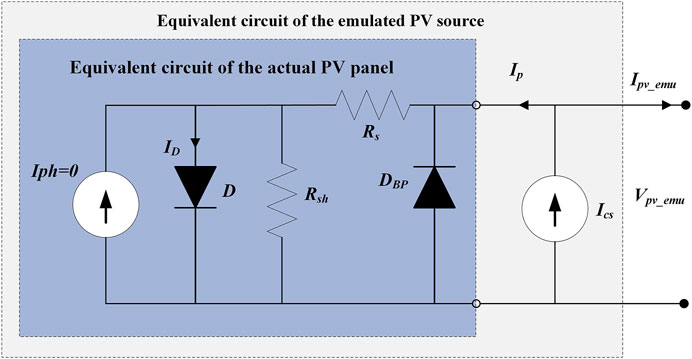
FIGURE 2. Equivalent circuit of the emulated PV source.
Due to the low irradiation in an indoor environment, there is no photocurrent from a solar panel that can be generated. Therefore, an external current source is used and connected in parallel with the solar panel. The photocurrent generated by actual sunlight is represented by the current source current. Variation of the external current source current represents different irradiance levels of solar irradiance received by the solar panel, and it will be easy to emulate the variation of solar irradiance by regulating the current source. DBP in Figure 2 represents the bypass diode integrated with the PV panel. The role of the bypass diode is to avoid hot spots formed when some solar cells in a PV panel or some PV panels in a PV array receive less solar irradiance than others during PSC (Zheng et al., 2014). To simplify the description of the operational principle and characteristics of the emulated PV source, the single-diode model was used to represent the equivalent circuit of the emulated PV source. In indoor conditions, the photocurrent generated by indoor light is assumed to be zero. The electrical characteristics of the emulated PV simulator can be expressed by Eq. 1:
where Ipv_emu and Vpv_emu are the terminal current and voltage of the emulated PV source, respectively; Ics represents the external current source current; Ip represents the current injected into the PV panel; Is represents the dark saturation current; Rs and Rsh are the series and shunt resistances of the solar panel, respectively; n is the diode quality factor; Ns is the number of series-connected PV cells in the PV panel; and Vt is the solar cell thermal voltage defined as Vt = kT/q, where k is Boltzmann’s constant (1.38 × 10⁻²³J/K), q is the elementary charge (1.6 × 10⁻¹⁹ C), and T is p − n junction temperature in Kelvin (Zhou and Macaulay, 2017; Macaulay et al., 2018).
To evaluate the proposed PV source emulation system, a test system was set up as shown in Figure 3, where a SUNTEC 175 W solar panel STP175S-24/Ac was used and connected with an external source (TENMA 72-2940 Programmable Bench Power Supply) in parallel. The parameters of a single PV panel under standard test conditions (STC) (i.e., irradiance 1000W/m2, module temperature 25°C, AM = 1.5) can be seen in Table 1.
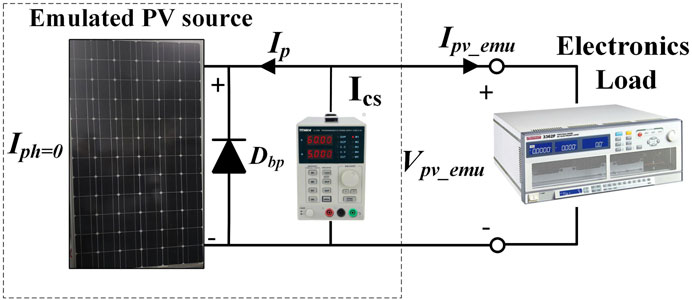
FIGURE 3. Equivalent circuit of the emulated PV source.
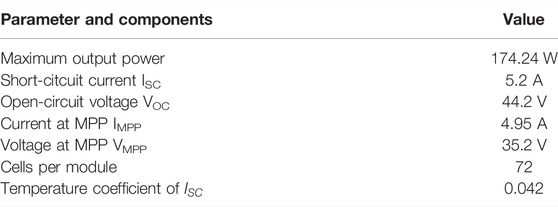
TABLE 1. Parameters of the solar panel STP175S-24/Ac.
Electrical Characteristics of the Proposed PV Source Emulator.
A PRODOGIT 3362F DC load was used for measuring the I-V and P-V characteristics of the emulated PV source. The DC load operated in its constant voltage (CV) mode, and the voltage was swept from 0 to 44.2 V (open-circuit voltage of the solar panel) with a step voltage of 0.5 V. Figure 4 shows the measured I-V and P-V curves of the proposed PV source emulator with three different solar irradiance levels emulated by setting three different external current source current levels and the given characteristic from the datasheet (thick solid line). The three different current levels of the external current source was set as ICS = 1.0 A, ICS = 3.0 A, and ICS = 5.2 A.
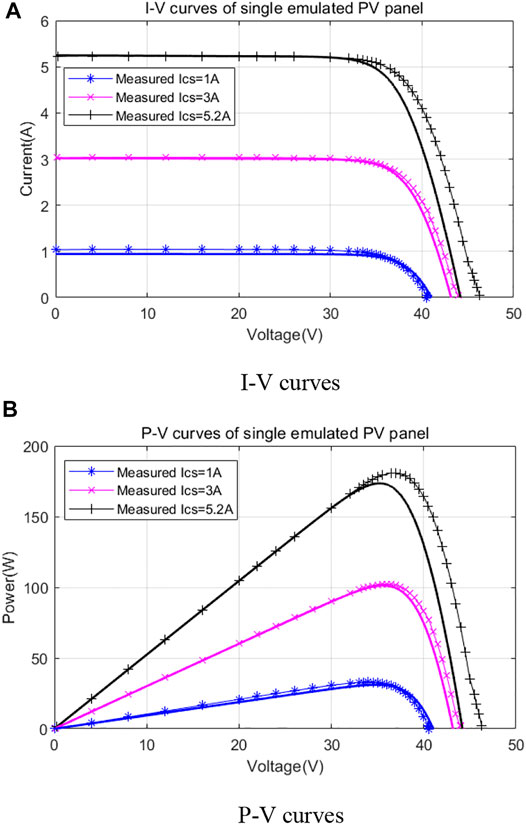
FIGURE 4. Measured electrical characteristics of the constructed PV source based on a single solar panel at different current source currents. (A) I-V curves. (B) P-V curves
Partial Shading Emulation of the PV Array Using the Proposed PV Source Emulator
I-V and P-V characteristic curves mentioned above show that by applying an external current source, the solar panel can be effectively simulated under various irradiation conditions. Therefore, the emulation system can be used for emulating the partial shading performance of various connected PV arrays. When the partial shading occurs, the PV array operates under uniform insulation as a result of partial shading, and the photocurrent of shaded PV cells reduces while the unshaded cells have a higher photocurrent. In this case, the shaded cells will operate in a reverse bias region and consume power due to reverse voltage polarity, resulting in a hot spot and potential cell breakdown. With commercial PV panels, an antiparallel bypass diode is usually connected to the PV panel to limit the reverse voltage and reduce the power loss in the shaded panel (Bidram et al., 2012). This partial shading and the additional bypass diode result in the complicated shape of the P-V curves characterized by multiple peaks, including several local maximum power points (LMPPs) and a global maximum power point (GMPP). These multiple peaks might result in the conventional maximum power point tracking (MPPT) trapped around an LMPP and, therefore, reduce the actual power output significantly (Ishaque and Salam, 2012). Based on the idea presented in the previous section, this section will present a novel PV array emulator that can emulate the partial shading performance of the PV array with both series and parallel connections of PV panels. The laboratory setup is shown in Figure 5.
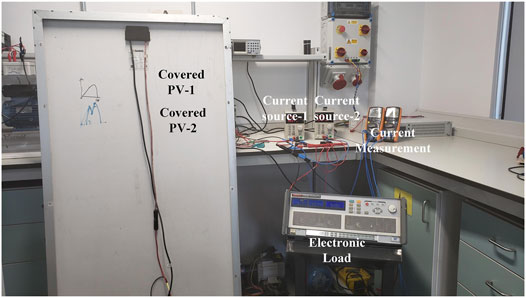
FIGURE 5. Laboratory setup for the proposed emulated PV system. PV emulated system using two series-connected PV panels.
A partial shading emulation system using two series-connected solar panels and two external current sources was proposed and constructed. The equivalent circuit of the partial shading emulation is shown in Figure 6.

FIGURE 6. Equivalent circuit of the proposed emulated PV system.
Two SUNTEC 175 W solar panels (STP175S-24/Ac) were used and connected in series. As the solar panel is located inside the laboratory with very weak solar insulation, there is almost no photocurrent generated from the indoor solar panels, that is, iph ≅ 0. The photocurrents of the two solar panels were emulated by the output of the two TENMA 72-2940 programmable bench current sources. It is assumed that two solar panels are identical with the same leakage current, dark saturation current, and the same external current source current ICS, and the output current and output voltage of the emulated PV system are derived as Eqs 4, 5:
where m = 2 represents the number of solar panels connected in series (Zhou et al., 2014).
Figure 7 shows the measured and datasheet given (thick solid lines) electrical characteristics of the emulated PV array based on two series-connected solar panels with different solar irradiance, and the different solar irradiance level was emulated by setting both the external current source current as 1A/3A/5A (corresponding to the actual I-V and P-V curves under 200 W/m2, 600 W/m2, and 1000 W/m2 solar irradiance).
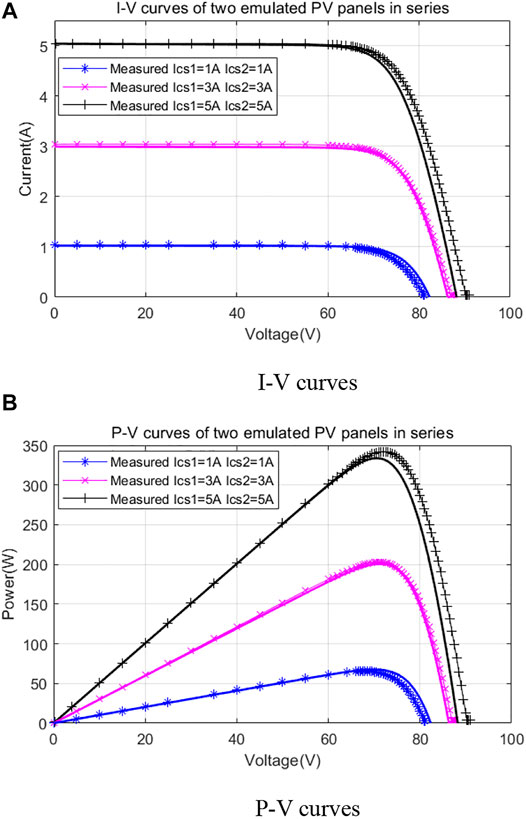
FIGURE 7. Measured and datasheet given electrical characteristics of the emulated PV arrays based on two series-connected solar panels. (A) I-V curves. (B) P-V curves
By varying the current source currents, various solar irradiance received by each solar panel can be emulated. Figure 8 shows the I-V and P-V curves at two current source settings. In the first PSC, the two current source currents were set as ICS1 = 3 A and ICS2 = 1 A. In the second case, the two current source currents were set as ICS1 = 5A and ICS2 = 3A. Since the antiparallel connected bypass diodes integrated with the solar panels provide an alternate current path, the solar panels no longer carry the same current when partial shaded. In this case, there are multiple maximum power points developed in the P-V curve as shown in Figure 8. This emulated P-V curve, therefore, can be used to test advanced MPPT algorithms to find the actual global maximum power point (GMPP) for PSCs.
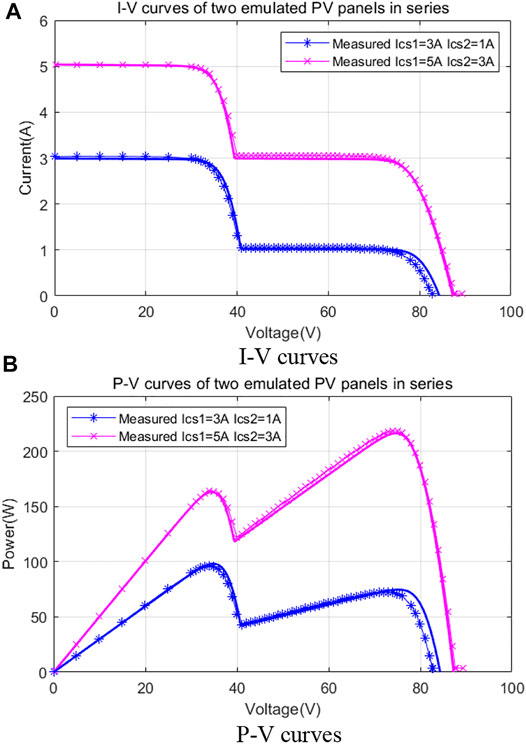
FIGURE 8. Measured and datasheet given electrical characteristics of the emulated PV arrays under two different partial shading operation conditions. (A) I-V curves. (B) P-V curves
The figures above show that two solar panels connected in series work under PSC, and the I-V and P-V curves are different from the PV system operating under general irradiation, with two peaks, which are similar to the given datasheet and simulation results.
PV Emulated System Using Two Parallel-connected PV Panels
Figure 9 shows an equivalent circuit partial shading emulation circuit–based two parallel-connected solar panels and two external current sources.
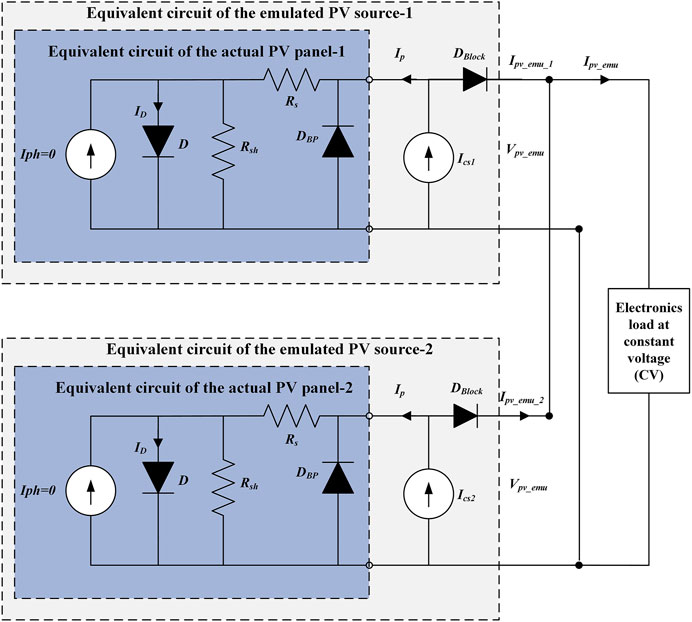
FIGURE 9. Proposed PV array partial shading emulation system with two parallel-connected unilluminated solar panels.
For each emulated PV panel, one blocking diode is connected in series between the external current source and output terminal for blocking the current injected into the PV panel from other current sources when emulating the partial shading operation of the PV array. Assuming that the two unilluminated solar panels are identical with the same leakage current, dark saturation current, and the same external current source current ICS, the output current and output voltage of the PV emulation system were derived as Eqs 6, 7:
where m = 2 represents the number of solar panels connected in parallel (Zhou et al., 2014).
Figure 10 shows the measured and datasheet (thick solid lines) electrical characteristics of the emulated PV array with two parallel-connected unilluminated solar panels at three different emulated solar irradiances. The curve 1 (blue lines), curve 2 (red lines), and curve 3 (black lines) represent the I-V and P-V curves emulated by setting both current source currents Ics1 and Ics2 as 1A/3A/5A, respectively (corresponding to the actual I-V and P-V curves under 200 W/m2, 600 W/m2, and 1000 W/m2 solar irradiance).
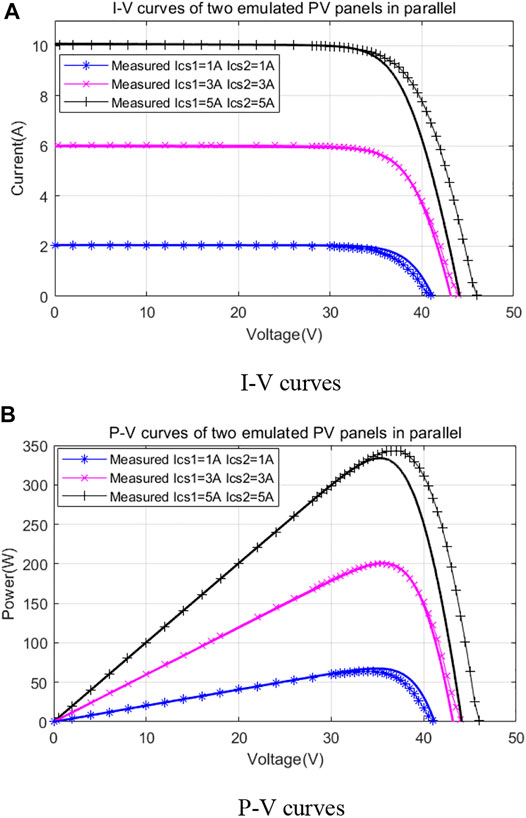
FIGURE 10. Measured and datasheet given electrical characteristics of the emulated PV arrays based on two parallel solar panels. (A) I-V curves. (B) P-V curves
By setting the two current source currents Ics1 and Ics2 differently, various I-V and P-V curves of the PV array with parallel-connected solar panels under PSCs can be emulated. Figure 11 shows electrical characteristics under two different PSCs. The blue curves represent emulated I-V and P-V curves with ICS1 = 3A and ICS2 = 1A, which corresponds to the electrical characteristics of the two PV panels under 600W/m2 and 200 W/m2 solar irradiance, respectively. The red lines represent emulated I-V and P-V curves with ICS1 = 5A and ICS2 = 3A, which corresponds to the electrical characteristics of the two PV panels under 1000 W/m2 and 600 W/m2 solar irradiance, respectively. It is observed with the existence of the blocking diode that there are no multiple peaks in the P-V curves of the PV array. The output current of the PV array emulation system equals the sum of the output current of the two solar panels. It is worth mentioning that it is easy to regulate emulated photocurrent of each panel by simply regulating the current of the current source connected. Therefore, the proposed system can emulate both static and dynamic current easily.
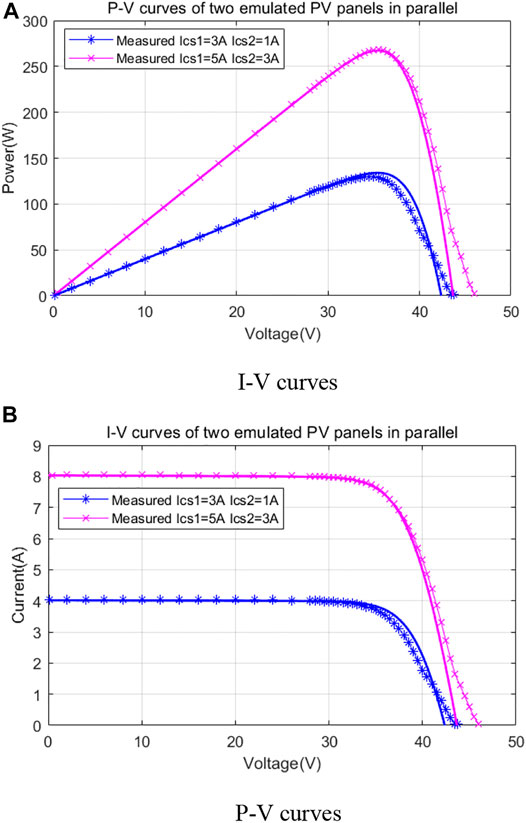
FIGURE 11. Measured and datasheet given electrical characteristics of the emulated PV arrays under two different partial shading operation conditions. (A) I-V curves. (B) P-V curves
Proposed MPPT Algorithm
In the proposed algorithm, the global search method is adopted. The P-V curve of the proposed emulated PV system is scanned toward the search boundary by incrementing Vpv. Some researchers have concluded that the global peak of PV solar panels never exceeds 0.9 Voc (Boztepe et al., 2013; Furtado et al., 2017), where Voc is the open circuit voltage of the PV panels under standard test condition (STC). According to the datasheet of the emulated PV system, the upper search boundary is set as 80 V.
Once the search is complete to obtain the voltage Vmpp for the maximum power, the algorithm continuously checks for sudden changes in power. A noteworthy issue is that sudden changes in irradiation do not necessarily result in a change in the global peak of the P-V curve but in a shift in Vmpp; therefore, an inappropriate choice of the global search restart condition can lead to a loss of power during the search. To avoid power loss due to invalid restart conditions, the proposed algorithm introduces an adaptive perturbation observation method. The adaptive perturbation observation method performs a local optimization after searching for the global MPP. This avoids the problem of power loss due to small changes in irradiation.
As the traditional P&O method is based on fixed-step perturbations, there is a conflict between reducing oscillations in the PV array output power near the maximum power point and tracking speed. Larger perturbation steps ensure faster dynamic response of the algorithm but can lead to excessive oscillation of the PV array output power around the MPP. On the contrary, a small perturbation step reduces the power loss around the MPP but slows the dynamic response to changes in irradiation.
In this study, the proposed adaptive P&O algorithm based on the slope of the P-V curve automatically adjusts the perturbation step during the tracking of the MPP in order to overcome the limitations of the traditional P&O algorithm. The schematic is shown in Figure 12. At a constant irradiance (case 1), when the operating voltage is far from the MPP, the increasing Vpv leads to a continuous increase in the output power of the PV system every cycle. For example, as the operating voltage moves from V1 to V3, the slopes K1 and K2 have similar values. As the operating voltage moves closer to the MPP, the slope of the P-V curve slowly decreases with each perturbation cycle until it equals 0. Thus, the expression K1>K2>K3>K4 is satisfied when the system operating voltage moves from V1 to Vmpp1. Under varying irradiation (case 2 to case 1), the slope of the P-V curve changes. For example, at first, the system searches for the MPP under low irradiation conditions, and as the operating point moves from V6 to Vmpp2, the slope starts to decrease and the perturbation step decreases, at which point K7<K5. If the irradiation suddenly increases after tracking to the maximum power point voltage Vmpp2, the power changes and a new slope is created for the P-V curve. Thus, at case 2, K5>K7, and when case 2 becomes case 1, K7>K5, the perturbation step increases, and the system can track the new MPP faster. The discretized Ipv and Vpv are used as input signals to the algorithm, and the slope of the P-V curve is calculated by comparing the power change to the voltage change. As the operating voltage may be on either side of the MPP, the absolute value of the slope is taken. If the slope of the P-V curve is greater than 1, then a fixed perturbation step of 0.5V is chosen; otherwise, the slope is multiplied by a scaling factor as a perturbation step to reduce system oscillations around the MPP.
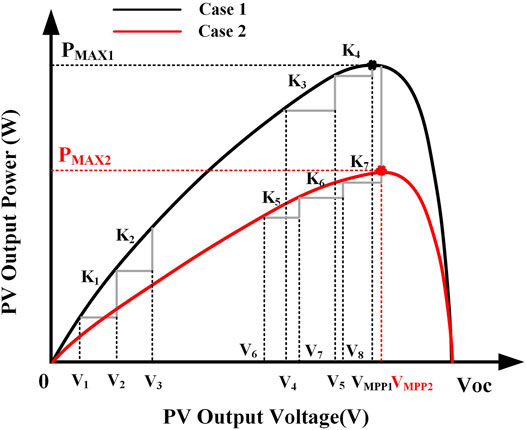
FIGURE 12. Schematic diagram of adaptive perturbation step size.
The flow chart of the proposed hybrid global search adaptive P&O algorithm is shown in Figure 13. The algorithm takes advantage of the global search algorithm’s merit-seeking capabilities and scans the entire search space, so it is unlikely to miss the global MPP. After the GMPP is tracked, the adaptive P&O replaces the global search to begin local optimization. As a result, the P-V curve does not have to be rescanned for small changes in irradiance, which reduces the power loss during the search
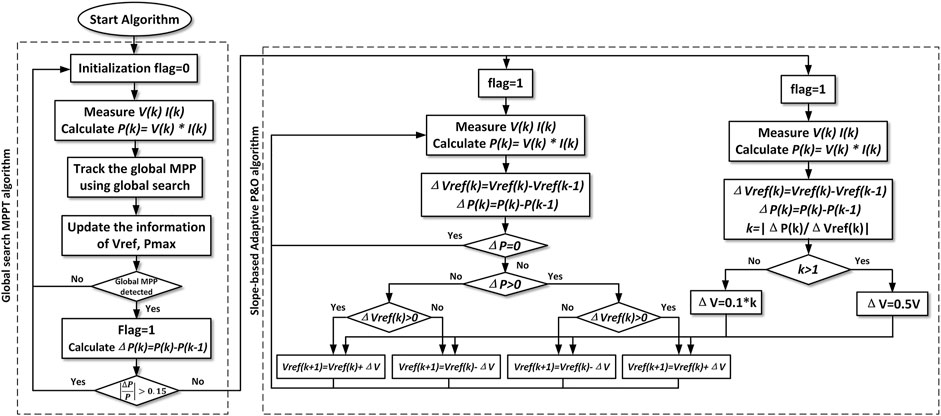
FIGURE 13. Flow chart of the proposed MPPT algorithm.
Simulation Results of the Emulation PV System Under Partial Shading Conditions
A Boost DC–DC Converter
In the simulation and experiment system, the proposed emulated PV system was connected to a boost DC–DC converter. The terminal voltage of the emulated PV panels is regulated by the boost converter with the following specifications shown in Table 2.
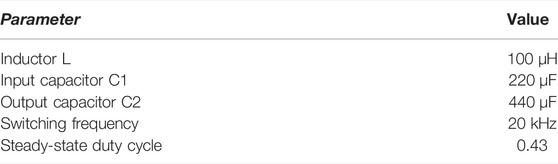
TABLE 2. Boost DC–DC converter parameters.
The transfer function of the boost converter in terms of duty ratio (d(s)) to output voltage, that is, the output voltage (Vout(s)) given in Eq. 8 is derived by using the dynamic (AC small signal) state-space averaging technique.
In the experimental setup, the output voltage is kept constant as the main focus is to validate the performance of the MPPT algorithm by maintaining the terminal voltage of the boost converter at the maximum power point voltage. Therefore, the transfer function of the boost converter is rewritten by multiplying both sides of Eq. 8 with the steady-state input–output voltage relationship
The step response characteristics of the boost converter in terms of open-loop and closed-loop are given in Table 3. Time domain analysis of the system (shown in Figure 14) regarding transient and steady-state characteristics indicates that enhanced performance outcomes are achieved with the PI controller which is designed by considering the stability criteria of the switch mode power supply as follows: the cutoff frequency is less than 1/10 of the switching frequency, phase margin is greater than 45°, gain margin is greater than 10 dB, and the slope of the gain curve at the crossover frequency is approximately 20 dB/decade.
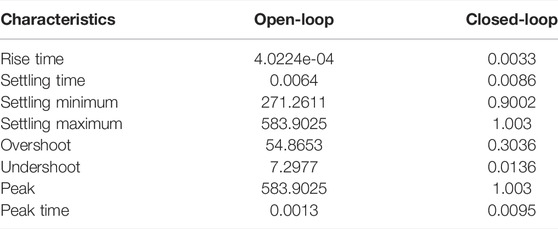
TABLE 3. Time-domain analysis of the boost converter control.
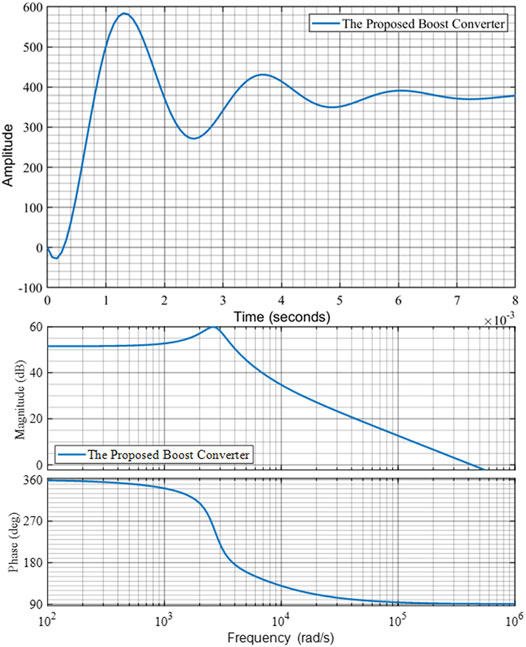
FIGURE 14. Step response of the boost converter.
Open-loop control systems are those in which the output quantity has no effect on the input to the control process, and open-loop systems are just that: open ended nonfeedback systems. Since SMPS output signals have repeated sinusoidal-like behavior by nature, time delays must be taken into account when designing a controller for a dynamical system and analyzing its performance. Signal distorting and nondistorting transit delays are two types of time delays. The signal distorting delay is the difference between phase lag, which delays each frequency by a variable length of time, and non-distorting delay, which delays the entire signal by the same amount of time. Sensors, actuators, controllers, and the process itself are the key components that generate time delays in a feedback system.
Because of exhibiting nonminimum phase (NMP) behavior due to right half plane zero (RHPZ) emerging as the undershoot in step response and nonlinear dynamics, the controller design for DC-to-DC boost converters is more complex and challenging. The phenomenon commonly known as the NMP behavior is the phase lag caused by the transfer of accumulated energy of the inductor when the switch is on to the load during off-time. This attribute is reflected by the existence of an RHPZ in the control to output voltage transfer function. By restricting the closed-loop bandwidth feasible by feedback control, the NMP nature complicates the control effort. The dynamic change in positive zero location induced by varying converter settings, such as load resistance and voltage gain, exacerbate the NMP problem. Moreover, a reduction in the input voltage or load resistance tends to destabilize the closed-loop system by shifting the RHPZ toward origin.
By considering all these issues, step response characteristics of the proposed boost converter show that the open loop response is fast but inefficient for tracking the reference step input due to the internal dynamics of the system. Moreover, system stability can be a significant issue, particularly in poorly designed closed-loop systems as they may attempt to overcorrect any faults, causing the system to lose control and oscillate.
Simulation Results of the Proposed MPPT Algorithm
For the demonstration of the proposed algorithm, two series-connected PV panels are presented in this study. According to the previous measured PV characteristics, the emulated PV system has similar characteristics to the actual I-V and P-V curves at 600W/m2 and 200W/m2, respectively. Figure 15 shows that the PV system is under two different partial shading conditions.
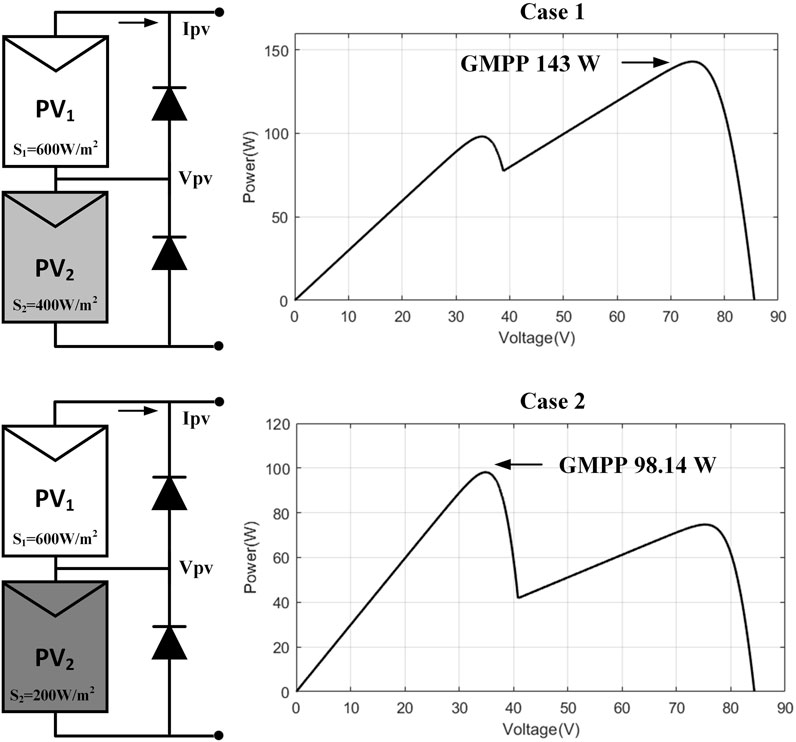
FIGURE 15. Case 1 and case 2 P-V curves from the datasheet. It can be seen above that case 1 has a GMPP of 143W and the GMPP for case 2 is 98.14 W.
A conventional fixed step size (0.5V) P&O MPPT and the proposed adaptive P&O with the global search method were simulated in MATLAB/Simulink. Both solar panels were initially not exposed to irradiation under the initialization conditions. After that, one of the simulated solar panels was exposed to irradiation of 600W/m2, while the other panel irradiation is 400 W/m2. At 0.15s, the irradiation changes from 400W/m2 to 200W/m2, which results in a different GMPP. The sampling time of the P&O algorithm was set as 5 ms corresponding to a perturbation frequency of 200Hz. Supplementary Figure S1 shows the voltage waveforms under different irradiation. The proposed MPPT algorithm crossed the local MPP and eventually tracked the global MPP. The results also indicate that the proposed algorithm has faster dynamic response when the irradiation varies (0.05 and 0.1 s). In addition, the steady-state oscillations around the MPP shown in the zoom-in figures are reduced greatly with the proposed adaptive P&O algorithm.
Supplementary Figure S2 shows the PV output power waveforms. The output power waveforms verify that the proposed adaptive P&O algorithm improves the tracking speed and reduces the oscillation at the MPP. It is worth noting that the adaptive P&O algorithm has better steady-state performance in low irradiation condition.
Other features of the compared MPPT technique are summarized in Table 4 (Ishaque et al., 2012; Macaulay and Zhou, 2018; Wan et al., 2019). It can be seen from Table. 4 that the proposed MPPT algorithm is effective in tracking GMPP and faster in tracking the speed of the MPP with less oscillation. In addition, more than 99% energy can be extracted from the PV system under PSCs.

TABLE 4. Comparison between the proposed MPPT algorithm and other MPPT techniques.
Experimental Verification
The block diagram of the emulated PV system setup under PSC is shown in Supplementary Figure S3. The overall experiment system consists of two emulated solar panels connected in series, DC–DC boost converter, electronic load, and dSPACE real-time interface system (processor board RTI1007, DS2004 A/D board, and CP4002 digital I/O board). The dSPACE system is connected to the computer’s dSPACE Controldesk 5.5 via the LAN network port.
Supplementary Figure S3 shows the test bench of the experiment. Each of the two SUNTECH STP175S-24/Ac solar panels is connected in parallel with the TENMA72-2940 power supply set in a constant current mode. The terminal voltage of the emulated PV panels is regulated by the boost converter.
The proposed MPPT algorithm was achieved using MATLAB/Simulink 2015a and programed into the dSPACE system. The DS2004 A/D board is used to measure the voltage and current from the boost converter measured circuit which is the feedback signals to the MPPT algorithm. The control signal duty cycle D generated by the algorithm is output via the CP4002 digital I/O board. It is worth mentioning that the measured currents and voltages are scaled due to the input voltage limit of the dSPACE analog to digital A/D board channels being between −10V and +10V. Hence, the measured voltage Vpv and current Ipv are scaled down by the circuit and multiplied by 28 and 2.6, respectively, to obtain the actual values.
The experiment results of the emulated PV system under different irradiation with the conventional and proposed MPPT algorithms are shown in Supplementary Figure S5.
The measured values in Supplementary Figure S5 represent transient and steady-state responses in terms of constant current under 2A (400 W/m2)/3A (600 W/m2). The MPP of the emulated PV system under testing irradiation was around 73.8 V which can be seen in Supplementary Figure S4A. Supplementary Figures S4B,C show that the adaptive P&O algorithm has less power oscillation around the voltage 73.8 V at the MPP as it is expected.
Since the partial shading is simulated by manually adjusting the external current source, sudden changes in solar irradiance are hard to be simulated. As a result, it is difficult to observe the transient difference between the conventional and proposed MPPT algorithm. This would be optimized in future experiments. Experimental results are in accordance with the simulation results and show that the proposed emulated PV system was effective for the investigation of PSC. In addition, the proposed MPPT algorithm has better tracking performance and smaller power oscillations around the MPP than the conventional P&O MPPT algorithm.
Conclusion
This study has presented an innovative PV emulator and a state-of-the-art learning-based real-time hybrid global search adaptive perturb and observe (P&O) maximum power point tracking (MPPT) technique. The main goal of the constructed emulator is to overcome obstacles such as the necessity for a large area, significant installation costs, and lack of control over environmental conditions by merging unilluminated solar panels with an external current supply. The developed learning-based real-time hybrid global search adaptive P&O MPPT algorithm has overcome the shortcomings of conventional P&O MPPT methods, such as poor transient response, high continuous steady-state oscillation, and inefficient tracking performance of maximum power point voltage in the presence of partial shading, caused by the use of a constant perturbation size. Simulation results show that the proposed MPPT algorithm provides a fast response for tracking the MPP under PSCs with more than 99% energy extracting efficiency with reduced steady-state oscillation around the MPP. The overall system provides a feasible condition for the future development of an advanced MPPT algorithm under PSCs. Moreover, verification and validation of the proposed control scheme have been carried out with the implementation of MATLAB/Simulink/Stateflow on the dSPACE real-time-interface (RTI) 1007 processor board and DS2004 A/D and CP4002 Digital I/O boards.
Data Availability Statement
The original contributions presented in the study are included in the article/Supplementary Material, further inquiries can be directed to the corresponding author.
Author Contributions
Author Contributions: conceptualization, YW and ZZ; methodology, YW and ZZ; software, YW; validation, YW, CY, and ZZ; formal analysis, YW and CY; data curation, YW; writing—original draft preparation, YW., CY, and ZZ; writing—review and editing, YW, CY, and ZZ; supervision, ZZ
Funding
This work was supported in part by the European Regional Development Fund (ERDF) funding this research through the FLEXIS project.
Conflict of Interest
The authors declare that the research was conducted in the absence of any commercial or financial relationships that could be construed as a potential conflict of interest.
Publisher’s Note
All claims expressed in this article are solely those of the authors and do not necessarily represent those of their affiliated organizations, or those of the publisher, the editors, and the reviewers. Any product that may be evaluated in this article, or claim that may be made by its manufacturer, is not guaranteed or endorsed by the publisher.
Supplementary Material
The Supplementary Material for this article can be found online at: https://www.frontiersin.org/articles/10.3389/fenrg.2022.868951/full#supplementary-material
Supplementary Figure 1 | Voltage comparison of the conventional P&O MPPT and the proposed adaptive variable step size P&O MPPT.
Supplementary Figure 2 | Power comparison of the conventional P&O MPPT and the proposed adaptive variable step size P&O MPPT.
Supplementary Figure 3 | Block diagram of the emulated PV system setup.
Supplementary Figure 4 | Block diagram of the emulated PV system setup.
Supplementary Figure 5 | Conventional and proposed MPPT PV voltage and current measured results for partial shading under 400W/m2 and 600W/m2 irradiation, (A) transient response, (B) steady-state with conventional P&O, and (C) steady-state with adaptive P&O
Abbreviations
I-V, current and voltage; P-V, power and voltage, P&O, perturb and observe; MPPT, maximum power point tracking; UIC, uniform irradiation condition; PSC, partial shading condition; MPP, maximum power point; GMPP, global maximum power point; LMPPs, local maximum power points; GMPP, global maximum power point.
References
Ahmed, J., and Salam, Z. (2018). An Enhanced Adaptive P&O MPPT for Fast and Efficient Tracking under Varying Environmental Conditions. IEEE Trans. Sustain. Energ. 9, 1487–1496. doi:10.1109/tste.2018.2791968
Ali, A., Almutairi, K., Padmanaban, S., Tirth, V., Algarni, S., Irshad, K., et al. (2020). Investigation of MPPT Techniques under Uniform and Non-uniform Solar Irradiation Condition-A Retrospection. IEEE Access 8, 127368–127392. doi:10.1109/access.2020.3007710
Andújar, J., Segura, F., and DOMíNGUEZ, T. (2016). “Study of a Renewable Energy Sources-Based Smart Grid. Requirements, Targets and Solutions,” in 3rd Conference on Power Engineering and Renewable Energy (ICPERE), Yogyakarta, Indonesia, 29-30 Nov. 2016 (IEEE), 45–50. doi:10.1109/ICPERE.2016.7904849
Azharuddin, S. M., Vysakh, M., Thakur, H. V., Nishant, B., Babu, T. S., Muralidhar, K., et al. (2014). A Near Accurate Solar PV Emulator Using dSPACE Controller for Real-Time Control. Energ. Proced. 61, 2640–2648. doi:10.1016/j.egypro.2014.12.266
Beriber, D., and Talha, A. (2013). “MPPT Techniques for PV Systems. 4th International Conference on Power Engineering, Energy and Electrical Drives,” in 4th International Conference on Power Engineering, Energy and Electrical Drives, Istanbul, Turkey, 13-17 May 2013 (IEEE), 1437–1442. doi:10.1109/PowerEng.2013.6635826
Bhattacharyya, S., SamantA, S., and Mishra, S. (2020). Steady Output and Fast Tracking MPPT (SOFT-MPPT) for P&O and InC Algorithms. IEEE Trans. Sust. Energ. 12, 293–302. doi:10.1109/TSTE.2020.2991768
Bidram, A., Davoudi, A., and Balog, R. S. (2012). Control and Circuit Techniques to Mitigate Partial Shading Effects in Photovoltaic Arrays. IEEE J. Photovoltaics 2, 532–546. doi:10.1109/jphotov.2012.2202879
Boztepe, M., Guinjoan, F., Velasco-Quesada, G., Silvestre, S., Chouder, A., and Karatepe, E. (2013). Global MPPT Scheme for Photovoltaic String Inverters Based on Restricted Voltage Window Search Algorithm. IEEE Trans. Ind. Elect. 61, 3302–3312. doi:10.1109/TIE.2013.2281163
Bulanyi, P., and Zhang, R. (2014). “Shading Analysis & Improvement for Distributed Residential Grid-Connected Photovoltaics Systems,” in The 52nd Annual Conference of the Australian (Solar Council).
Edenhofer, O., Pichs-Madruga, R., Sokona, Y., Seyboth, K., Kadner, S., Zwickel, T., et al. (2011). Renewable Energy Sources and Climate Change Mitigation: Special Report of the Intergovernmental Panel on Climate Change. Cambridge University Press.
Fathabadi, H. (2016). Novel Fast Dynamic MPPT (Maximum Power point Tracking) Technique with the Capability of Very High Accurate Power Tracking. Energy 94, 466–475. doi:10.1016/j.energy.2015.10.133
Furtado, A. M., Bradaschia, F., Cavalcanti, M. C., and Limongi, L. R. (2017). A Reduced Voltage Range Global Maximum Power point Tracking Algorithm for Photovoltaic Systems under Partial Shading Conditions. IEEE Trans. Ind. Elect. 65, 3252–3262. doi:10.1109/TIE.2017.2750623
Ghasemi, M. A., Foroushani, H. M., and Parniani, M. (2015). Partial Shading Detection and Smooth Maximum Power point Tracking of PV Arrays under PSC. IEEE Trans. Power Elect. 31, 6281–6292. doi:10.1109/TPEL.2015.2504515
Guo, L., and Abdul, N. M. (2021). Design and Evaluation of Fuzzy Adaptive Particle Swarm Optimization Based Maximum Power Point Tracking on Photovoltaic System under Partial Shading Conditions. Front. Energ. Res. 9. 712175. doi:10.3389/fenrg.2021.712175
Ishaque, K., and Salam, Z. (2012). A Deterministic Particle Swarm Optimization Maximum Power point Tracker for Photovoltaic System under Partial Shading Condition. IEEE Trans. Ind. Electron. 60, 3195–3206. doi:10.1109/tie.2012.2200223
Ishaque, K., Salam, Z., Amjad, M., and Mekhilef, S. (2012). An Improved Particle Swarm Optimization (PSO)-Based MPPT for PV with Reduced Steady-State Oscillation. IEEE Trans. Power Electron. 27, 3627–3638. doi:10.1109/tpel.2012.2185713
Kermadi, M., Salam, Z., Ahmed, J., and Berkouk, E. M. (2020). A High-Performance Global Maximum Power point Tracker of PV System for Rapidly Changing Partial Shading Conditions. IEEE Trans. Ind. Elect. 68, 2236–2245. doi:10.1109/TIE.2020.2972456
Kermadi, M., Salam, Z., Ahmed, J., and Berkouk, E. M. (2018). An Effective Hybrid Maximum Power point Tracker of Photovoltaic Arrays for Complex Partial Shading Conditions. IEEE Trans. Ind. Elect. 66, 6990–7000. doi:10.1109/TIE.2018.2877202
Li, X., Li, Y., Seem, J. E., and Lei, P. (2011). Maximum Power point Tracking for Photovoltaic Systems Using Adaptive Extremum Seeking Control. Dynamic Syst. Control. Conf. 54754, 803–810. doi:10.1109/cdc.2011.6161436
Macaulay, J., Lin, C. W., and Zhou, Z. (2018). “An Emulated PV Source Based on an Indoor Solar Panel with External Excitement Current and Voltage Compensation,” in International Symposium on Power Electronics, Electrical Drives, Automation and Motion (SPEEDAM), Amalfi, Italy, 20-22 June 2018 (IEEE), 859–864. doi:10.1109/speedam.2018.8445307
Macaulay, J., and Zhou, Z. (2018). A Fuzzy Logical-Based Variable Step Size P&O MPPT Algorithm for Photovoltaic System. Energies 11, 1340. doi:10.3390/en11061340
Mirhassani, S. M., Razzazan, M., and Ramezani, A. (2014). “An Improved PSO Based MPPT Approach to Cope with Partially Shaded Condition,” in 22nd Iranian conference on electrical engineering (ICEE), Tehran, Iran, 20-22 May 2014 (IEEE), 550–555. doi:10.1109/IranianCEE.2014.6999604
Miyatake, M., Veerachary, M., Toriumi, F., Fujii, N., and Ko, H. (2011). Maximum Power point Tracking of Multiple Photovoltaic Arrays: A PSO Approach. IEEE Trans. Aerosp. Electron. Syst. 47, 367–380. doi:10.1109/taes.2011.5705681
Mohandes, B., Wahbah, M., Moursi, M. S. E., and El-Fouly, T. H. M. (2021). Renewable Energy Management System: Optimum Design and Hourly Dispatch. IEEE Trans. Sustain. Energ. 12, 1615–1628. doi:10.1109/tste.2021.3058252
Mohanty, S., Subudhi, B., and Ray, P. K. (2015). A New MPPT Design Using Grey Wolf Optimization Technique for Photovoltaic System under Partial Shading Conditions. IEEE Trans. Sust. Energ. 7, 181–188. doi:10.1109/TSTE.2015.2482120
Moussa, I., Khedher, A., and Bouallegue, A. (2019). Design of a Low-Cost PV Emulator Applied for PVECS. Electronics 8, 232. doi:10.3390/electronics8020232
Pelin, D., Jukić Antolović, J., and Rapčan, V. (2014). PV Emulator. Int. J. Electr. Comput. Eng. Syst. 5 (1), 21–26.
Ram, J. P., Manghani, H., Pillai, D. S., Babu, T. S., Miyatake, M., and Rajasekar, N. (2018). Analysis on Solar PV Emulators: A Review. Renew. Sust. Energ. Rev. 81, 149–160. doi:10.1016/j.rser.2017.07.039
Shahabuddin, M., Riyaz, A., Asim, M., Shadab, M. M., Sarwar, A., and Anees, A. (2018). “Performance Based Analysis of Solar PV Emulators: a Review,” in International Conference on Computational and Characterization Techniques in Engineering & Sciences (CCTES), Lucknow, India, 14-15 Sept. 2018 (IEEE), 94–99. doi:10.1109/cctes.2018.8674082
Wan, Y., Mao, M., Zhou, L., Zhang, Q., XI, X., and Zheng, C. (2019). A Novel Nature-Inspired Maximum Power point Tracking (MPPT) Controller Based on SSA-GWO Algorithm for Partially Shaded Photovoltaic Systems. Electronics 8, 680. doi:10.3390/electronics8060680
Wei, C., Zhang, Z., Qiao, W., and Qu, L. (2016). An Adaptive Network-Based Reinforcement Learning Method for MPPT Control of PMSG Wind Energy Conversion Systems. IEEE Trans. Power Electron. 31, 7837–7848. doi:10.1109/tpel.2016.2514370
Yanarates, C., Wang, Y., and Zhou, Z. (2021). Unity Proportional Gain Resonant and Gain Scheduled Proportional (PR-P) Controller-Based Variable Perturbation Size Real-Time Adaptive Perturb and Observe (P&O) MPPT Algorithm for PV Systems. IEEE Access 9, 138468–138482. doi:10.1109/access.2021.3119042
Yanarates, C., and Zhou, Z. (2022). Fast‐converging Robust PR‐P Controller Designed by Using Symmetrical Pole Placement Method for Current Control of Interleaved Buck Converter‐based PV Emulator. Energ. Sci. Eng. 10, 155–176. doi:10.1002/ese3.1018
Zheng, H., Li, S., Challoo, R., and Proano, J. (2014). Shading and Bypass Diode Impacts to Energy Extraction of PV Arrays under Different Converter Configurations. Renew. Energ. 68, 58–66. doi:10.1016/j.renene.2014.01.025
Zhou, Z., Holland, P. M., and Igic, P. (2014). MPPT Algorithm Test on a Photovoltaic Emulating System Constructed by a DC Power Supply and an Indoor Solar Panel. Energ. Convers. Manag. 85, 460–469. doi:10.1016/j.enconman.2014.06.007
Keywords: PV emulator, solar panel, partial shading, MPPT, dSPACE, boost converter, global maximum power point
Citation: Wang Y, Yanarates C and Zhou Z (2022) External Current Source–Based Unilluminated PV Partial Shading Emulation System Verified Through the Hybrid Global Search Adaptive Perturb and Observe MPPT Algorithm. Front. Energy Res. 10:868951. doi: 10.3389/fenrg.2022.868951
Received: 03 February 2022; Accepted: 28 February 2022;
Published: 01 April 2022.
Edited by:
K. Sudhakar, Universiti Malaysia Pahang, MalaysiaReviewed by:
Akash Kumar Shukla, Ujjain Engineering College, IndiaMohamed Salem, Universiti Sains Malaysia (USM), Malaysia
Copyright © 2022 Wang, Yanarates and Zhou. This is an open-access article distributed under the terms of the Creative Commons Attribution License (CC BY). The use, distribution or reproduction in other forums is permitted, provided the original author(s) and the copyright owner(s) are credited and that the original publication in this journal is cited, in accordance with accepted academic practice. No use, distribution or reproduction is permitted which does not comply with these terms.
*Correspondence: Yidong Wang, OTM3NjA3QHN3YW5zZWEuYWMudWs=