
94% of researchers rate our articles as excellent or good
Learn more about the work of our research integrity team to safeguard the quality of each article we publish.
Find out more
ORIGINAL RESEARCH article
Front. Energy Res., 08 August 2022
Sec. Smart Grids
Volume 10 - 2022 | https://doi.org/10.3389/fenrg.2022.865060
This article is part of the Research TopicAdvanced Digital Technologies in Digitalized Smart GridView all 13 articles
 Chang Liu1
 Wei Wang1Zhixun Wang2Shangfa Chen1Peifang Su1Hongyuan Gao1Chao Xu1Biyuan Ge3Hongfa Ding4Liang Liu5*
In order to cope with global climate change, an electric vehicle (EV) and new energy building are constantly being innovated and improved. With the popularity and application of big data and Internet of Things, the new energy building with available charging piles may also become a charging station, which can solve the problem of difficult charging of EVs and promote the local energy consumption of the building. Therefore, this study proposes a shared charging concept for buildings, that is, shared photovoltaic, charging, and energy storage building (sPCEB). First, based on the analysis results of big data in cities or settlements of people, a locating method of the sPCEB system is introduced, and further proposes an optimal operating strategy that maximizes the combined benefit of the building. The efficiency and effectiveness of the proposed methods are verified by simulation.
On 12 December 2015, nearly 200 parties of the United Nations Framework Convention on Climate Change reached the Paris Agreement at the 21st United Nations Climate Change Conference. This is the second legally binding climate agreement after the Kyoto Protocol, setting out arrangements for global action to address climate change after 2020. According to the US Environmental Protection Agency, buildings are one of several major sources of global greenhouse gas emissions.
In 2020, China proposed a major strategy to achieve “peak carbon dioxide emissions” by 2030 and “carbon neutrality” by 2060, and the key to carbon reduction lies in replacing the massive use of non-renewable fossil fuels with electrification of production and living. Actually, buildings should also move from being energy consumers to being contributors that support large-scale clean energy access, and integrating energy use, capacity, and storage into one (Feng et al., 2019; Huanan and Quande, 2019; Heinstein et al., 2013). Therefore, the concept of a new energy building is created, which is realized through the following ways: first, the way of building electricity consumption is changed to “supply-oriented, demand responsive”, that is, the electrical device flexibly adjusts the use time according to the actual photovoltaic (PV) power generation status and consumes the power in time when the power capacity is sufficient or suspends/reduces the power consumption; second, the internal storage system is developed to cover the shortage of electricity dynamically; third, the storage and consumption capacity of the electric vehicle is dynamically used to flexibly meet the building power demand (Igor et al., 2012; Kapsalaki et al., 2012).
At present, the percentage of electric vehicles (EVs) in the global automotive market is further expanding, but the charging problem becomes an obstacle to increasing the penetration of EV. With the popularization and application of big data and Internet of Things, the new energy building system may also become a charging station, which is an effective way to solve the charging problem. Therefore, this study proposes a concept of shared photovoltaic, charging, and energy storage building (sPCEB), that is, the sPCEB system uses the analysis results of big data to provide short-term charging services for public EV users by the surplus PV power or storage energy on the basis of satisfying its own electricity consumption.
In order to successfully implement the shared charging service in a building system, it is necessary to solve the location problem of the sPCEB system at first. A proper location can provide favorable prerequisites for the effective operation of the sPCEB system. Then, the optimal operation of the shared charging strategy should be further combined with the energy use of the sPCEB system itself. Therefore, this article first proposes a sPCEB system locating method based on an improved analytic hierarchy process (AHP), on the basis of determining the location, an optimal operation of the sPCEB system is further proposed, which can maximize the combined benefits of society, environment, the building, and the EV users.
Figures 1 shows the schematic diagram of sPCEB system operation. The main connection line is the power busbar, the PV modules, energy storage system, and loads in the building are connected together in the building microgrid, and the communication between the modules is connected by applying the communication busbar. The energy generated from the PV module is first consumed in the building itself, and then the sPCEB system is connected to the external power grid based on signals from the flexible control system. Unlike ordinary buildings, the sPCEB system needs to selectively provide charging services to public EV users at specific time on the basis of its current power supply and consumption. The public EV users are required to pay for the charging service according to payment rules, which is also one of the revenue sources of the sPCEB system.
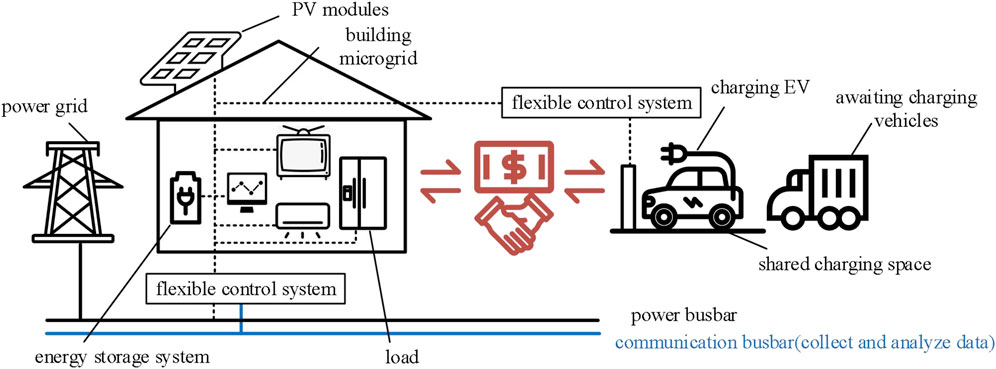
FIGURE 1. Schematic diagram and operation of an sPCEB system.
As mentioned earlier, the sPCEB system has two functions: providing daily energy for the building and providing shared EV charging service. Therefore, it is not only necessary to select the location of the building according to the general planning of the region but also to establish a locating model based on the spatial distribution of the EV users’ charging demand in the region. The locating method in this article requires a thorough consideration of multiple aspects from the perspective of both the EV charging station and the building.
On the one hand, the traffic flow reflects the development, on the other hand, the charging demand becomes higher when the EV penetration rate is higher (Bheema and June, 2017; Michael et al., 2021; Sayali et al., 2021). The traffic data in the analyzed region should be collected, and some typical days are selected as the samples. The data mainly include the traffic flow of EVs and traditional petrol vehicles, represented as M and N, respectively. The index of traffic flow is defined as:
where ω1 and ω2 are the weights of M and N, respectively.
The concept of accessibility was first introduced by Hansen, an American scholar (Hansen, 1959). It indicates the opportunities for the transportation network to interact with each other and is mainly used in the study of urban land use (Muhammad et al., 2018; Albacete et al., 2017). It is necessary to consider how convenient it is for public EV users to reach the sPCEB system once charging is complete.
The distance y for public transport accessibility is defined as shown in Eq. 2. d is the straight-line distance (Euclidean distance) from the location to the nearest traffic node and D is the average walking distance based on the type of traffic node. The average walking distance to the bus station is defined as 150 m and the average walking distance to the subway station is 450 m (Olszewski and Wibowo, 2005). Different weights ω are given to bus stations and subway stations respectively, and the maximum value of each public transport accessibility is multiplied by the corresponding weight as the final value, as shown in Eq. 3.
Population density distribution reflects the dynamics of economic activity and is therefore an important determinant in sPCEB system’s location selection. Larger population density represents larger passenger flow and better advertising effect. The population density γ is calculated as:
where p is the number of people in the analyzed region and q is the area of the region, usually expressed in square kilometers.
The types of building are classified as residential buildings, public buildings, industrial buildings, and agricultural buildings. The industrial and agricultural buildings are generally far away from the busy area, and the demand for EV charging is comparably low, so the main building types are residential buildings and public buildings in this article. The indexes of locating residential buildings include traffic flow, public transport accessibility, regional population density, green space accessibility, and housing price. For locating public buildings, green space accessibility is not a key factor, but the building attractiveness needs to be considered.
Green space has become an important place for urban residents to interact and organize various activities; it plays an irreplaceable role during the development of the human living environment. The green coverage has become an important factor for discussing the ecological livability of a region, and the green space accessibility is also an important element in the locating method (Schirmer et al., 2014). Green space accessibility needs to consider the distance from the location to the green space and the area of the green space; therefore, the green space accessibility index Pi is defined as:
The distance from the location to the nearest green space is fi, and the area of the nearest green space from the location is gi. PPi is the normalized value of the distance to the nearest green space, and PAi is the normalized value of the area of the green space.
High economic growth is often closely related to the increase in housing price; housing price also reflects the degree of economic development of the analyzed region. Housing price can be obtained by collecting published data using web crawler.
The Huff model is one of the most commonly used models in building locating; it explains the attractiveness of public buildings to users and various resistance factors for users to make decisions (Huff, 1964). Based on the Huff model, the attractiveness of building j to point i is defined as:
where Uij is the attractiveness to users, Sj is the area of building j, and dij is the traffic cost parameter that reflects the users go from the activity point i to the building j. α and λ are sensitive parameters for Sj and dij, respectively. The value of α is 0.82 and the value of λ is -1.16 (Yandong et al., 2018).
In the engineering project, the construction and installation cost of public buildings mainly includes the installation works, outdoor, and supporting works. The main building installation work mainly includes civil engineering, water supply and drainage engineering, and electric engineering. The overall construction cost is calculated based on the construction area and is proportional to the area. Therefore, in the locating of public buildings, this article uses the floor area of public buildings to express the construction cost.
Based on the process of the aforementioned data, each sPCEB system corresponds to multiple indexes. How to deal with these indexes requires further analysis and judgment. AHP is a hierarchical analysis method that combines qualitative and quantitative approaches (Muhammad 2014). The basic steps of AHP are divided into four main steps: first, the recursive hierarchy model is established; second, the judgment matrix is constructed; third, consistency test; and at last, all the options are compared and decisions are made.
In fact, the most important step of AHP is the construction of the judgment matrix; however, the traditional method has some inherent drawbacks. If there are too many elements, the statistics are large, the judgment matrix is hard to pass the consistency test, and repeatedly modifying the judgment matrix may be contrary to the original intention of the decision. Therefore, this section proposes some improvements for the traditional AHP.
If there are n different elements in criteria, n (n-1)/2 comparisons are required to judge the order of importance of multiple elements by using the traditional AHP. The steps of comparison will be very tedious if there are too many elements. In addition, it may also cause illogical results.
A method for constructing the judgment matrix of the criterion level based on the importance ranking is proposed. Three importance indicators of adjacent elements are defined as: strong importance, moderate importance, and equal importance. Importance indicators of non-adjacent elements can be obtained by superimposing the importance of adjacent elements. The scales of importance indicators of adjacent elements are defined as 3, 2, and 1, respectively. The improved scales are shown in Table 1.
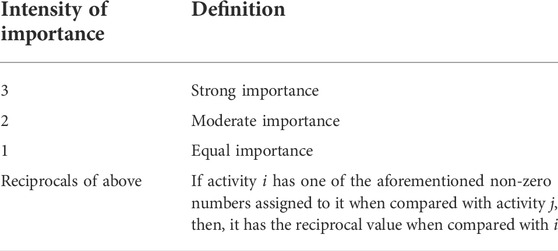
TABLE 1. Improved scales in criteria.
Each alternative has specific values, the order of importance should be judged objectively based on the specific values. Therefore, the construction method of the judgment matrix of the alternatives based on quantitative data is further proposed. First, the data need to be normalized to range 1–10, and the scales of alternatives δ are defined as the differences between two elements. According to the definition of the scales of alternatives in Table 2, the judgment matrix in alternatives can be constructed.

TABLE 2. Improved scales in alternatives.
According to the aforementioned improvements, the optimal location can be directly selected by applying the AHP with simply giving an order of importance to the elements in alternatives and criteria.
After determining the location of the building, a strategy for optimizing the operation of the sPCEB system with shared charging services is further proposed. The optimization objective is to maximize the combined benefits created by the building, and the main constraint is that the building’s annual purchase of non-renewable energy from the power grid cannot be greater than the amount of the electricity sold to the power grid in the context of market-based electricity trading. Based on the floor area of the building, the area where PV modules can be installed, and the different photoelectric conversion efficiencies of the roof/wall, the required PV capacity, energy storage device capacity, charging and discharging power of energy storage system, and the purchased and sold electricity to the power grid are solved. It belongs to the field of mixed-integer linear programming (MILP), thus an optimization model is needed (Danhong et al., 2021; Qiwei et al., 2021).
As a low-carbon and energy-efficient building system, the optimization objective of the sPCEB system is defined as the maximization of the combined benefits that the building brings to the overall society, that is, the difference between the incremental benefit S and the incremental cost C.
Incremental benefits include three elements: incremental economic benefits Sec, incremental environmental benefits Sen, and incremental social benefits Sso. Incremental economic benefits Sec are defined as economic benefits Sec1 obtained by owners from the sPCEB system and economic benefits Sec2 gained by shared charging services.
where Qpv is the annual power generation capacity of the building through its PV modules. Ppv is the power generated by the PV modules, λ1 and λ2 are the power generation coefficients of the top surface and sunny side of the building, respectively, Gst is the reference value of solar irradiance, and H is the actual value. Ipur is the saved electricity cost, s1 is the area of PV modules installed on the top surface, and s2 is the area of PV modules installed on the sunny side. n is the number of hours in a year. Qshare is the amount of charging power provided to public EV users, and Ishare is the revenue from charging.
The incremental cost mainly include the device cost Cpv, Cstore, the electricity cost/revenue Cgrid, and the operation and maintenance cost Cop.
where Cpv is the total cost of PV modules, and Ipv is the cost of PV modules per square meter. Cstore is the cost of energy storage system. CAstore is the capacity of the energy storage, and Istore is the unit cost. Pbuy is the electricity purchased from the grid, Psell is the electricity sold to the grid, and Cbuy and Csell are the purchase and sale prices of electricity, respectively. a and b are the operation and maintenance costs per unit of the PV module and energy storage system.
Considering that the scenario of this article is the energy storage system for buildings, the current form of energy storage applied in buildings is still mainly battery energy storage, such as lithium battery energy storage. At present, the charging/discharging power of household energy storage is about 5–20 kW (Sonnen Home Energy Storage, 2022; Tesla Powerwall, 2022). The state of charge SOCt of the energy storage system at moment t is determined by the state of charge at the previous moment SOCt-1 and the charge/discharge power. It is also controlled by the upper and lower limits of its own maximum charge/discharge power, as shown in formula Eqs 17–19.
where Δt is the time interval,
Public EV users need to pay charging service fees Mcharge for charging at public charging facilities. The sPCEB system can settle specific charging service fees within the upper limit Mcharge,max:
The area constraint of PV modules Spv is determined according to the building and location; Spv,max is the maximum area of PV modules that can be installed in the building:
The time-of-use tariff policy is different for each area. Taking a province in the middle and lower reaches of the Yangtze River as an example, the tariff policy is shown as:
where Cbuy represents the electricity tariff. Pb represents the price of the electricity in ordinary hours (7:00∼9:00 a.m., 15:00 ∼ 20:00 p.m., and 22:00–23:00 p.m.).In China, the price of Csell ranges from 0.35 to∼ 0.5 yuan/kWh. Because the electricity price varies from different region or area, the aforementioned time-of-use tariff model is used in this article as a reference, it can be adjusted according to the actual situation in practical application.
The power balance equation at moment t of the busbar:
where P(t)discharge and P(t)charge are the charging and discharging power of energy storage system, respectively. P(t)load and P(t)EV are the building load and EV’s charging power, respectively.
The sPCEB system has two sources of electricity, that is, the power generated by its PV modules or purchases electricity from the power grid. In order to achieve high clean energy penetration in sPCEB systems, the concept of nearly zero energy in this article is defined as the sPCEB system’s annual purchase of non-renewable energy from the power grid cannot be greater than the amount of the electricity sold to the power grid.
where v is the percentage of non-renewable energy in the local power grid.
Based on the historical load data of the building, the shared charging service can be provided if the charging piles are available.
Shared charging time limitation: based on the historical load data of the building, the shared charging service can be provided if the charging piles are available.
Engineering standard limitation: to avoid the fluctuation caused by the sPCEB system, the calculated operation strategy should meet the actual engineering standards of distributed energy sources (General Administration of Quality Supervision et al., 2009; Pingzhou L et al., 2016; State Grid Corporation of China et al., 2016).
The proposed optimization strategy focuses on the optimal design and improvement of renewable energy equipment (such as PV modules and energy storage system) based on existing common buildings. To sum up, the optimized strategy of the sPCEB system is summarized in the following steps (Figure 2):
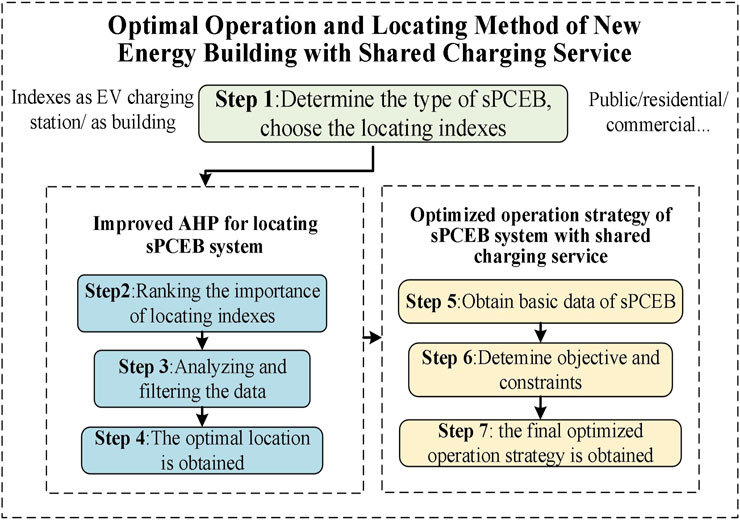
FIGURE 2. Flow chart of the proposed method.
Step 1:. determining the building type. In this article, we mainly discuss two building types, public buildings, and residential buildings.
Step 2:. ranking the importance of locating indexes, according to the needs of decision makers. For residential buildings, the indexes include traffic flow, public transport accessibility, population density, green space accessibility, and housing price; for public buildings, green space accessibility and housing price are not considered, but the attractiveness of the building to users and the cost of the building need to be further considered.
Step 3:. analyzing and filtering the data that are needed for decision making.
Step 4:. the improved AHP is used for locating; the final optimal location is obtained.
Step 5:. obtain basic data of selected building (sPCEB), such as solar energy resources, electricity load, and available charging time.
Step 6:. determine objective and constraints. The combined benefit is taken as the optimal objective, and constraints include the shared charging service fees and area constraints of PV module.
Step 7:. Solving the problem according to the determined objective function and constraints, the final optimized operation strategy is obtained.
The analytical object (urban area) in the simulation is a new first-tier city in China. The data are collected from reality, and the existing buildings can be re-designed and modified at the original situation if necessary.
This region is divided into 11 districts, D1∼D11, one typical residential unit is selected from each district, named as RU1∼RU11. The main avenues in this urban area are named as A1∼A6, respectively. The population density data of D1∼D11 are collected through the national census (National Bureau of Statistics of China, http://www.stats.gov.cn/), and the average housing price data are collected by web crawler through Lianjia (http://www.lianjia.com) in 2021 (Figure 3).
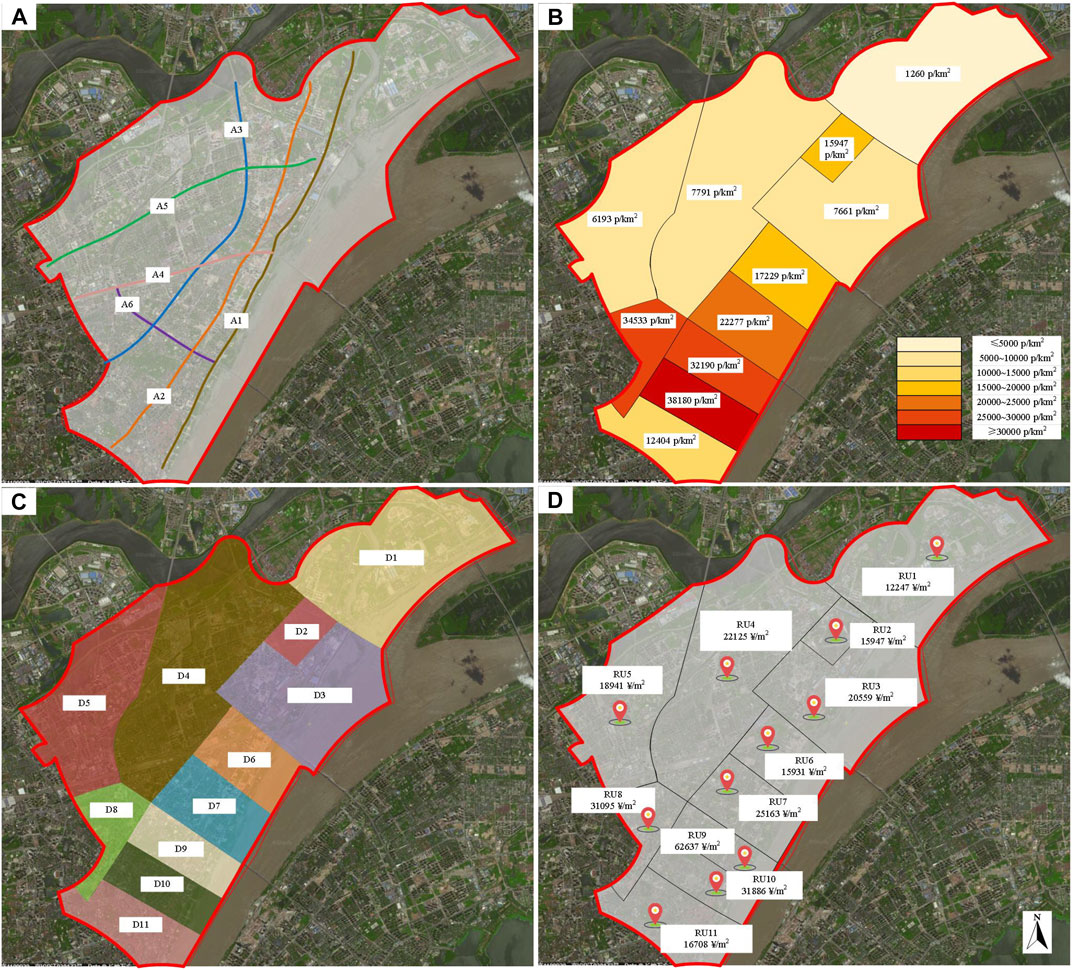
FIGURE 3. Region and statistics (A) main avenues (A1∼A6); (B) population density of each district; (C) districts (D1∼D11); and (D) housing price (RU1∼RU11)
Based on the collection of data, several indexes can be calculated for locating the sPCEB system, as shown in Figure 4. The population density, the reciprocals of housing price, public transport accessibility, green space accessibility, and traffic flow are selected as the locating indexes in this part, and all the data are preprocessed to the range of 1–10, named as Index 1∼5, respectively. Among the aforementioned five indexes, all of them should be higher, except for the housing price, which should be lower.
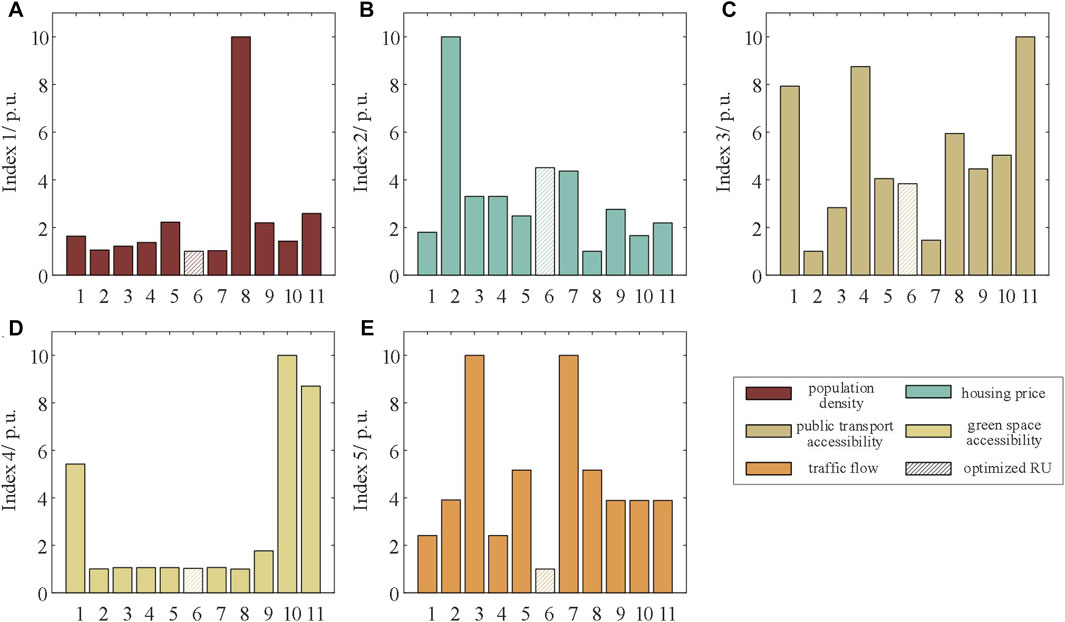
FIGURE 4. Preprocessed data (A) population density (Index 1); (B) housing price (Index 2); (C) public transport accessibility (Index 3); (D) green space accessibility (Index 4); and (E) traffic flow (Index 5)
The population density and housing price data in Figures 4A,B are obtained directly through the collected data. In Figure 4C, the distance of the nearest subway station and bus stop to each residential unit are measured by digital map software (http://ditu.amap.com, https://map.tianditu.gov.cn/), and the corresponding public transport accessibility is derived by applying Eqs 1, 3. In Figure 4D, the area and distance of the nearest green space to each residential unit are also measured by digital map software, thus the green space accessibility can be calculated. In Figure 4E, the traffic flow data of a main avenue (A1∼A6) nearest to it is accumulated by Eq. 1 for each residential unit, and then normalized.
The importance rankings of Index 1∼5 need to be defined during the decision-making process. Here, we take Index 5 > Index 2 > Index 3 > Index 1 = Index 4 as an example, that is, the traffic flow is the most important index, the population density and the green space accessibility are less important, and the rankings are shown in Table 3.
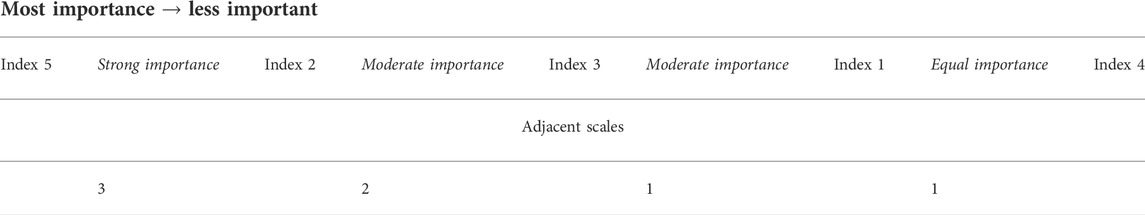
TABLE 3. Importance ranking and scales.
From Table 4, RU6 achieved the highest ranking of all the 11 residential units in both Index 1 and Index 5. Index 5, the traffic flow, is the most important index in this example, which is also an essential factor in determining the location as a charging station. RU6 ranks first in this index among all the residential units. According to the improved AHP, the RU6 is chosen as the most proper location for the sPCEB system.
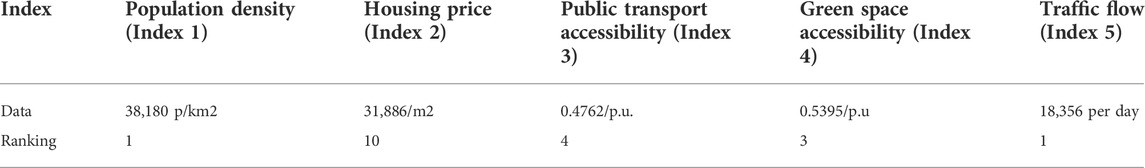
TABLE 4. Data of the optimal location (RU6).
In RU6, the maximum area of PV modules that can be installed on the top surface of the building is 100 m2, and the maximum area of PV modules on the sunny side is 50 m2. The building is designed with one EV charging space, and the maximum power of the charging pile is designed as 10 kw per hour. Owners of the building are used to charging their own car every night from 18 to 24 p.m., so the parking space is temporarily closed to public EV users during that time. The service lives of PV, energy storage, and other devices are considered to be 20 years; the prices of devices refer to the existing system (Tesla Powerwall, Sonnen Home Energy Storage system).
If the power generation efficiency of the PV modules at optimum installation angle (installed on the top surface of the building) is 100%, the power generation efficiency of the vertical sunny side is 54.05% by calculating using PVsyst software. The historical load data of the building and the solar irradiance of the area for a typical day in each of the four seasons of 1 year are shown in Figures 5B,C.
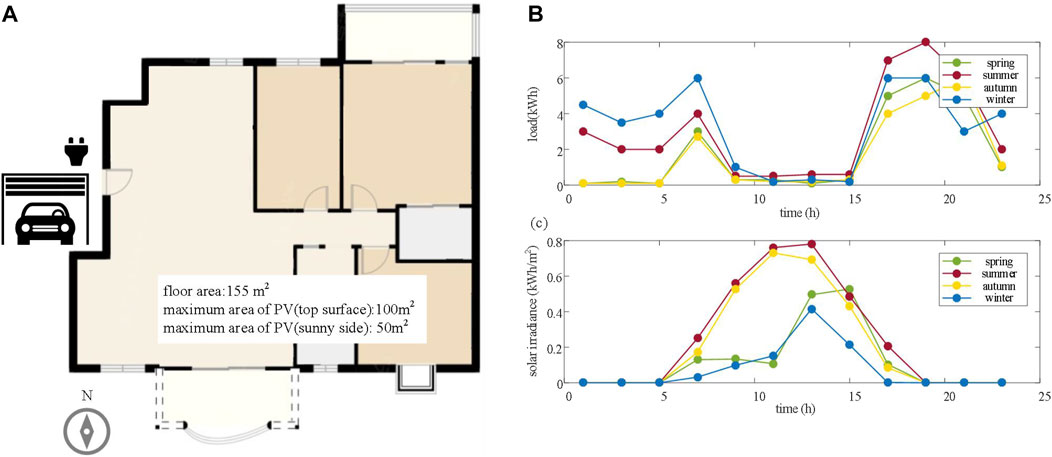
FIGURE 5. Initial data of building (A) floor plan; (B) historical load; and (C) solar irradiance.
It should be noted that the sum of the electricity of sPCEB every 2 hours is shown in the following figures, so the unit of vertical coordinate is kWh. According to Figures 5B,C, the consumption of electricity is mainly concentrated in 5–8 a.m. and 18–24 p.m., the effective working time of PV modules is mainly concentrated in 6 a.m.–18 p.m. Therefore, it needs to be flexibly regulated by the optimal operation strategy. The strategy is solved by a CPLEX optimizer using MATLAB, and the solutions are shown in Figures 6, 7 and Tables 5, 6.
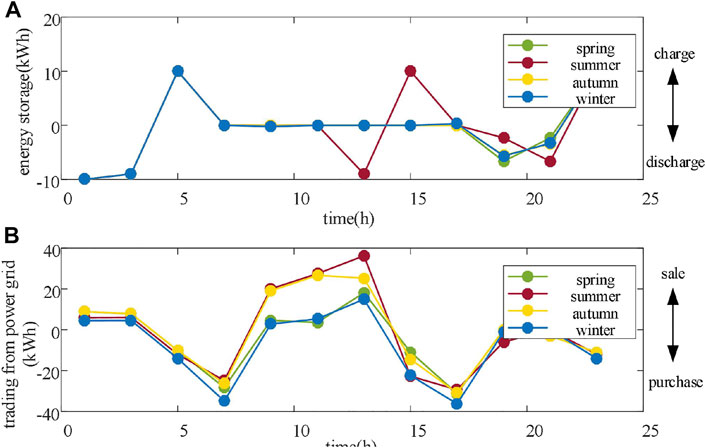
FIGURE 6. Optimal operation (A) discharging/charging of energy storage system and (B) trading of power grid.

FIGURE 7. Location of public buildings.
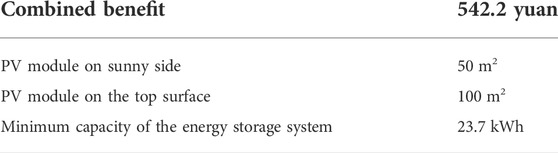
TABLE 5. Parameters of devices.

TABLE 6. Available charging time for others.
In Figure 6A, the value of energy storage greater than zero represents that the energy storage system is charging at this moment, and the value lower than zero represents that the system is discharging. Likewise, in Figure 6B, the value greater than zero represents that the building sells electricity to the power grid, and the value lower than zero represents that the building purchases electricity from the power grid. From Table 5 and Table 6, the combined benefit of the whole four typical days is 542.2 yuan, and the PV module should be installed as much as possible, that is 50 m2 on sunny side, 100 m2 on top surface of the building. The capacity of energy storage system should be 23.7 kwh. The shared charging service is available from 6–8 a.m. and 14–18 p.m. on these four typical days.
In China, distributed energy sources such as photovoltaic and wind power have been vigorously developed in recent years. China has now developed a series of engineering standard for distributed power sources in order to maintain the stability of the power system (Pingzhou L et al., 2016; National Energy Administration et al., 2017). The maximum capacity of distributed generation that can be connected to the 380 V grid is 400 kW. The maximum power of this building interaction with the grid does not exceed 20 kW (the line graphs in the manuscript show the power interacted with the grid every 2 hours, the maximum power does not exceed 40 kWh/2 h. Thus, it can be directly connected to the 380 V grid. The length of the line is 0.5 km. The calculated maximum line voltage drop is only 1.749%, which is much lower than the 7% specified in the standard.
The types of public buildings that can provide shared charging service for public EV users are office buildings, commercial buildings, science, education, culture and health buildings, etc. In this article, 10 public buildings (PB1∼PB10) containing parking spaces are selected for analysis in this region, and the details of each building are shown in Table 7 and Figure 7.
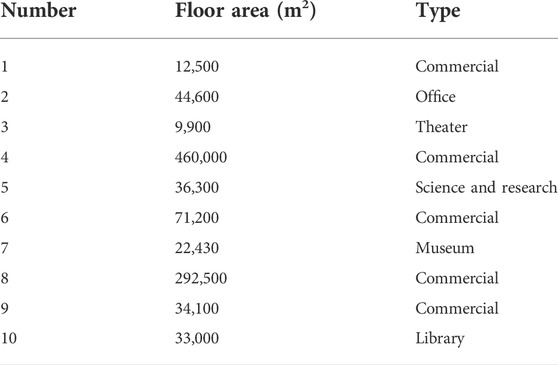
TABLE 7. Details of public buildings.
Five indexes in this section are population density, public transport accessibility, traffic flow, building attractiveness, and construction cost. PB2 is finally chosen as the optimal sPCEB system, and the preprossessed data are shown in Figure 8. The importance rankings of Index 1∼5 are the same as Table 3. It can be found that PB2 is the best in Index 3. Although not all of the indexes are optimal, PB2 is still globally optimal from the overall perspective.
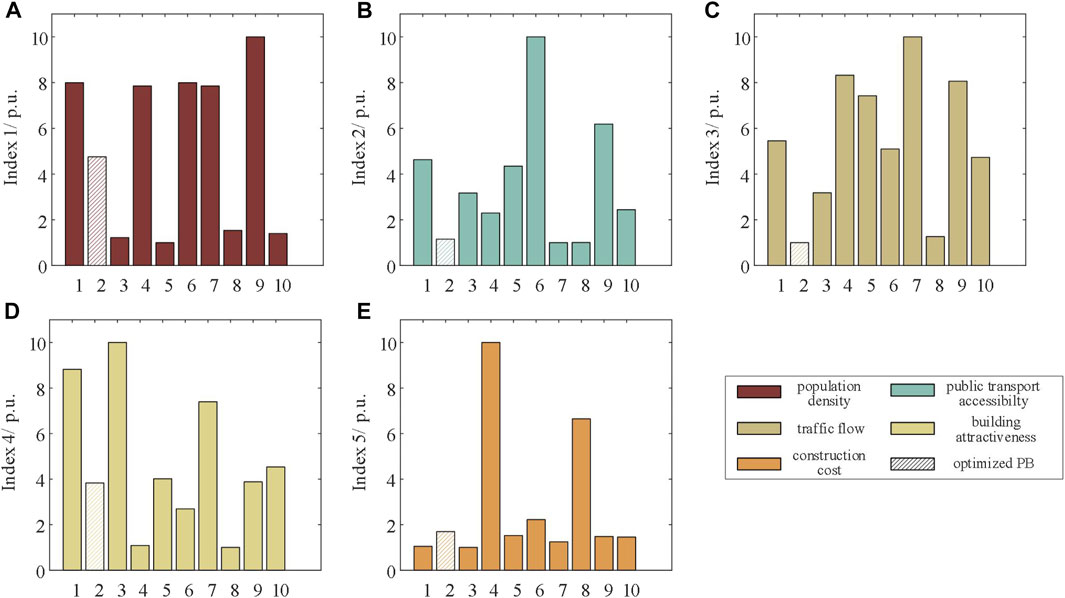
FIGURE 8. Preprocessed data (A) population density; (B) public transport accessibility; (C) traffic flow; (D) building attractiveness; and (E) construction cost.
The type of PB2 is office building, the maximum area of installed PV modules on the top surface is 10,000 m2, and the maximum area of installed PV modules on the sunny side is 4,000 m2 (Figure 9). The building is designed to contain 150 parking spots, with an estimated penetration rate of 10% for EVs, 15 charging piles are available for public EV users all day. The maximum power of the charging piles is 15 kw per hour. By collecting the consumption data of the building for four typical days, the operation strategy of the building is obtained, as shown in Figure 10; Table 8.
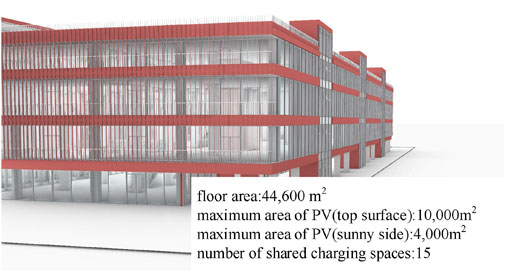
FIGURE 9. Design of the office building.
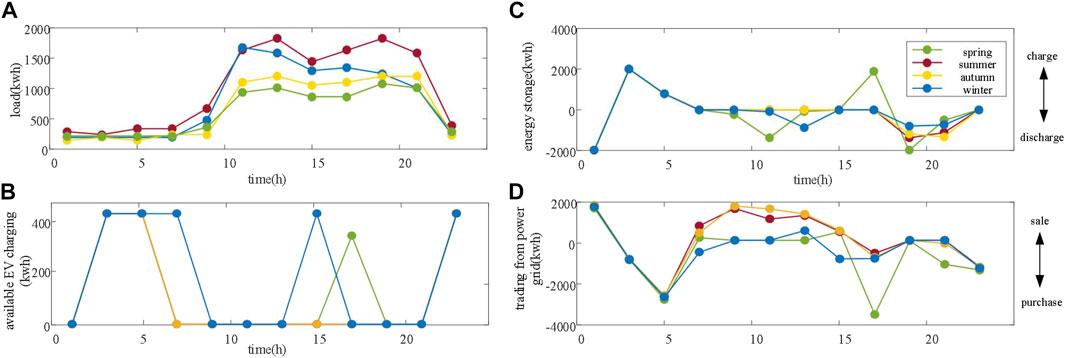
FIGURE 10. Optimal operation (A) historical load of PB2; (B) available shared charging service; (C) discharging/charging of energy storage system; and (D) trading of the power grid.

TABLE 8. Parameters of devices.
The main difference between public building and residential building is: 1) the amount of electricity consumption is large; hence, the demands for energy storage and PV modules are larger; 2) more shared EV charging spaces can be provided throughout all day. In Figures 10A,B, the description of load, storage management, and power trading strategies are similar to the residential building, only the values are different. In Figure 10C, 15 charging piles are all available at 2–6 a.m., 22–24 p.m. (all typical days), 6–8 a.m., and 14–16 p.m. (typical day in winter), 14 charging piles are available at 16–18 p.m. (typical day in spring).
The shared public building in this section will be connected to a 10 kV grid with a line length of 1 km. The maximum power of the proposed optimal operation strategy does not exceed 2 MW per hour, and the maximum line voltage drop is calculated to be 1.436%.
In the previous analysis, the combined benefits of the optimization objectives include the environmental, social, and economic impacts of the sPCEB system. However, from the perspective of the owners of the sPCEB system, the investment costs and the corresponding revenues are the primary concern.
Assuming that the charging piles are full load, Figure 11 presents the comparison between public building PB2 and residential building RU6 in terms of the electricity cost, revenues of shared charging service, and investment costs of devices. Actually, the charging piles are not always in full load, thus the surplus energy can be sold to the power grid. Accordingly, the actual revenue of shared charging service is less than or equal to 342 yuan for RU10 and 6,327 yuan for PB2. Even without the shared charging revenue, the saved electricity fees are still greater than the average device cost.
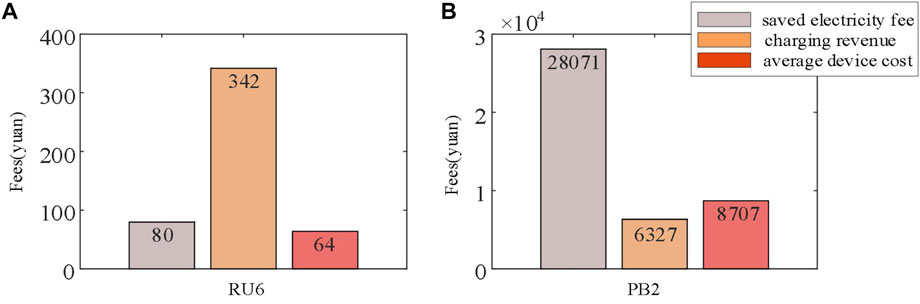
FIGURE 11. Comparison of revenues and costs (A) RU6 and (B)PB2.
Figure 11A shows the comparison results for RU6. RU6 saves 80 yuan in electricity costs, and earns the charging revenues for 342 yuan. The average device cost is 64 yuan (service life: 20 years and average time: four typical days). In other words, not only can save some electricity expenses but also can generate an additional benefit of 278 yuan for using the optimal operating strategy in this article.
Figure 11B shows the comparison results for PB2. PB2 saves 28,071 yuan in electricity costs and earns the charging revenues for 6,327 yuan, the device costs are 8,707 yuan. That is, PB2 needs to pay 28,071 yuan for purchasing electricity from the power grid if not using the optimization strategy of this article; however, the costs have reduced to 2,380 yuan.
This section compares the combined benefits of applying the optimal operating strategy with and without the shared charging service, and the results are shown in Figure 12. For RU6, the combined benefit will be 542 yuan if the shared charging service is included, and the combined benefit will be 97 yuan if the shared charging service is excluded, and the total benefits increased by 445 yuan. For PB2, the total benefits increased by 4,530 yuan.
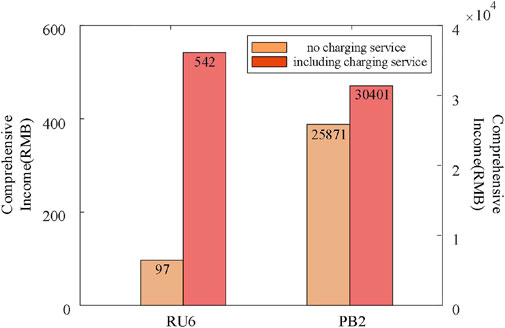
FIGURE 12. Comparison of combined benefits in RU6 and PB2.
This article proposes a concept of the sPCEB system. More specifically, the location problem of the system is solved by the improved AHP, and the optimal operating strategy with shared charging service is further introduced. The simulation results indicate that:
1) The locating method of sPCEB can objectively give the order of importance of each element based on specific data analysis results, which can overcome the problem that the traditional AHP method cannot pass the consistency test with too many elements on the one hand, and combining the advantages of subjective and objective judgment on the other hand. It makes the decision-making process more user-friendly and more convenient.
2) The optimal operating strategy with shared charging service can not only improve the combined benefits of the building system from the perspective of social, environmental, and economic, but also greatly reduce the cost of purchasing electricity from the power grid for the owners and improve the local energy consumption capacity of the building. In addition, it achieves greater combined benefits comparing to optimal operation without shared charging services
The original contributions presented in the study are included in the article/Supplementary Material; further inquiries can be directed to the corresponding author.
CL, ZW, and BG contributed to conception and design of the study. HD organized the database. LL performed the statistical analysis. Other authors helped supervised the project. All authors contributed to manuscript revision, read, and approved the submitted version.
The authors declare that the research was conducted in the absence of any commercial or financial relationships that could be construed as a potential conflict of interest.
All claims expressed in this article are solely those of the authors and do not necessarily represent those of their affiliated organizations, or those of the publisher, the editors, and the reviewers. Any product that may be evaluated in this article, or claim that may be made by its manufacturer, is not guaranteed or endorsed by the publisher.
Albacete, X., Olaru, D., Paül, V., and Biermann, S. (2017). Measuring the accessibility of public transport: A critical comparison between methods in helsinki. Appl. Spat. Anal. Policy 10, 161–188. doi:10.1007/s12061-015-9177-8
Bheema, T. L., and June, T. H. M. (2017). A framework for electric vehicle (EV) charging in Singapore. Energy Procedia 143, 15–20. doi:10.1016/j.egypro.2017.12.641
Danhong, W., Xiang, L., Julien, M., Carmeliet, J., and Orehounig, K. (2021). Advancing the thermal network representation for the optimal design of distributed multi-energy systems. Front. Energy Res. 9. doi:10.3389/fenrg.2021.668124
Feng, D., Ying, W., Bin, S., Hua, Y., and Zhang, Y. (2019). The process of peak CO2 emissions in developed economies: A perspective of industrialization and urbanization. Resour. Conservation Recycl. 141, 61–75. doi:10.1016/j.resconrec.2018.10.010
General Administration of Quality Supervision (2009). Power quality-deviation of supply voltage. Beijing. GB/T 12325-2008.Inspection and quarantine of the people's republic of China
Hansen, W. G. (1959). How accessibility shapes land use. J. Am. Inst. Plann. 25, 73–76. doi:10.1080/01944365908978307
Heinstein, P., Ballif, C., and Perret-Aebi, L. (2013). Building integrated photovoltaics (BIPV): Review, potentials, barriers and myths. Green 3, 125–156. doi:10.1515/green-2013-0020
Huanan, L., and Quande, Q. (2019). Challenges for China's carbon emissions peaking in 2030: A decomposition and decoupling analysis. J. Clean. Prod. 207, 857–865. doi:10.1016/j.jclepro.2018.10.043
Igor, S., Assunta, N., and Karsten, V. (2012). Net zero energy buildings: A consistent definition framework. Energy Build. 48, 220–232. doi:10.1016/j.enbuild.2012.01.032
Kapsalaki, M., Leal, V., and Santamouris, M. (2012). A methodology for economic efficient design of Net Zero Energy Buildings. Energy Build. 55, 765–778. doi:10.1016/j.enbuild.2012.10.022
Michael, B., Prateek, M., and Sivasathya, B. (2021). “Incorporating residential Smart electric vehicle charging in Home energy management systems,” in IEEE green technologies conference. doi:10.1109/GreenTech48523.2021.00039
Muhammad, A. S., Mohammad, M. Z., and Adam, T. (2018). Public transport accessibility: A literature review. Periodica Polytechnica Transportation Engineering. doi:10.3311/PPtr.12072
Muhammad, Z. (2014). A hybrid approach for reliability analysis based on analytic hierarchy process and Bayesian network. Front. Energy Res. 2. doi:10.3389/fenrg.2014.00052
National Energy Administration,National Development and Reform Commission (2017). Notice of the two departments on the pilot market-oriented trading of distributed power generation. Available at: http://www.gov.cn/xinwen/2017-11/14/content_5239535.htm (Accessed November 14, 2017).
Olszewski, P., and Wibowo, S. S. (2005). Using equivalent walking distance to assess pedestrian accessibility to transit stations in Singapore. Transportation Research Record, 38–45. doi:10.1177/0361198105192700105
Overview of Greenhouse Gases (2021). Overview of greenhouse gases. Available at: https://www.epa.gov/ghgemissions/overview-greenhouse-gases (Accessed November 19, 2021).
Pingzhou, L., Kaisheng, B., and Yuanhui, R. (2016). Design manual for industrial and civil power supply and distribution. Beijing: China Electric Power Press.
Qiwei, J., Tingxiang, L., Xiaotao, C., Laijun, C., Yang, S., Shengweio, M., et al. (2021). Optimized regulation of hybrid adiabatic compressed air energy storage system for zero-carbon-emission micro-energy network. Front. Energy Res. doi:10.3389/fenrg.2021.745457
Ruike New Energy (2022). National speed skating oval. Available at: http://www.rksolar.com.cn/en/.
Sayali, A. J., Sanjay, K. S., and Pushpendra, S. (2021). “Control strategies for electric vehicle charging station: A review,” in 2021 2nd international conference for emerging Technology. doi:10.1109/INCET51464.2021.9456280
Schirmer, P. M., Van Eggermond, M. A. B., and Axhausen, K. W. (2014). The role of location in residential location choice models: A review of literature. J. Transp. Land Use 7, 3. doi:10.5198/jtlu.v7i2.740
Sonnen Home Energy Storage (2022). Power your life with a smart, reliable, and safe home battery from sonnen. Available at: https://sonnenusa.com/en/.
State Grid Corporation of China (2016). Technical rule for distributed resources connected to power grid. Beijing. Q/GDW 1480-2015.
Tesla Powerwall (2022). Powerwall. Available at: https://www.tesla.com/powerwall.
The Paris Agreement (2015). The Paris agreement. Available at: https://www.un.org/en/climatechange/paris-agreement (Accessed December 12, 2015).
Keywords: location problem, data analysis, new energy building, analytic hierarchy process, electric vehicle, optimal operating strategy, mixed-integer linear programming
Citation: Liu C, Wang W, Wang Z, Chen S, Su P, Gao H, Xu C, Ge B, Ding H and Liu L (2022) Optimal operation and locating method of new energy building with shared charging service. Front. Energy Res. 10:865060. doi: 10.3389/fenrg.2022.865060
Received: 29 January 2022; Accepted: 05 July 2022;
Published: 08 August 2022.
Edited by:
Yan Xu, Nanyang Technological University, SingaporeReviewed by:
Wei Liu, Chengdu University of Technology, ChinaCopyright © 2022 Liu, Wang, Wang, Chen, Su, Gao, Xu, Ge, Ding and Liu. This is an open-access article distributed under the terms of the Creative Commons Attribution License (CC BY). The use, distribution or reproduction in other forums is permitted, provided the original author(s) and the copyright owner(s) are credited and that the original publication in this journal is cited, in accordance with accepted academic practice. No use, distribution or reproduction is permitted which does not comply with these terms.
*Correspondence: Liang Liu, bGl1XzA4MjZAMTI2LmNvbQ==
Disclaimer: All claims expressed in this article are solely those of the authors and do not necessarily represent those of their affiliated organizations, or those of the publisher, the editors and the reviewers. Any product that may be evaluated in this article or claim that may be made by its manufacturer is not guaranteed or endorsed by the publisher.
Research integrity at Frontiers
Learn more about the work of our research integrity team to safeguard the quality of each article we publish.