 Li Yabing
 Lu Xianghui
 Chen Peng
95% of researchers rate our articles as excellent or good
Learn more about the work of our research integrity team to safeguard the quality of each article we publish.
Find out more
ORIGINAL RESEARCH article
Front. Energy Res. , 14 April 2022
Sec. Nuclear Energy
Volume 10 - 2022 | https://doi.org/10.3389/fenrg.2022.864950
This article is part of the Research Topic Experimental and Analytical Investigations on Nuclear Reactor Safety, Severe Accident Phenomena and Severe Accident Mitigation of Nuclear Power Plants View all 20 articles
The nuclear regulation authorities of many countries require that the containment remains its integrity for a local hydrogen risk during any possible accident conditions. Therefore, the combustion consequence should be analyzed to demonstrate that the containment integrity is not being challenged for the hydrogen risk when the flame acceleration risk cannot be safely ruled out. Considering the uncertainties of both the combustion model and severe accident analysis, the criteria and experimentally based combustion (CREBCOM) model is adopted to provide a conservative result for pressure and the thermal load for combustion analyses in this study. Firstly, the CREBCOM is developed in the GASFLOW-MPI code and validated with the RUT experiment. The result shows that the CREBCOM model can provide a reliable overpressure for the choking regime combustion. Then, this model is adopted for the hydrogen safety analysis for the Advanced Pressurized Water Reactor (PWR) 1000. The hydrogen distribution is calculated with the mass and energy release obtained from severe accident analysis, from which, the most unfavorable ignition time and location is selected. The result of the CREBCOM model is compared with that of the turbulent flame closure model, which is a commonly used model for combustion analysis in containment safety. The results show that the CREBCOM model can provide a conservative prediction for the pressure and thermal load of combustion. Therefore, the CREBCOM model with the sonic flame assumption is applicable for the FA risk analysis in a local compartment for nuclear containments where a sonic deflagration cannot be safely excluded and manages to obtain a conservative pressure and thermal load for further evaluation on the containment integrity.
Hydrogen can be released and accumulate in some local compartments of the containment, leading to local hydrogen risk due to its geometric complexity. The nuclear regulation authorities of many countries require that the containment integrity should not be challenged by local hydrogen risk during any possible accident conditions (NEA, 2014). The main objective of this analysis consists of two parts: the combustion (pressure and thermal) loads from combustion do not challenge the containment integrity, and the combustion load does not damage the capability for severe accident analysis (NRC, 2020). In order to meet this regulation, it must be demonstrated that deflagration–detonation–transient (DDT) or flame acceleration (FA) can be safety excluded for any accident sequence or, if not, will not challenge the containment integrity. A commonly adopted method for this issue is 3D CFD analysis including hydrogen release, dispersion, and combustion, by either modeling the whole containment (Dimmelmeier et al., 2012; Kang et al., 2020; Wang and Cao, 2017) or isolating the target compartment (Zhao et al., 2022; Qiang and Yaodong, 2012; Zhang et al., 2018).
A proper FA analysis should include the process of flame acceleration to determine if the combustion reaches the choking regime with isobaric sound speed flame and, if so, calculate the overpressure to impact the influence on the containment integrity. This requires that a calculation covers the combustion region, transiting from the subsonic flame regime to choking regime (Breitung et al., 2000). Lots of efforts are conducted to simulate this whole process, requiring a rather refined mesh and detailed combustion and turbulence models (Goulier et al., 2017; Sathiah et al., 2012; Halouane and Dehbi, 2017) and mainly aiming at experimental facilities with small scales. The combustion models including turbulent flame closure (TFC) models with different flame speed correlations, the eddy breakup model (Yuen et al., 2022), and eddy dispassion model are commonly adopted in the combustion analysis related to nuclear safety (Sathiah et al., 2012; IAEA/CSNI, 2011) The validity of theoretical models depends greatly on the Borghi diagram regime and corresponding flame front structure (Breitung et al., 2000). However, the flame speed, developing from a subsonic to isobaric sound speed, covers different regimes on the Borghi diagram, depending on the gas mixture compositions and boundary conditions like obstacle structures, indicating that it would be difficult to simulate the whole process with a certain combustion model. The capabilities of the combustion model for flame acceleration/deceleration have to be enhanced to a level providing reliable forecast (Zhao, 2017).
Another problem for FA analysis in nuclear safety is its complexity in both spatial and temporal. The obstacles in containment have length scales in a wide range; hence, the obstacles would be simplified in the geometry model for numerical simulations. The complex geometry of the compartment makes it difficult to estimate the block ratio in this area; hence it is quite impractical to estimate the flame acceleration rate for a given set of conditions (Breitung et al., 2000). Moreover, the complexity of the severe accident phenomena, including the accident process, location, and rate of the hydrogen release (Bentaib et al., 2015), also make it impossible to conduct a large number of scenario analyses and build the accident spectrum like what is done in the possibility safety analysis. This means that assessments and evaluations are conducted based on a few analyses for engineering applications, while the questions regarding its reliability and uncertainty are always raised by the nuclear regulation authorities in this situation.
However, it is the thermal and pressure load that really matters for the hydrogen safety analysis for a containment rather than the detailed process of the deflagration (Sathiah et al., 2012). The detailed behavior of the flame accelerating to the choking regime, which cannot be well predicted with many combustion models (IAEA/CSNI, 2011), is less relevant for the hydrogen safety analysis of the containment. More importantly, the choking regime combustion can cause high overpressure that can damage the containment structures. For instance, research presents an analysis on the pressure load of the fast deflagration of hydrogen, indicating that the pressure load of fast hydrogen deflagration can also lead to the structural failure (Yabez et al., 2015). Since a sonic speed flame cannot be safely excluded, the combustion can be assumed as the choking regime obtains a conservative combustion load for the FA risk analysis, thus evaluating the impact of FA on the containment integrity. This is the main idea of the criteria and experimentally based combustion (CREBCOM) model (Efimenko and Dorofeev, 2001).
In this study, the CREBCOM model is introduced for hydrogen safety analysis to predict the conservative estimation of loads from hydrogen combustion. The major assumption of this model is to assume the flame speed as the sonic speed for the FA risk situation, neglecting the flame acceleration, thereby obtaining a conservative combustion load. By doing so, the uncertainties of the combustion analysis can be enveloped by conservative loads, thereby reducing the impact of the uncertainties for the combustion assessment of engineering applications, as illustrated in Figure 1.
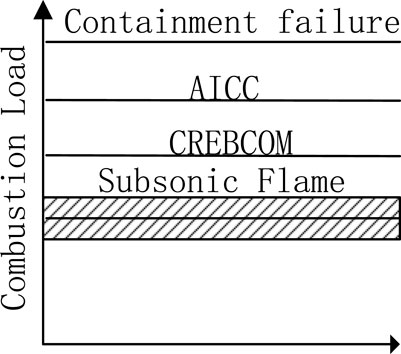
FIGURE 1. Diagram of safety margins for different combustion analysis methods.
This paper is constructed as follows: the CREBCOM model is introduced and validated at Chapter 2; the geometry and physical model and the initial and boundary of the combustion calculation are introduced in Chapter 3; three combustion cases are analyzed and discussed in Chapter 4; and the main conclusions are summarized in Chapter 5.
The GASFLOW-MPI is a well validated and widely used parallel 3-Dimensional Computational Fluid Dynamics (3D CFD) code for the containment safety analysis (Xiao et al., 2016a). It solves the compressible Navier–Stokes equations for three-dimensional volumes in Cartesian or cylindrical coordinates. The relevant phenomena including the release, transportation, and deflagration of the hydrogen are validated in plenty of international projects, for instance, the Thermal Hydraulics, Aerosols and Iodine facility (THAI) (HM-1 and 2) (Royl et al., 2006), MISTRA (ISP47) (NEA, 2007), and THAI HD-23 (Xiao et al., 2017a).
The transport equation for the combustion model of GASFLOW-MPI is given in Eq. 1. Two combustion models discussed in this study, i.e., the CREBCOM model and TFC, are with the same formation of the transport equation but different in the source term of the equation, as listed below. The latter one is originated by Zimont in late 1990 (Zimont et al., 1998) and is a widely adopted combustion model in nuclear safety analysis (Sathiah et al., 2012; IAEA/CSNI, 2011). It solves the transport equations of the progress variable, which is suitable for premixed combustion simulation at
where
The main objective of the CREBCOM model is to give a conservative estimation of the loads from hydrogen combustion by adopting a conservative flame speed for different combustion regimes (Efimenko and Dorofeev, 2001). It should be pointed out that this model aims to provide conservative pressure and thermal load rather than reproduce the real physical phenomena. The development of the flame is neglected; instead, a specific combustion model is selected for each combustion regime based on different criteria, as listed in Table 1. As for the combustion analysis in the containment, the DDT risk is excluded during the containment design, and the analysis of the slow deflagration can usually be bounded by the adiabatic isochoric complete combustion analysis (NEA, 2014). Hence, this study focuses on the fast deflagration in local compartments. In this situation, the CREBCOM model is implemented in the GASFLOW-MPI as follows: determining the combustion regimes with σ criteria firstly, then applying sonic speed for the flame to calculate the combustion rate for the case that exceeds the σ criteria, as given in Table 1. The model is conservative because the flame does not necessarily reach the sonic speed, even for the case that exceeds the σ criteria, and the flame acceleration process is neglected.

TABLE 1. Structure of CREBCOM model.
Here, the
The RUT facility is a large-scale test facility for hydrogen deflagration and detonation at Kurchatov Institute, Russia (Efimenko and Dorofeev, 2001). The RUT test sth6 is used to validate the CREBCOM model. The initial gas mixture is 29.6% H2 in dry air plus 45 vol% H2O (Efimenko and Dorofeev, 2001) with initial temperature at 363 K and pressure at 1 bar. The experiment facility consists of three parts: a channel of 2.5 m × 2.3 m cross-section and 34.6 m long; a canyon 2.5 m × 6 m cross-section and 10.5 m long; a channel of 2.5 m × 2.3 m cross-section and 20 m long. The computational region is meshed uniformly with mesh size equal to 0.1 m (Efimenko and Dorofeev, 2001), with a total mesh number of 1,015,560 as shown in Figure 2. The detached eddy simulation (DES) model is adopted for the turbulence model. The heat transfer model is neglected in the simulation because of the short simulation time. The CREBCOM model is adopted with the flame speed 770 m/s as measured in the experiment, which is the choking regime according to Breitung et al. (2000), and another calculation is conducted with the TFC model as a comparison.
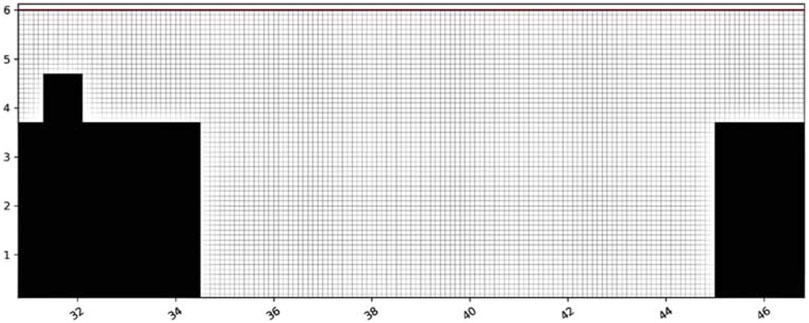
FIGURE 2. Geometry model and mesh of the RUT facility.
In the experiment, the flame accelerates to the choking regime, leading to the first pressure peak (Figure 3), which is reproduced by the CREBCOM model. The X-Z view of temperature and pressure are given in Figure 4. The results show that the CREBCOM simulation has the similar trend compared with the experiment data (Efimenko and Dorofeev, 2001; Studer et al., 2013), while the TFC simulation underestimates the pressure load of the combustion. This is because the adequate combustion regime of the TFC model is within the Damköhler’s limit; however, the Damköhler number is lower than the unit for the choking regime according to the Borghi diagram [9–11]. As a result, the TFC model is insufficient for the combustion analysis for the containment where the FA risk cannot be excluded. Therefore, the CREBCOM model manages to have a reasonable prediction on the overpressure for choking regime combustion and is thereby adequate for the FA analysis of containment.
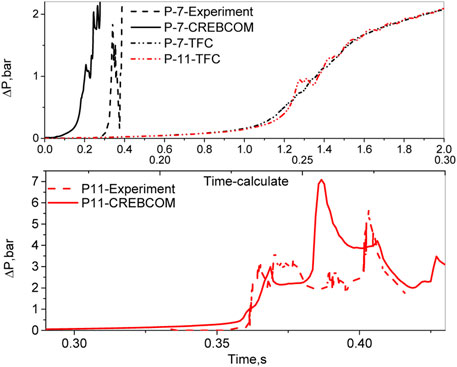
FIGURE 3. Pressure of P7 and P11 of RUT test sth6—Experiment vs. CREBCOM and TFC model (Efimenko and Dorofeev, 2001; Studer et al., 2013).
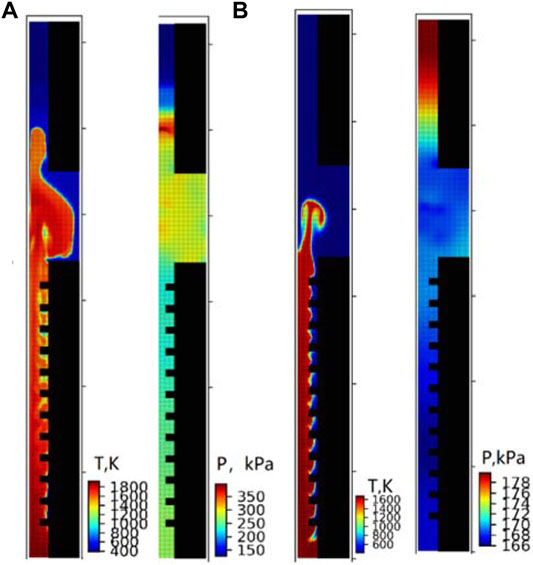
FIGURE 4. X-Z view of temperature and pressure of RUT calculation. (A)
The containment of Advanced Pressurized Water Reactor (PWR) 1000 has an inner radius of 22.5 m and height of 66.4 m. The geometry model is built in cylindrical coordination, with the computational region ranging from −7 m ∼ 9.9 5 m at axial direction and 0–23 m in radial direction. The computational region is divided into 26 grids in the radius direction, 72 grids in the peripheral direction, and 70 grids in the axial direction for the hydrogen distribution analysis, and the mesh is refined twice in both the radius and axial direction for the combustion analysis, with a total mesh number of 524,160. A mesh sensitivity is conducted with grids divided by 26 × 72 × 70, 26 × 72 × 140, and 52 × 72 × 140; the results show a similar tendency for these three cases, indicating the grid independence.
The containment has a rather complex inner geometry; hence, it is unrealistic to model all the details inside the containment and a certain simplification must be made. The major structures of the compartments and major manufactures of the primary loop are included in the geometry model, while the small parts below the grid resolution are neglected. Moreover, the geometry is modified, adapting to the orthogonal grid adopted in GASFLOW-MPI. The model includes floors, ceilings, and walls for major compartments [steam generator (SG) compartments, pump compartments, cavity, pressurizer (PZR) compartment, and accumulator (ACC) compartment] shown in Figures 5, 6. The neglected steel parts are modeled as distributed heat sink, which is simplified as a one-side heat transfer surface with the same mass and area as the real geometry. Both conductive and convection heat transfer are calculated for the distributed heat sink.
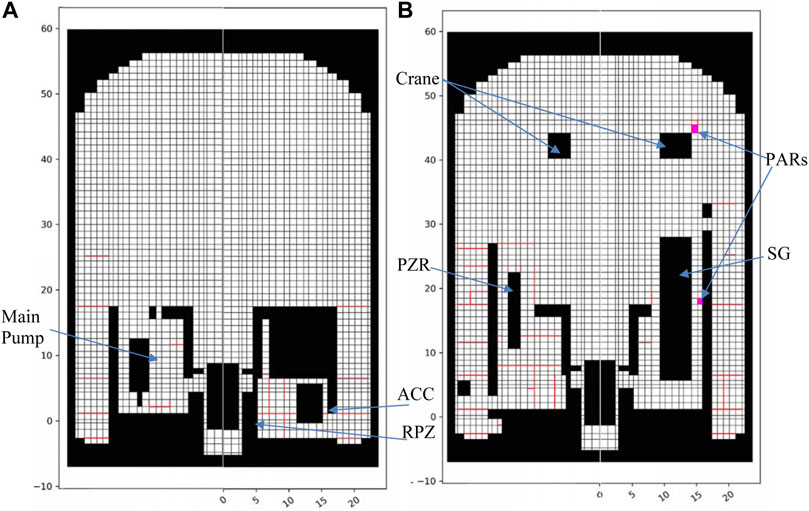
FIGURE 5. R-Z view of the containment geometry model-case0. (A) 0° and 180°. (B) SG and PZR compartment.
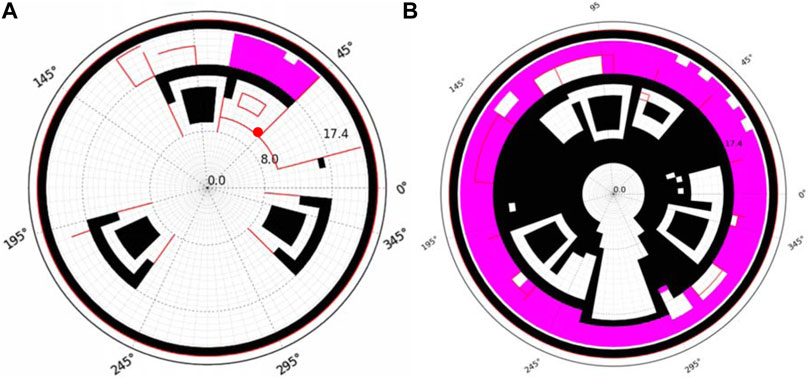
FIGURE 6. Cross-section view of the containment geometry model-case0. (A) Cross-section at the height of the injection (red point: igniting point). (B) Cross-section at the 17.5 m.
The passive automatic recombination (PAR) is equated in the containment of Advanced PWR 1000 to mitigate the hydrogen risk during severe accidents. The PAR is modeled as a rectangle chimney with suction at the bottom and a vent at the upper part of the side wall, as shown in Figure 5B. The recombination rate of the PAR is calculated with the empirical correlation of the Siemens model (Xiao et al., 2016a). Please note that the PAR recombination is neglected during the combustion because the hydrogen-consuming rate for the combustion is far greater than that of the PAR.
For the hydrogen risk analysis for the containment, the mass and energy release are obtained from the lumped parameter code, as well as the initial condition of the containment. Table 2 summarizes the physical model adopted in the analysis. The DES model is adopted in this analysis, whose detailed information and validation are included in Zhang et al. (2018). For the geometry structures, convective, condensation, and radiant heat transfer are included. Three combustion cases are analyzed: two cases with the CREBCOM model with different flame speeds and one case with the TFC model as a comparison. The flame speed refers to the range of the isobaric sonic speed based on experimental data.
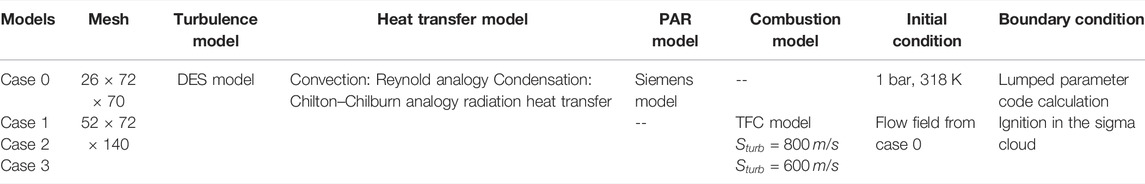
TABLE 2. Summary of physical model and initial and boundary conditions.
The hydrogen distribution is calculated with the mass and energy release from a postulated accident with a break at the top of the pressurizer. The hydrogen is released at the top of the pressurizer and is blocked by the compartment ceiling, leading to local hydrogen accumulation below the ceiling. The hydrogen distribution is calculated with GASFLOW-MPI, and the hydrogen risk of FA and DDT are evaluated with the σ criterion (Xiao et al., 2016a) and the λ criterion, respectively. Based on this, the ignition timing and location are selected.
Firstly, the DDT risk is analyzed with the λ criterion criteria (Dorofeev et al., 2000). The λ criterion is defined as the ratio of the characteristic size of the flammable gases L and 7 times the detonation cell size λ as given below, with detailed information found in Dorofeev et al. (2000), and Xiao et al. (2016b).
The DDT can occur only if the λ criterion is higher than a unit. The DDT risk analysis shows that the λ criterion for a gas cloud with a hydrogen concentration higher than 4 vol% in the containment is far lower than the unit (as shown in Figure 7), indicating that the DDT is unlikely to occur. The DDT risk could be safely excluded during the whole accident process, complying with the requirement of safety regulations.
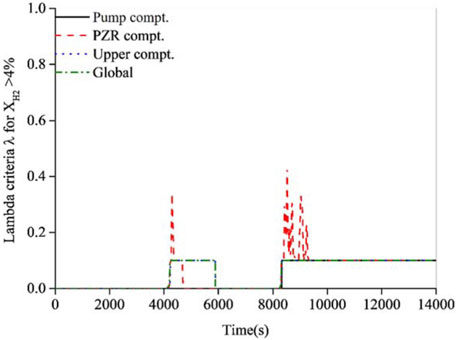
FIGURE 7. The λ criteria for hydrogen cloud (XH2>4 vol%) in major compartments.
Then, the σ criterion is adopted to evaluate the risk of FA. Once the FA risk cannot be excluded, the combustion analysis should be conducted. The ignition time and location should be selected to have the most punishing result for the combustion. A certain amount of σ cloud (gas cloud over the σ criterion) exists near the hydrogen injection as shown in Figure 8B, although it will soon be diminished by the following steam injection. Since the risk of FA cannot be safely excluded during the accident based on the analysis of the σ criterion, it must be demonstrated that the containment integrity will not be challenged after a postulated ignition even at an unfavorable time or location in the containment.
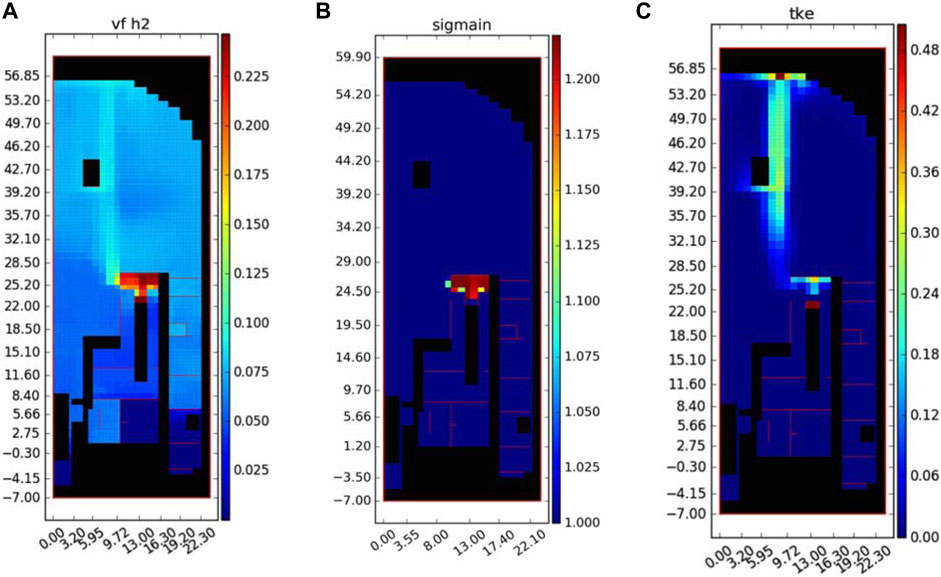
FIGURE 8. Initial flow field for the combustion analysis. (A) Hydrogen concentration. (B) σ Criterion. (C) Turbulent kinetic energy.
The selection of the ignition time aims at resulting in a more penalizing pressure load in the containment; therefore, the ignition time is selected at the maximum inventory of the σ cloud (gas cloud with σ > 1), which is 10,000 s after the accident initiated, as shown in Figure 9. Table 3 summarizes the atmosphere conditions of the PZR compartment as well as global containment, and the distributions of the hydrogen, σ criterion, and turbulent kinetic energy are presented in Figures 8A–C, respectively. The σ cloud mainly accumulates under the ceiling of the PZR compartment with a total volume of 115 m3. The ignition location is selected to yield a long run-up distance for the flame propagation, which is the diagonal under the diagonal point of the ceiling, as shown in Figure 6A.
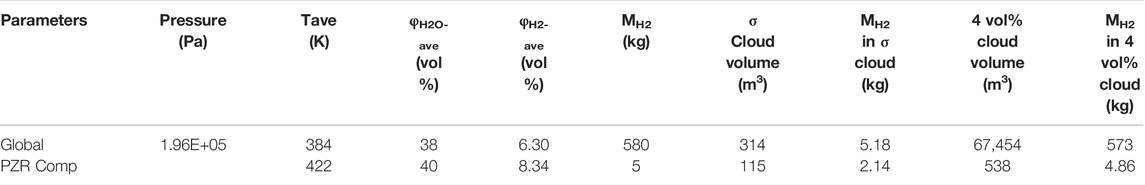
TABLE 3. Atmosphere conditions at ignition times.
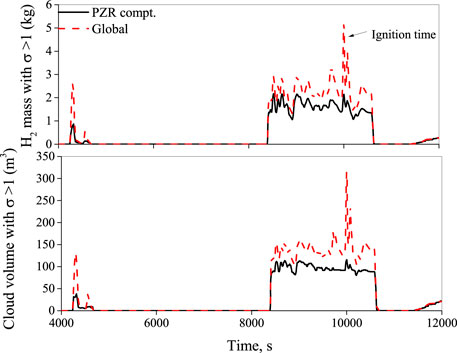
FIGURE 9. Volume and hydrogen inventory of σ cloud.
In this section, the three cases with detailed information listed in Table 2 are analyzed and discussed for the fast deflagration analysis.
The three combustion cases are analyzed with the initial and boundary conditions listed in Table 2. The global hydrogen consumption rate is shown in Figure 10. The peak combustion rate for the CREBCOM model is 4.3 and 6.7 times higher than that of the TFC model. The distribution of temperature at different time points is presented in Figure 11 to demonstrate the propagation of the flame for the three cases. By the time of ignition, the average mole fraction of the containment is 6.30%, indicating a global flammable gas mixture; hence, the combustion spreads to the global containment after being ignited in the PZR compartment. For case 1, the combustion of the gas mixture with a high hydrogen concentration in the PZR compartment creates a horizontal flame at the junction of the PZR compartment.
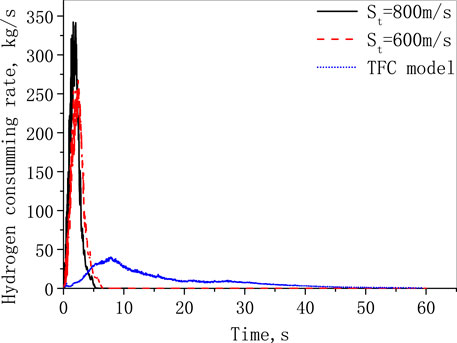
FIGURE 10. Hydrogen consumption rate.
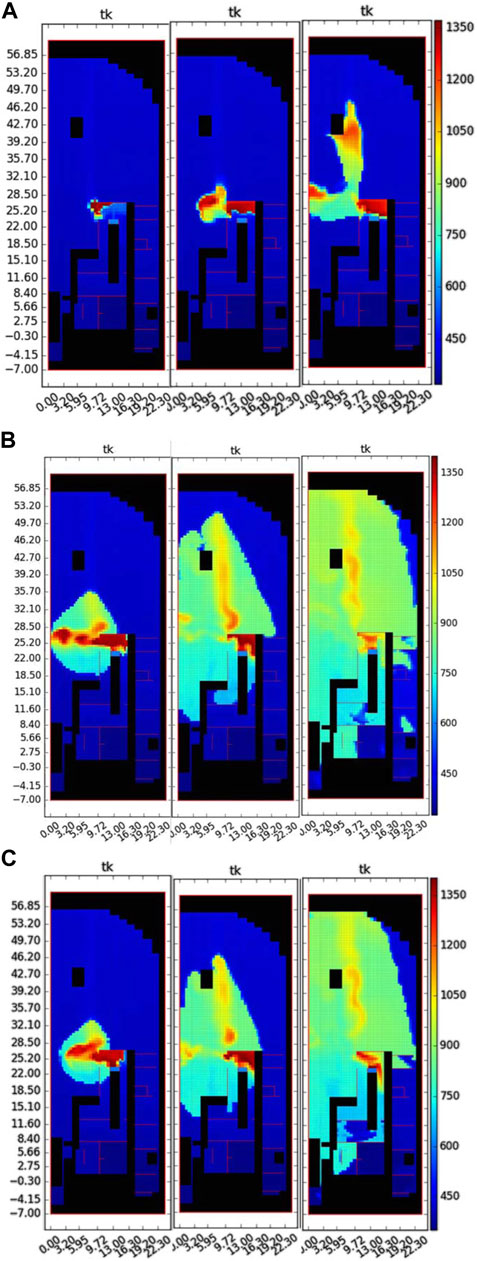
FIGURE 11. R-Z view of the temperature at the PZR compartment slide (0.5 s – 1 s–2 s after ignition). (A) TFC model. (B)
Meanwhile, the flame propagates along the hydrogen plume near the junction, forming a vertical flame; both a horizontal and a vertical flame are observed at the outlet of the PZR, as shown in Figure 11A. The flame mainly propagates horizontally and upwards, not downwards. In this calculation, the flame only propagates downwards after the rest of the gas mixture above is already being ignited. The situation is quite different for the CREBCOM model. The source term of the combustion transportation equation is given as a constant rather than the calculated flame speed; the calculated flame propagates nearly isotropically, upwards and downwards at the same time, as shown in Figures 11B,C. This is physically unrealistic because the flammable limitation to propagate downwards is about 8% (KUMAR et al., 1983) while the hydrogen concentration below the elevation of the injection is about 6%. The flame of case 3 propagates with a similar behavior but with a lower rate compared with case 2. The result of three combustion analyses is summarized in Table 4.
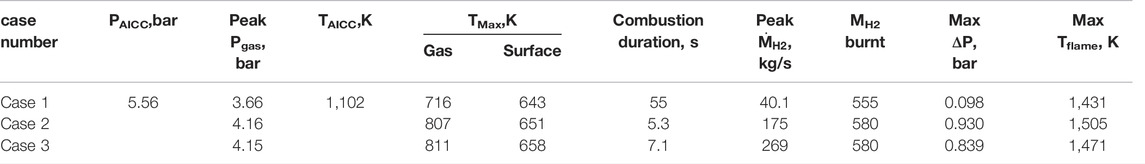
TABLE 4. Summary of global combustion characteristics.
The analysis for both pressure and thermal load is restricted to the sigma cloud where the FA can occur. The transient results with the maximum overpressure for the three cases are given in Figure 12. The result shows that the sonic flame speed leads to higher overpressure in the sigma cloud. The peak values for the three cases are 0.098, 0.930, and 0.839 bar, respectively. Note that the peak pressure for case 3 is nearly 2.45 times higher than that of case 2, although the global overpressure of these two cases is similar. This means that the overpressure can reach about 0.930 bar if the flame accelerates toward sonic speed in the sigma cloud. The transient pressure loading can be used to evaluate the response of the containment structures to assess its impact on the integrity of the containment.
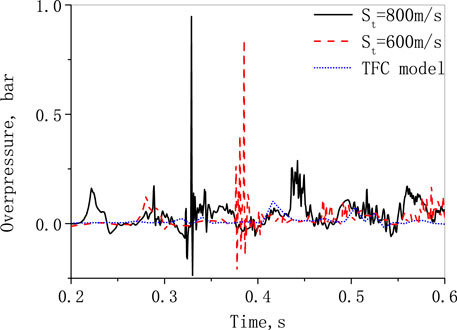
FIGURE 12. Pressure difference between the two sides of the PZR compt. ceiling.
Figure 13 shows the maximum surface temperature on the containment structures for each time. The peak values for the two CREBCOM cases are 8 and 15 K higher than that of the TFC model, respectively. The peak temperature is not necessarily proportional to the flame speed, comparing the two CREBCOM cases. This may be caused by the thermal inertia of the structures. The combustion duration of the case of
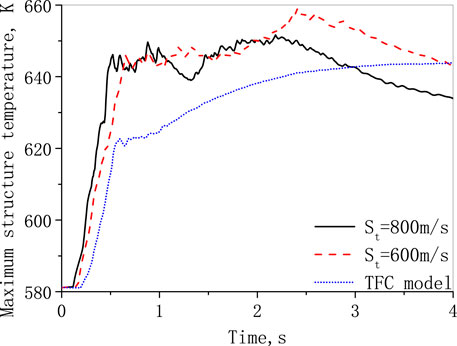
FIGURE 13. Maximum temperature on the containment structure surface.
The results show that the CREBCOM model with isobaric sound flame speed can provide both conservative pressure and thermal load for the combustion consequence analysis compared to the TFC model. While it is not necessary to imply that the model is universally applicable for combustion analysis in the containment, based on the main assumption, the sonic speed assumption should only be applied for the situation where a sonic deflagration cannot be safely excluded. This indicates two restrictions: the first one is FA risk, which is measured with the sigma criterion. The second one is that the flame can be accelerated toward sonic speed, which is difficult to be analyzed quantitatively. The flame needs a certain length in order to accelerate toward sonic speed; however, there is no criterion associated with the geometry scaling that can determine the FA rate. Based on current knowledge (Breitung et al., 2000), conclusions can be drawn qualitatively that large overpressure is likely to occur at a confined space with obstacles, rather than with large free volume where the flame can be well propagated in the situation of the hydrogen safety analysis for large dry containment of PWRs. Because the gas mixture in the containment is with lean hydrogen and high concentration of steam, and the DDT risk is rule out during the containment design procedure under this situation. For the containment analysis, this means that it is likely to occur at a local compartment where hydrogen cannot be well dispersed rather than the large free volume beneath the containment dome. Therefore, the CREBCOM model is applicable for the FA risk analysis in the local compartment for nuclear containments and manages to obtain a conservative pressure and thermal load for further evaluation on the containment integrity.
In this study, the CREBCOM model is introduced, validated, and adopted to evaluate the combustion consequences for local compartments. The main works and conclusions are listed as follows:
1. The CREBCOM model is implemented in the GASFLOW-MPI and validated with the RUT test sth6. The result shows that the CREBCOM model can provide a reliable prediction for choking regime combustion.
2. The combustion analysis is conducted with two combustion models and three cases. Detailed combustion characteristics are compared and discussed. The results show that the CREBCOM model can provide both conservative pressure and thermal load for the containment.
Based on this study, the CREBCOM model with the sonic flame assumption is applicable for the FA risk analysis in the local compartment for nuclear containments where a sonic deflagration cannot be safely excluded and manages to obtain a conservative pressure and thermal load for further evaluation on the containment integrity.
The original contributions presented in the study are included in the article/Supplementary Material, further inquiries can be directed to the corresponding author.
LY: investigation, formal analysis, and writing–original and draft, review, and editing. LX: methodology, investigation, and writing–review and editing. CP: conceptualization, methodology and supervision. XD: boundary condition preparation.
The remaining authors declare that the research was conducted in the absence of any commercial or financial relationships that could be construed as a potential conflict of interest.
The authors LY, LX, CP, XD employed by China Nuclear Power Technology Research Institute Co., Ltd.
All claims expressed in this article are solely those of the authors and do not necessarily represent those of their affiliated organizations, or those of the publisher, the editors and the reviewers. Any product that may be evaluated in this article, or claim that may be made by its manufacturer, is not guaranteed or endorsed by the publisher.
ACC, accumulator; CREBCOM, criteria and experimentally based combustion; DES, detached eddy simulation; PAR, passive automatic recombination; TFC, turbulent flame closure; AICC, adiabatic isochoric complete combustion; DDT, deflagration–detonation–transient; FA, flame acceleration; PZR, pressurizer; SG, steam generator.
Bentaib, A., Meynet, N., and Bleyer, A. (2015). Overview on Hydrogen Risk Research and Development Activities: Methodology and Open Issues. Nucl. Eng. Tech. 47, 26–32. doi:10.1016/j.net.2014.12.001
Breitung, W., Chan, C., and Dorofeev, S. (2000). State-of-the-Art Report on Flame Acceleration and Deflagration-To-Detonation Transition in Nuclear Safety. OECD Nuclear Energy Agency. NEA/CSNI/R.
Dimmelmeier, H., Eyink, J., and Movahed, M.-A. (2012). Computational Validation of the EPR Combustible Gas Control System. Nucl. Eng. Des. 249, 118–124. doi:10.1016/j.nucengdes.2011.08.053
Dorofeev, S. B., Sidorov, V. P., Kuznetsov, M. S., Matsukov, I. D., and Alekseev, V. I. (2000). Effect of Scale on the Onset of Detonations. Shock Waves 10 (2), 137–149. doi:10.1007/s001930050187
Efimenko, A. A., and Dorofeev, S. B. (2001). CREBCOM Code System for Description of Gaseous Combustion. J. Loss Prev. Process Industries 14, 575–581. doi:10.1016/s0950-4230(01)00049-3
Goulier, J., Chaumeix, N., Halter, F., Meynet, N., and Bentaïb, A. (2017). Experimental Study of Laminar and Turbulent Flame Speed of a Spherical Flame in a Fan-Stirred Closed Vessel for Hydrogen Safety Application. Nucl. Eng. Des. 312, 214–227. doi:10.1016/j.nucengdes.2016.07.007
Halouane, Y., and Dehbi, A. (2017). CFD Simulations of Premixed Hydrogen Combustion Using the Eddy Dissipation and the Turbulent Flame Closure Models. Int. J. Hydrogen Energ. 42, 21990–22004. doi:10.1016/j.ijhydene.2017.07.075
IAEA/CSNI (2012). ISP-49 on Hydrogen Combustion. Nuclear Energy Agency. Nuclear Energy Agency Committee on the Safety of Nuclear Installations.
Kang, H. S., Kim, J., Hong, S. W., and Kim, S. B. (2020). Numerical Analysis for Hydrogen Flame Acceleration during a Severe Accident in the APR1400 Containment Using a Multi-Dimensional Hydrogen Analysis System. Energies 13, 6151. doi:10.3390/en13226151
Kumar, R. K., Tamm, H., and Harrison, W. C. (1983). Combustion of Hydrogen-Steam-Air Mixtures Near Lower Flammability Limits. Combustion Sci. Tech. 33, 167–178. doi:10.1080/00102208308923673
NEA (2007). International Standard Problem ISP-47 on Containment Thermalhydraulics, Final Report. Nuclear Energy Agency. NEA/CSNI/R, 10.
NEA (2014). Status Report on Hydrogen Management and Related Computer Codes. Nuclear Energy Agency, 8. NEA/CSNI/R.
Nrc, C. F. R. (2020). CFR 50.44 Combustible Gas Control for Nuclear Power Plant. Nuclear Regulatory Commission. CFR-2020-title10-vol1.
Qiang, G., and Yaodong, C. (2012). Hydrogen Concentration Distribution Simulation during Severe Accident in Pressurizer Relief Tank Compartment of NPP Containment. At Energ. Sci Technol 4, 32–36.
Royl, P., Lee, U. J., Travis, J. R., Breitung, W., and Karlsruhe, D. (2006). “Benchmarking of the 3D CFD Code GASFLOW II with Containment thermal Hydraulic Tests from HDR and Thai,” in CFD4NRS Conference, München, September 5–7, 685–702.
Sathiah, P., Komen, E., and Roekaerts, D. (2012). The Role of CFD Combustion Modeling in Hydrogen Safety Management-Part I: Validation Based on Small Scale Experiments. Nucl. Eng. Des. 248, 93–107. doi:10.1016/j.nucengdes.2012.03.047
Studer, E., Beccantini, A., and Kudriakov, S. (2013). “Hydrogen Combus.Tion Modelling in Large Scale Geometries,” in Proceedings of the 21st ICONE, Chengdu, China, July 29–August 2.
Wang, D., and Cao, X. (2017). Numerical Analysis of Different Break Direction Effect on Hydrogen Behavior in Containment during a Hypothetical LOCA. Ann. Nucl. Energ. 110, 856–864. doi:10.1016/j.anucene.2017.06.054
Xiao, J., Travis, J. R., and Jordan, T. (2016). GASFLOW-MPI: A Scalable Computational Fluid Dynamics Code for Gases, Aerosols and Combustion Band 1, 1. Karlsruhe: KIT Scientific Publishing.
Xiao, J., Breitung, W., Kuznetsov, M., and Zhang, H. (2017). “Numerical Investigations of Turbulent Slow Deflagration of Premixed H2-Air-H2o Mixture in Thai Test HD-22 Using CFD Code GASFLOW-MPI,” in The 17th International Topical Meeting on Nuclear Reactor Thermal Hydraulics (NURETH-17), September 3–8, 2017. Xi’an: Qujiang Int’l Conference Center.
Xiao, J., Breitung, W., Kuznetsov, M., Zhang, H., Travis, J. R., Redlinger, R., et al. (2017). GASFLOW-MPI: A New 3-D Parallel All-SpeedCFD Code for Turbulent Dispersion and Combustion Simulations Part II: First Analysis of the Hydrogen Explosion in Fukushima Daiichi Unit 1. Int. J. Hydrogen Energ. 42, 8369–8381. doi:10.1016/j.ijhydene.2017.01.219
Xiao, J., Royl, P., and Travis, J. (2016). GASFLOW-MPI:A Scalable Computational Fluid Dynamics Code for Gases, Aerosols and Combustion in Users’ Manual (Revision 1.0) (Karlsrhule: KIT Scientific Publishing), Vol. 2. doi:10.5445/KSP/1000050393
Yabez, J., Kuznetsov, M., and Souto-Iglesias, A. (2015). An Analysis of the Hydrogen Explosion in the Fukushima-Daiichi Accident. Int. J. Hydrogen Energ. 40, 8261–8280.
Yuen, A. C. Y., De Cachinho Cordeiro, I. M., Chen, T. B. Y., Chen, Q., Liu, H., and Yeoh, G. H. (2022). Multiphase CFD Modelling for Enclosure Fires-A Review on Past Studies and Future Perspectives. Exp. Comput. Multiph. Flow 4, 1–25. doi:10.1007/s42757-021-0116-4
Zhang, H., Li, Y., Xiao, J., and Jordan, T. (2018). Detached Eddy Simulation of Hydrogen Turbulent Dispersion in Nuclear Containment Compartment Using GASFLOW-MPI. Int. J. Hydrogen Energ. 43, 13659–13675. doi:10.1016/j.ijhydene.2018.05.077
Zhao, H., Luo, X., and Zhang, R. (2022). Analysis on Hydrogen Risk under LOCA in marine Nuclear Reactor. Exp. Comput. Multiphase Flow 4, 39. doi:10.1007/s42757-020-0077-2
Zhao, Y. (2017). Investigation on the Mechanism of Flame Acceleration and Deflagration to Detonation Transition of Combustible Gases. Doctor Thesis. Beijing Institute of Technology.
Keywords: local hydrogen risk, fast deflagration, CREBCOM model, containment safety analysis, CFD
Citation: Yabing L, Xianghui L, Peng C and Deyang X (2022) A Conservative Approach for the Fast Deflagration Analysis in the Containment With GASFLOW-MPI. Front. Energy Res. 10:864950. doi: 10.3389/fenrg.2022.864950
Received: 29 January 2022; Accepted: 22 February 2022;
Published: 14 April 2022.
Edited by:
Yapei Zhang, Xi’an Jiaotong University, ChinaReviewed by:
Jianjun Xiao, Karlsruhe Institute of Technology (KIT), GermanyCopyright © 2022 Yabing, Xianghui, Peng and Deyang. This is an open-access article distributed under the terms of the Creative Commons Attribution License (CC BY). The use, distribution or reproduction in other forums is permitted, provided the original author(s) and the copyright owner(s) are credited and that the original publication in this journal is cited, in accordance with accepted academic practice. No use, distribution or reproduction is permitted which does not comply with these terms.
*Correspondence: Li Yabing, bGl5YWJpbmcyQGNnbnBjLmNvbQ==
Disclaimer: All claims expressed in this article are solely those of the authors and do not necessarily represent those of their affiliated organizations, or those of the publisher, the editors and the reviewers. Any product that may be evaluated in this article or claim that may be made by its manufacturer is not guaranteed or endorsed by the publisher.
Research integrity at Frontiers
Learn more about the work of our research integrity team to safeguard the quality of each article we publish.