 Qi Dong1,2*
 Kun Zhao
- 1Oil and Gas Technology Research Institute ChangQing Oilfield Company, Xi’an, China
- 2State Engineering Laboratory for Exploration and Development of Low Permeability Oil and Gas Fields, Xi’an, China
- 3Key Laboratory of Unconventional Oil and Gas Development, Ministry of Education, Qingdao, China
- 4School of Petroleum Engineering, China University of Petroleum, Qingdao, China
Refracturing is an important method to improve the productivity of low-yield and low-efficiency horizontal wells. Due to the influence of geological factors and primary fracturing, it is of great importance to select suitable candidate wells and determine reasonable refracturing timing. Considering that production and pressure are the first-hand data available in the fields, they can be used to evaluate the dynamic drainage volume of fractured horizontal wells and to predict refracturing timing combined with fracturing parameters. In this study, the stimulation potential of refracturing is evaluated by introducing the dynamic drainage volume, and the refracturing timing discrimination model is established. Based on this model, the refracturing timing charts of different initial fracturing scales are drawn. In addition, the reservoir numerical simulation method is used to optimize the method of horizontal well refracturing. The results show that it is advisable to repeat fracturing when the change rate of dynamic drainage volume growth rate is less than 10%. The refracturing methods of restoring the conductivity of fractures or sealing the original fractures and refracturing the new fractures have good development effects. The research is of great significance to the design of horizontal well refracturing.
Introduction
Horizontal well refracturing is one of the major technologies in unconventional oil and gas development, which can achieve greater utilization of single well reserves and further enhance recovery (Brown and Economides, 1992; Dou and Zhou, 2003). Due to the failure of fracture initiation, sand filling failure and other problems in the production of primary fractured horizontal Wells, fractures may lose their conductivity. Therefore, refracturing is required to restore or improve the production capacity of horizontal wells (Giger, 1985; Vincent, 2011; Ren et al., 2015; Wan et al., 2019). At present, a large number of wells in the early development stage have been refractured (Siebrits et al., 2000; French et al., 2014; Fu et al., 2017; Athavale et al., 2019; Garza et al., 2019), and considerable results have been achieved. The research on related technology types and operation schemes have gradually attracted the attention of scholars and experts around the wold. A large number of studies have been carried out at home and abroad on repeated fracturing well selection methods, production increase potential, and production increase measures (Yang et al., 2016; Aniemena and Kohshour, 2017; Xia et al., 2017; Wang, 2018; Ibáñez et al., 2020; Kong et al., 2020; Lu et al., 2020; Kong et al., 2021; Zhang and Sun, 2021), However, relatively few studies have been conducted on the refracturing timing and the modification method of refracturing. At the same time, many scholars have carried out research on reservoir capacity characterization and dynamic prediction (Lee et al., 2003; Williams et al., 2004; Blasingame and Rushing, 2005; Cheng et al., 2009), There are mainly four methods:type-curve analysis,flow-regime analysis, numerical simulation and empir-ical methods. Despite the diversity of models, they always require knowledge of the reservoir that may not be known, originally, such as the shape of the drainage volume.Moghanloo and Yuan (Moghanloo et al., 2015) put forward the concept of dynamic drainage volume (DDV) for the first time. Although the model is not suitable for any reservoir, such as a fractured reservoir, but the data required by the model is easy to obtain. DDV refers to a continuously expanding oil drainage volume formed when the pressure fluctuation begins to spread in the whole reservoir when the production well is produced. With the progress of production, the boundary of DDV expands outward. Using DDV to evaluate the productivity of fractured horizontal wells does not need any prior knowledge of complex reservoir characteristics, and considering the advantages of dynamic change process. Therefore, the results are more in line with reality (Yuan et al., 2016; Zheng et al., 2017).
Based on the material balance theory, we deduce the calculation formulas of the DDV of horizontal wells. Using the diffusion law of DDV, the stimulation potential of wells is calculated, and the relationship between stimulation potential and refracturing timing is established. Moreover, the charts of refracturing timing with different initial pressure scales are drawn. Finally, the reconstruction mode of horizontal well refracturing is optimized by numerical simulation.
DDV Model of Depleted Horizontal Wells
When the horizontal wells are exhausted in the initial stage of production, it depends on the natural energy of the reservoir for production. The oil drainage volume in the reservoir reconstruction area directly reflects the productivity of the horizontal wells. Therefore, based on the material balance equation, the equations of DDV is established, the DDV is evaluated by using the pressure and production data, and the relationship between the refracturing timing and scale is established.
Material Balance Equations
Assuming that the oil-water two-phase flow in the reservoir is quasi-steady state with constant temperature, and the fluid and rock in the reservoir are slightly compressible, the material balance equation is
where
where
Eq. 3 ×
where:
Eq. 5 can be simplified as
According to Eq. 7
Integrate the Eq. 8 to obtain
where
DDV calculation of Oil
With the continuous exploitation of oil and gas reservoir, the reservoir pressure continues to spread outward, and the boundary of DDV continues to expand. This problem can be regarded as a dynamic boundary problem. It is considered that under the limitation of pressure range, the oil drain volume changes continuously and finally tends to the extreme value. The DDV of oil is defined as
Where
Calculation Process
Firstly, the average pressure of the studied reservoir is estimated to obtain the values of
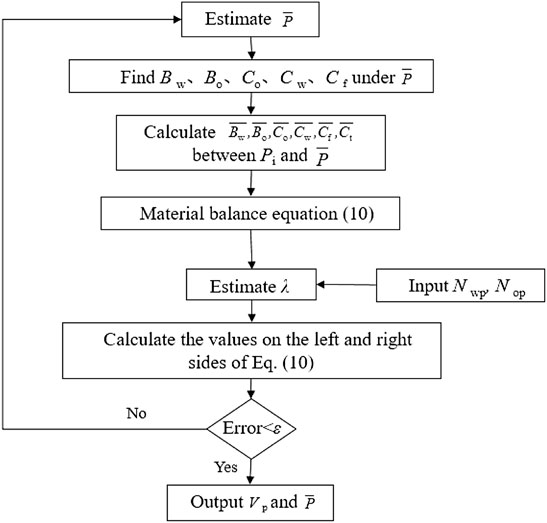
FIGURE 1. Dynamic drainage volume calculation flow chart.
Determination Method of Refracturing Timing Based on DDV
Because it is difficult to obtain a large number of production data of fractured horizontal wells, this paper set different fracture parameters and established the numerical simulation model of multi-stage fractured horizontal wells under depletion development mode. Based on the reservoir physical parameters and production data under different initial pressure modes, the variation law of DDV is obtained by using the numerical simulation model. The relationship between initial pressure scale and refracturing timing is also analyzed. The numerical simulation model of a typical ultra-low permeability reservoir in Changqing Oilfield is established: the number of grids is 81 × 131×3. The grid unit size is 20 m, the average porosity is 11%, and the average permeability is 0.5 × 10⁻³ μm2. The fluid physical parameters are listed in Table 1, the relative permeability curve is shown in Figure 2 and the initial fracturing parameters are listed in Table 2.
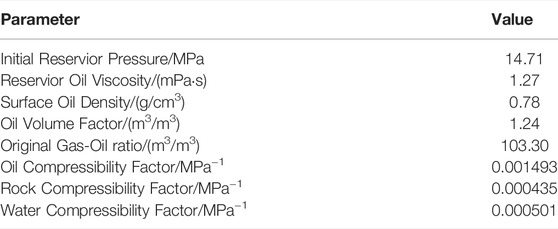
TABLE 1. Parameters of depleted development liquid model.
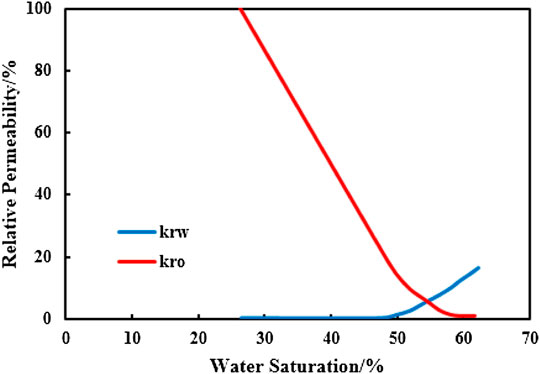
FIGURE 2. Relative permeability curve of depleted development model.
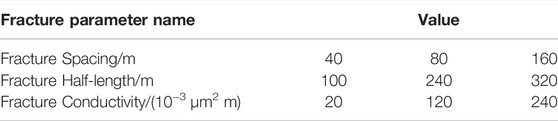
TABLE 2. Initial fracturing parameters of depleted development well.
There are 27 fracturing parameter combinations in Table 2, which are shown in Table 3.
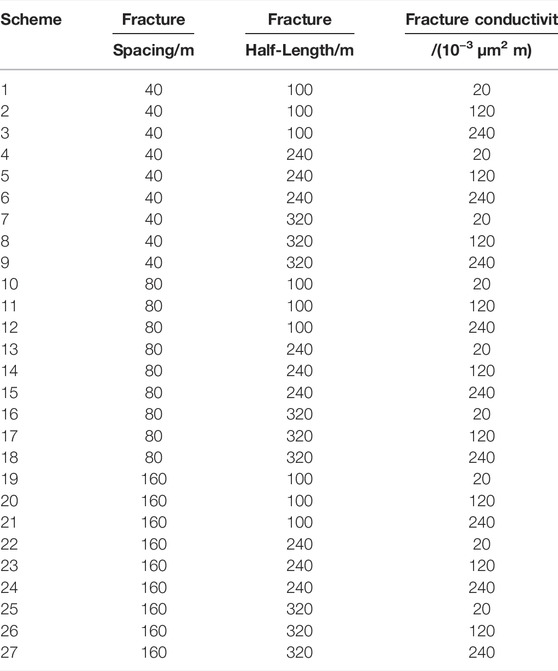
TABLE 3. Initial fracturing scheme of depleted development.
The cumulative oil production and cumulative water production under different development modes are calculated and brought into the material balance equation. The production is normalized by considering the physical properties of the reservoir, and finally the variation value of the DDV with time is obtained. Figure 3 shows the variation of DDV with time when the interval of fracturing section is 40 m, the half length of fracture is 100 m, and the conductivity of initial fracturing fracture is 20 × 10–3 μm2 m. Figure 4 shows the change rate of DDV growth rate. The trend of drainage pore volume shows an asymptotic features, which is consistent with the previous studies (Yin et al., 2015).Due to the limitation of reservoir pressure, the DDV finally tends to a limit value.

FIGURE 3. Dynamic drainage volume variation over time.
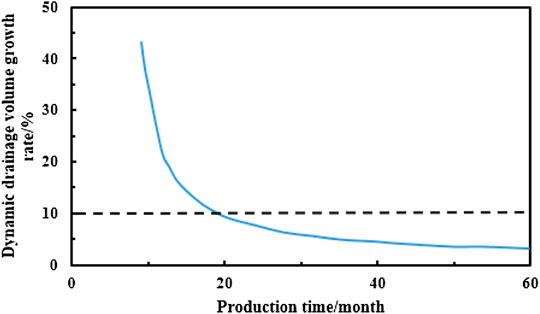
FIGURE 4. Dynamic drainage volume growth rate.
See Figure 5 for the flow chart of determining the refracturing timing by using the DDV method. According to the cumulative water production and cumulative oil production under different initial fracture distribution, the DDV change law curve with time is obtained by using Eq. 12 respectively. The curve slope is then used to calculate the growth rate and change rate of the growth rate of DDV. When the change rate of the growth rate of DDV is less than 10%, the dynamic drainage boundary propagates slowly, the reservoir is in the development state of low production and low efficiency, and the output of the initially fractured oil well has not reached the expected effect. However, at this time, a large amount of residual oil still exists in the reservoir and between fractures. The horizontal well needs to be refractured to restore the oil well productivity. Through this method, we can obtain the refracturing timing of different initial fracturing scales under 27 groups of schemes, as shown in Figure 6.
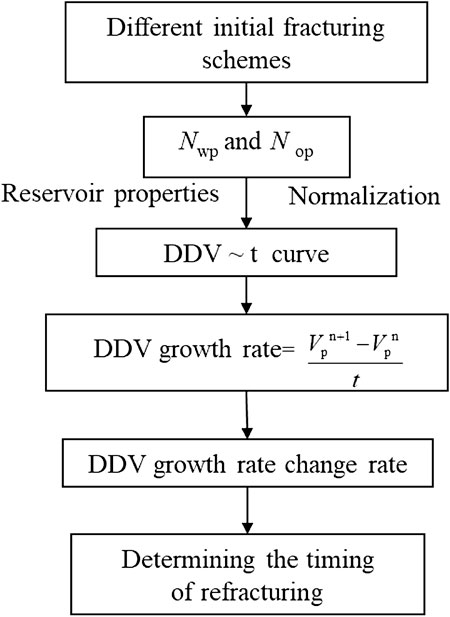
FIGURE 5. Flow chart of determining refracturing timing by dynamic drainage volume method.
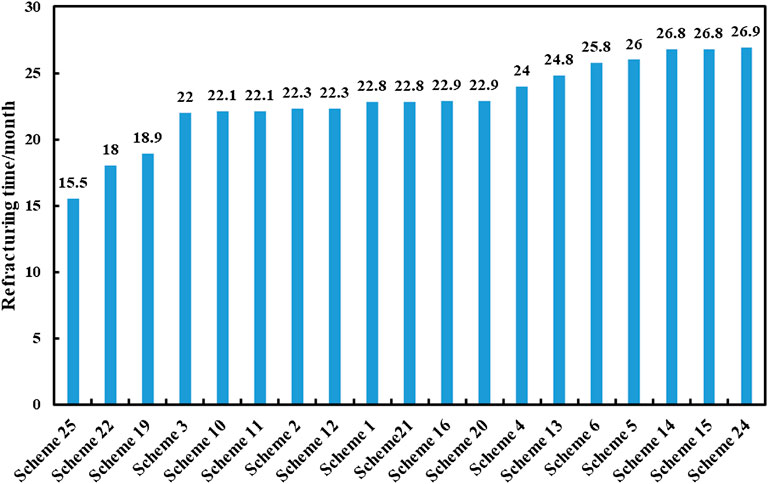
FIGURE 6. Refracturing timing sequence under different initial fracturing modes.
The refracturing timing under different initial pressure scales is classified, and the chart shown in Figure 7. The horizontal axis represents the interval and the vertical axis represents the half length of the fracture. There are 9 grids in the chart and each grid is divided into 3 layers according to the fracture conductivity. The fracture conductivity from bottom to top is 20 × 10–3 μm2·m, 120 × 10–3 μm2·m and 240 × 10–3 μm2·m, the chart is divided into 27 grids, representing 27 different schemes. We divided the grids into four categories: Class I is horizontal wells with poor initial development effect, which are production wells with low conductivity and large interval. It is recommended to carry out repeated fracturing in the first 20 months of the initial stage of production; Class II and III are horizontal wells with good development effect at the initial stage of production and low production after a period of time due to insufficient fracture length. It is recommended to extend the fracture length by half; Class IV is horizontal wells with good fracture length and conductivity and less influence of interval spacing. It is recommended to carry out refracturing finally. In conclusion, it is suggested that the sequence of refracturing for horizontal wells with different initial pressure scales should be followed: first, refracturing for horizontal wells of class I to restore the conductivity of fractures and add new fractures; Secondly, horizontal wells of class II and III are refractured to prolong the fracture length and restore the fracture conductivity; Finally, horizontal wells of class IV are refractured.
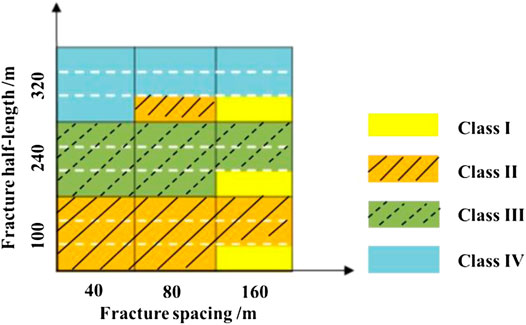
FIGURE 7. Chart of refracturing timing at different primary fracturing scales.
Study on Optimization of Horizontal Refracturing Reconstruction Mode
In the process of reservoir reconstruction, two types of refracturing are usually used: original fracture refracturing and new fracture refracturing. The main ways of refracturing the original fracture are: prolonging the old fracture, turning the old fracture and restoring the conductivity of the original fracture. There are mainly two ways to refracture new fractures: retaining the original fracture and sealing the original fracture. Choosing different refracturing reconstruction methods will lead to great changes in the seepage law and stimulation mechanism of horizontal wells after refracturing.
Reconstruction of Fractured Horizontal Well With original Fracture Refracturing
Restore the Original Fracture Conductivity
By restoring the conductivity of the failed fracture, the horizontal well can obtain higher productivity. Due to the crushing and migration of proppant, the fracture conductivity changes from time to time and decreases rapidly in the initial production stage. In view of this situation, it is recommended to use high-strength proppant during refracturing, as shown in Figure 8. The fracture conductivity before refracturing is 25 × 10–3 μm2 m, the recovery conductivity after refracturing is 300 × 10–3 μm2 m. Through the established numerical simulation model, the interval between segments is 80 m and the half length of fractures is 120 m.
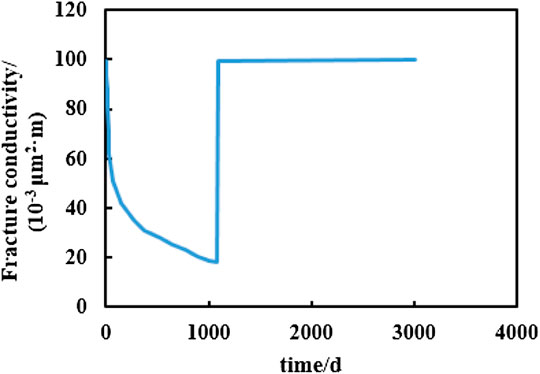
FIGURE 8. Variation diagram of conductivity of recovery fracture.
In the simulation process, the horizontal well is normally produced for three years under the original fracture conditions, and refractureing production is carried out for ten years. Figure 9 shows the comparison of pressure and remaining oil distribution before and after restoring conductivity of failed fractures. By comparing and analyzing the simulation results, it can be seen that in the initial stage of development, the fracture conductivity is reduced due to fracture failure, and the pressure propagation near the horizontal well is difficult. The distribution of reservoir pressure directly affects the failure development effect of the horizontal well. After refracturing, the fracture conductivity is restored and the “pollution” in the fracture is relieved. The pressure can diffuse to the far well zone along the fracture, thus improve the effective production degree of low-permeability reservoir in the far well zone, and expand the DDV of horizontal wells.
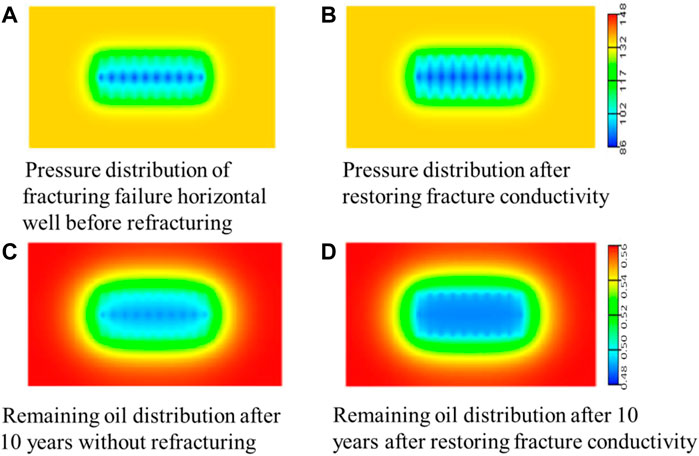
FIGURE 9. Pressure distribution before and after recovery of fracture conductivity. (A) Pressure distribution of fracturing failure horizontal well before refracturing. (B) Pressure distribution after restoring conductivity. (C) Remaining oil distribution after 10 years without refracturing. (D) Remaining oil distribution after 10 years after restoring conductivity.
Increase the Original Fracture Length
Based on the basic model of numerical simulation, See Table 4 for parameter values of cracks. In the simulation process, similarily, the horizontal well is normally produced for three years under the original fracture conditions, and refractureing production is carried out for ten years. Figure 10 shows the comparison of pressure and residual oil distribution before and after increasing the original fracture length. From the simulation results, it can be seen that the depleted development production depends on the reconstrution of the reservoir. Extending the original fracture length expands the fracturing scale of the horizontal well, increases the effective reconstruction volume of the reservoir, expands the spread range of the pressure wave, and significantly increases the oil drainage volume of the horizontal well. Therefore, the far well reservoir fluid can flow into the wellbore and improve the production of the horizontal well.
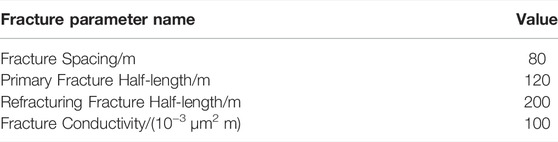
TABLE 4. Increase the original fracture length Fracture parameter table.
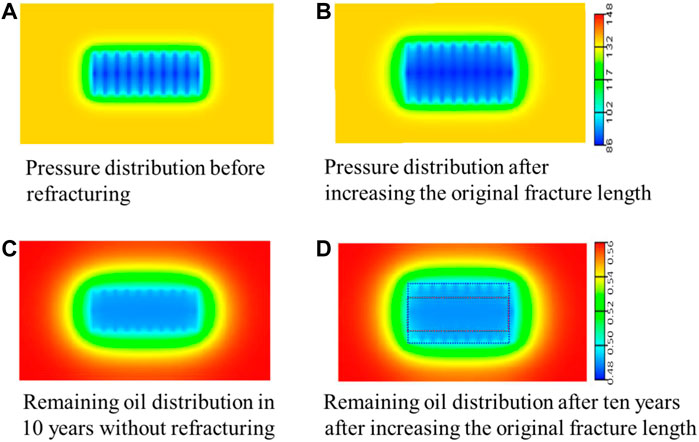
FIGURE 10. Pressure distribution before and after increasing original fracture length and remaining oil distribution in 10 years of production. (A) Pressure distribution before refracturing (B) Pressure distribution after increasing the orginally fracture length. (C) Remaining oil distribution in 10 years without refracturing. (D) Remaining oil distribution after ten years after increasing the orginally fracture length.
Reorientation of Original Fractures
With the process of depletion development, the in-situ stress field near the hydraulic fracture of initial fracturing will change, and the tensile stress parallel to the original fracture will be less than the vertical tensile stress. When the stress difference caused by pore pressure is greater than the initial maximum and minimum horizontal stress difference, the maximum stress direction of the original stress field will change to the minimum stress direction. After that, the refracturing measures are implemented to add new fractures. Under the action of the stress field, the fractures will turn in the stress shadow area near the horizontal well, and then the fracture direction will be parallel to the original fractures and continue to expand to form new fractures, as shown in Figure 11.
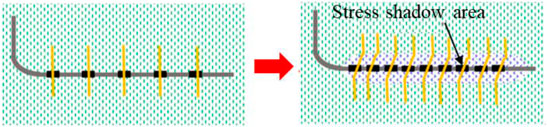
FIGURE 11. Diagram of fracture diversion in horizontal well refracturing.
Using the reservoir numerical simulation method, ignoring the actual complex fracture network and the complex variation law of in-situ stress deflection area. The refracturing measures are implemented after three years of production, and the original fracture deflects 45° near the well zone. Figure 12 shows the residual oil and pressure distribution before and after fracture reorientation. After three years of production, the in-situ stress field of the reservoir changes, and the fracture continues to expand along the direction of the maximum principal stress after turning. Therefore, refracturing effectively expands the propagation range of pressure wave. At the same time, the fracture reorientation increases the contact area between the fracture and the reservoir. The steering fracture can extend to the far well area, which can expand the spread range of the fracture and significantly increase the oil drainage volume of the horizontal well.
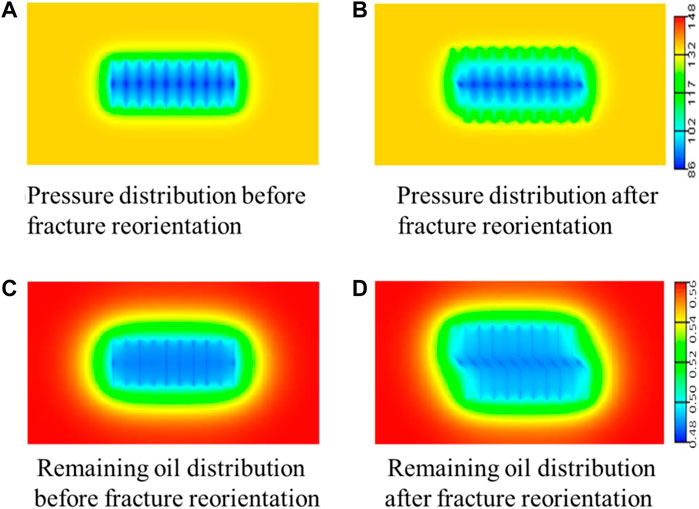
FIGURE 12. Pressure distribution and remaining oil distribution before and after fracture turning. (A) Pressure distribution before fracture reorientation. (B) Pressure distribution after fracture reorientation. (C) Remaining oil distribution before fracture reorientation. (D) Remaining oil distribution after fracture reorientation.
According to the numerical simulation test scheme designed above, the model adopts constant bottom hole flow pressure production. Figure 13 shows the change results of cumulative oil increase in ten years of refracturing production in the test scheme. By analyzing the variation law of cumulative oil increment in depleted development horizontal wells, it can be concluded that the influence of refracturing ways on their effect is as follows. The growth of fracture half length and fracture reorientation effectively increase the scope of reservoir reconstruction, so as to increase the oil drainage volume of horizontal wells and obtain better refracturing effect. Restoring the conductivity of the original fracture dredges the seepage channel of crude oil in the reservoir. The crude oil in the fracture is easier to flow to the wellbore and increases the oil production. The fracture conductivity has a greater impact on the re fracturing effect than the half length and steering of the fracture.
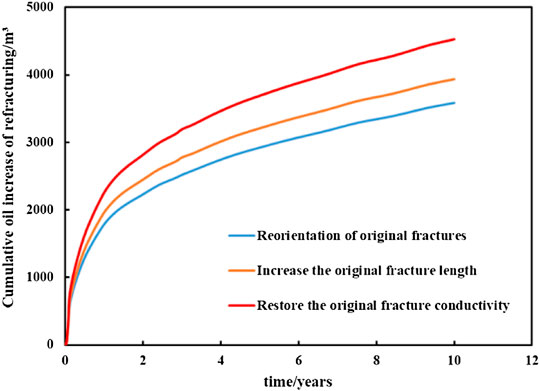
FIGURE 13. Change of cumulative oil increment in ten years of test scheme.
Reconstruction of Fractured Horizontal Well With Refracturing New Fractures
Using the numerical simulation method, the initial fracture half length is set as 120 m and the fracture conductivity is 100 × 10–3 μm m, the interval before refracturing is 160 m, and that after refracturing new fractures is 80 m. The horizontal well normally produces for three years under the condition of original fractures, and then refracturing is implemented. Figure 14 shows the comparison of pressure distribution and remaining oil distribution of different refracturing methods. Figure 15 shows the results of ten-year cumulative oil increase under two refracturing modes.
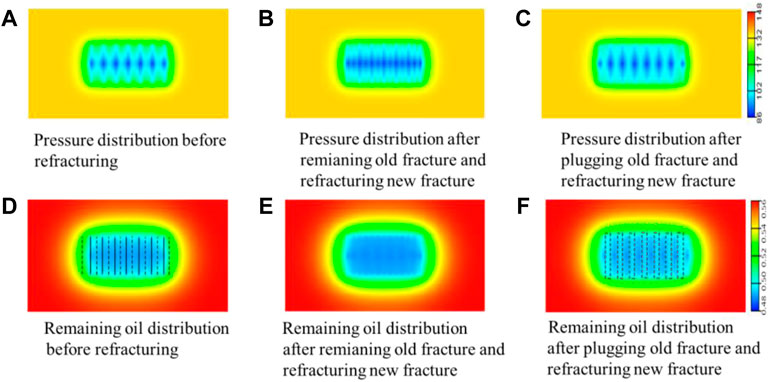
FIGURE 14. Distribution diagram of pressure and remaining oil under different refracturing modes. (A) Pressure distribution refracturing before (B) Pressure distribution after remaining gold fracture and refracturing new fracture (C) Pressure distribution after plugging old fracture and refracturing new fracture (D) Remaining oil distribution before refracturing (E) Remaining oil distribution after remaining old fracture and refracturing new fracture (F) Remaining oil distribution after plugging old fracture and refracturing new fracture
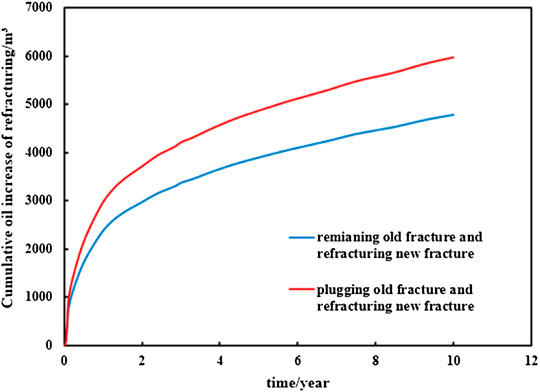
FIGURE 15. Variation diagram of ten-year cumulative oil increase under compound pressure under different transformation modes.
By analyzing the variation law of seepage field and production, it is found that after refracturing, new fractures are added, fracture spacing is reduced, crude oil seepage resistance is reduced, pressure sweep range is expanded, and crude oil flow channel is increased. Therefore the crude oil production is improved. Moreover, sealing the original fracture and refracturing the new fracture changes the pressure distribution between the fractures, reduces the crude oil seepage resistance, and effectively initates the remaining oil around the original fracture. Compared with retaining the original fracture and refracturing the new fracture, it can obtain better development effect.
Field Application
One horizontal well in a typical ultra-low permeability reservoir in Changqing Oilfield was put into operation in October 2012. After 6 years of initial fracturing production, it was refractured, 19 old fractures were blocked, and 23 new fractures were refractured between the old fractures. After the measures, the daily oil production is 15.9 t and the daily oil increase is 13.3 t, as shown in Figure 16. At present, it has been produced for nearly one year, with a daily oil production of 14.29 t, a daily oil increase of 11.61 t, a cumulative oil increase of 3442 t and a cumulative oil production of 4407 t.
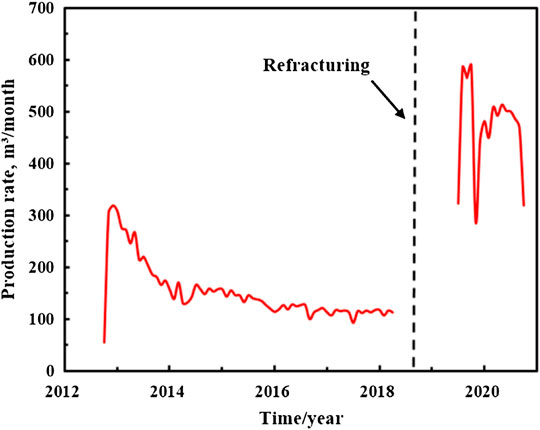
FIGURE 16. Production variation law of a well before and after refracturing.
Conclusion
In this paper, by introducing the calculation method and process of DDV, the discrimination model of refracturing timing is established. The refracturing timing chart under different initial pressure scale is formed, and the different reconstruction methods of refracturing are optimized and designed by numerical simulation method. The results show that.
1) With the depletion of the reservoir, the reservoir pressure continues to spread outward, and the boundary of the reservoir drainage volume continues to expand. However, the drainage volume finally tends to the extreme value under the limitation of the pressure range. The increase rate of DDV of horizontal wells shows a trend of first fast and then slow. When the change rate of growth rate is less than 10%, it can not meet the expected production requirements and needs to be refractured.
2) Considering the horizontal fracture distribution of horizontal wells, it is suggested that the sequence of refracturing of horizontal wells with different initial pressure scales is as follows: firstly, refracturing is carried out for horizontal wells with few fractures, poor fracture conductivity and poor initial development effect, so as to restore the fracture conductivity and infill new fractures; Secondly, the horizontal wells with insufficient fracture half length and poor development effect are refractured to prolong the fracture length and restore the fracture conductivity, so as to increase the reservoir reconstruction volume and obtain better development effect.
3) Through the implementation of refracturing reconstruction measures, the reconstruction effect of original fracture refracturing is as follows: restore the original fracture conductivity > increase the original fracture length > turn the original fracture. The development effect of plugging the original fractures and refracturing the new fractures is better than that of retaining the original fracturing and refracturing the new fracturing.
Data Availability Statement
The original contributions presented in the study are included in the article/Supplementary Material, further inquiries can be directed to the corresponding author.
Author Contributions
QD: Conceptualization, Methodology, Formal Analysis, Writing—Original Draft; JL: Data Curation, Writing—Original Draft; LY: Visualization, Investigation; FW: Resources, Supervision; KZ: Visualization; FH:Writing—Review and Editing.
Funding
This study was supported by the National major special project “tackling key problems and field test of tight oil and gas multi-layer and multi-stage fracturing technology in Changqing Oilfield” (2020CGCGZ004).
Conflict of Interest
QD, JL, LY, and FW were employed by the company Oil &and Gas Technology Research Institute ChangQing Oilfield Company.
The remaining authors declare that the research was conducted in the absence of any commercial or financial relationships that could be construed as a potential conflict of interest.
Publisher’s Note
All claims expressed in this article are solely those of the authors and do not necessarily represent those of their affiliated organizations, or those of the publisher, the editors and the reviewers. Any product that may be evaluated in this article, or claim that may be made by its manufacturer, is not guaranteed or endorsed by the publisher.
References
Aniemena, C., and Kohshour, I. O. (2017). “A Fast Semi-analytical Method for Refracturing Candidate Selection and Performance Estimation of Shale Wells,” in Unconventional Resources Technology Conference, Austin, Texas, USA, 24-26 July 2017. paper 2693452-MS presented at the. doi:10.15530/URTEC-2017-2693452
Athavale, A., Onafowokan, A., Kasdano, C., Lakshminarayanan, S., and Sousa, L. (2019). “Refracturing Technology Restores Profitability of Older Unconventional Wells in Southeast New Mexico,” in SPE Hydraulic Fracturing Technology Conference and Exhibition (Woodlands, TX: OnePetro). doi:10.2118/194372-MS
Blasingame, T. A., and Rushing, J. A. (2005). “A Production-Based Method for Direct Estimation of Gas in Place and Reserves,” in SPE Eastern Regional Meeting. doi:10.2118/98042-MS
Brown, J. E., and Economides, M. J. (1992). “An Analysis of Horizontally Fractured Horizontal Wells,” in SPE Rocky Mountain Regional Meeting, Casper,Wyoming, 18-21 May 1992. paper 24322-MS presented at the. doi:10.2118/24322-MS
Cheng, Y., Lee, W. J., and McVay, D. A. (2009). A New Approach for Reliable Estimation of Hydraulic Fracture Properties Using Elliptical Flow Data in Tight Gas Wells. SPE Reserv. Eval. Eng. 12 (02), 254–262. doi:10.2118/105767-PA
Dou, S., and Zhou, J. (2003). Remainined Oil Distribution in Complicated Faulted Blocks and its Accessory Potential Exploitation Measures. Petroleum Explor. Dev. 30 (5), 90–93. doi:10.3321/j.issn:1000-0747.2003.05.027
French, S., Rodgerson, J., and Feik, C. (2014). “Re-fracturing Horizontal Shale Wells: Case History of a Woodford Shale Pilot Project,” in SPE Hydraulic Fracturing Technology Conference (Woodlands, TX: OnePetro). doi:10.2118/168607-MS
Fu, H., Liu, Y., and Xiu, N. (2017). “Large-scale Experimental Investigation of Refracture Reorientation and Field Evaluation in Sand Reservoir,” in 51st US Rock Mechanics/Geomechanics Symposium (San Francisco, CA: OnePetro).
Garza, M., Baumbach, J., Prosser, J., Pettigrew, S., and Elvig, K. (2019). “An Eagle Ford Case Study: Improving an Infill Well Completion through Optimized Refracturing Treatment of the Offset Parent Wells,” in SPE Hydraulic Fracturing Technology Conference and Exhibition (Bahrain: OnePetro). doi:10.2118/194374-MS
Giger, F. M. (1985). “Horizontal Wells Production Techniques in Heterogeneous Reservoirs,” in SPE Middle East Oil Technical Conference and Exhibition, 11-14 March 1985. paper 13710-MS presented at the. doi:10.2118/13710-MS
Ibáñez, E., Bezerra de Melo, R. C., Wang, Y., Dong, Y., Alvarellos, J., Lakshmikantha, M. R., et al. (2020). “Improved Refracturing Evaluation Workflow: An Integrated Methodology Incorporating Advanced Geomechanical Modeling,” in SPE Canada Unconventional Resources Conference (Virtual: OnePetro). doi:10.2118/199997-MS
Kong, D., Gao, Y., Sarma, H., Li, Y., Guo, H., and Zhu, W. (2021). Experimental Investigation of Immiscible Water-Alternating-Gas Injection in Ultra-high Water-Cut Stage Reservoir. Adv. Geo-Energy Res. 5 (2), 139–152. doi:10.46690/ager.2021.02.04
Kong, D., Lian, P., Zhu, W., and Li, Y. (2020). Pore-scale Investigation of Immiscible Gas-Assisted Gravity Drainage. Phys. Fluids 32 (12), 122004. doi:10.1063/5.0033027
Lee, J., Rollins, J. B., and Spivey, J. P. (2003). Pressure Transient Testing (eBooks)[M]. Houston, TX: Society of Petroleum Engineers, 9.
Lu, M., Su, Y., Zhan, S., and Almrabat, A. (2020). Modeling for Reorientation and Potential of Enhanced Oil Recovery in Refracturing. Adv. Geo-Energ. Res. 4 (1), 20–28. doi:10.26804/ager.2020.01.03
Moghanloo, R. G., Yuan, B., Ingrahama, N., Krampf, E., Arrowooda, J., and Dadmohammadi, Y. (2015). Applying Macroscopic Material Balance to Evaluate Interplay between Dynamic Drainage Volume and Well Performance in Tight Formations. J. Nat. Gas Sci. Eng. 27, 466–478. doi:10.1016/j.jngse.2015.07.047
Ren, J., Guo, J., Deng, Y., Zhang, L., and Lin, H. (2015). “Refracturing Strategy for Sevensprings Oilfield in China Based on Geological and Engineering Characteristics,” in SPE/IATMI Asia Pacific Oil & Gas Conference and Exhibition, Nusa Dua, Bali, Indonesia, 20-22 October 2015. paper 176163-MS presented at the. doi:10.2118/176163-MS
Siebrits, E., Elbel, J. L., Hoover, R. S., Diyashev, I. R., Griffin, L. G., Demetrius, S. L., et al. (2000). “Refracture Reorientation Enhances Gas Production in Barnett Shale Tight Gas Wells,” in Paper Presented at the SPE Annual Technical Conference and Exhibition (Dallas, TX: OnePetro). doi:10.2118/63030-MS
Vincent, M. (2011). Restimulation of Unconventional Reservoirs: When Are Refracs Beneficial? J. Can. Petroleum Technol. 50 (05), 36–52. doi:10.2118/136757-PA
Wan, X., Rasouli, V., and Damjanac, B. (2019). “Numerical Simulation of Integrated Hydraulic Fracturing, Production and Refracturing Treatments in the Bakken Formation,” in 53rd US Rock Mechanics/Geomechanics Symposium (New York, NY: OnePetro).
Wang, Wei. (2018). Application of Cluster Analysis in Selective Well Selection of Horizontal Well Repeated Fracturing[J]. Chem. Eng. Equip. 47 (3), 76–78.
Williams, G. J. J., Mansfield, M., MacDonald, D. G., and Bush, M. D. (2004). “Top-Down Reservoir Modelling,” in SPE annual technical conference and exhibition. doi:10.2118/89974-MS
Xia, K., Mondal, S., and Fonseca, E. (2017). “Understanding Stress Reorientation Process in Shale Gas Play and its Impact on Refracturing Time Window,” in 51st US Rock Mechanics/Geomechanics Symposium (San Francisco, CA: OnePetro).
Yang, C., Xue, X., Huang, J., Datta-Gupta, A., and King, M. J. (2016). “Rapid Refracturing Candidate Selection in Shale Reservoirs Using Drainage Volume and Instantaneous Recovery Ratio,” in SPE/AAPG/SEG Unconventional Resources Technology Conference, San Antonio, Texas, USA, 1-3 August 2016. paper 2459368-MS presented at the. doi:10.15530/URTEC-2016-2459368
Yin, J., Xie, J., Datta-Gupta, A., and Hill, A. D. (2015). Improved Characterization and Performance Prediction of Shale Gas Wells by Integrating Stimulated Reservoir Volume and Dynamic Production Data. J. Petroleum Sci. Eng. 127, 124–136. doi:10.1016/j.petrol.2015.01.030
Yuan, B., Moghanloo, R. G., and Shariff, E. (2016). Integrated Investigation of Dynamic Drainage Volume and Inflow Performance Relationship (Transient IPR) to Optimize Multistage Fractured Horizontal Wells in Tight/shale Formations[J]. J. Energy Resour. Technol. 138 (5), 052901. doi:10.1115/1.4032237
Zhang, T., and Sun, S. (2021). An Exploratory Multi-Scale Framework to Reservoir Digital Twin. Adv. Geo-Energy Res. 5 (3), 239–251. doi:10.46690/ager.2021.03.02
Keywords: horizontal well, refracturing, dynamic drainage volume, refracturing timing, increasing production potential
Citation: Dong Q, Li J, Yang L, Wang F, Zhao K and Huo F (2022) Research on Refracturing Technology of Horizontal Wells Based on Dynamic Drainage Volume. Front. Energy Res. 10:864527. doi: 10.3389/fenrg.2022.864527
Received: 28 January 2022; Accepted: 12 April 2022;
Published: 03 May 2022.
Edited by:
Qi Zhang, China University of Geosciences Wuhan, ChinaReviewed by:
Mingshan Zhang, University of Alberta, CanadaDebin Kong, University of Science and Technology Beijing, China
Shiyuan Zhan, Chengdu University of Technology, China
Copyright © 2022 Dong, Li, Yang, Wang, Zhao and Huo. This is an open-access article distributed under the terms of the Creative Commons Attribution License (CC BY). The use, distribution or reproduction in other forums is permitted, provided the original author(s) and the copyright owner(s) are credited and that the original publication in this journal is cited, in accordance with accepted academic practice. No use, distribution or reproduction is permitted which does not comply with these terms.
*Correspondence: Qi Dong, ZHFpX2NxQHBldHJvY2hpbmEuY29tLmNu