- School of Electrical Engineering and Automation, Wuhan University, Wuhan, China
Medium-voltage direct current (MVDC) systems are widely used to ship power-distributed systems, wind farms, and photovoltaic power plants. With the increase of load converters interfacing into the MVDC system, the power quality deteriorates. Few research studies focused on the factors affecting the MVDC power quality, and effects caused by multiple load converters are often neglected. In this study, the mechanism of power quality deterioration caused by interfacing multiple load converters on the MVDC system has been discussed. The impedance model of the MVDC system is developed with the state-space averaging method and the small-signal analysis method. A three-level H-bridge DC/DC converter is employed as the load converter. The results by the analysis of the impedance model show that the more the load converters connect to the MVDC system, the more fragile the MVDC system is to background harmonics. Simulation cases are implemented to verify this conclusion.
1 Introduction
In recent years, medium-voltage direct current (MVDC) systems have been gradually applied to ship power-distributed systems (Su et al., 2016; Mo and Li, 2017). The rated voltage levels of the MVDC system include 1.5, 3, 6, 12, 18, 24, and 30 kV. The power quality of the MVDC system starts to receive attention. The research on this field mainly focused on the measurement and evaluation of the power quality (Crapse et al., 2007; Ouyang and Li, 1646; Shin et al., 2004) and the way to improve it (Xie and Zhang, 2010; Puthalath and Bhuvaneswari, 2018; Arcidiacono et al., 2007). Few references discuss the factors that degrade the power quality. The reference by Steurer et al., (2007) explored the impact of the pulsed power charging loads on power quality. This study used high-precision modeling and simulation to analyze the problem without a deeper theoretical analysis. The reference by Sulligoi et al., (2017) mentioned that the multi-load converter connected to the MVDC system may lead to unstable bus voltage and deteriorate the power quality, yet the impact mechanism was not explained in detail. On this basis, this study discusses the mechanism of the multi-load converter's influence on power quality. In addition to the influence of the number of load converters on the power quality, the characteristics of the load converter itself are also considered.
At present, there are mainly three types of converters used in MVDC systems: the modular multilevel converter (MMC), three-level DC converter, and dual active bridge (DAB) converter. The power switches in the MMC structure withstand less voltage stress and generate less electromagnetic interference (Mo et al., 2015; Kenzelmann et al, 2011; Ferreira, 2013), which is conducive to better power quality. The application of wide bandgap devices such as SiC MOSFETs can reduce the stages of the MMC, thereby reducing the complexity of the MVDC system (Zhao et al., 2020; Zhao et al., 2021). The DAB has a good soft-switching performance and can achieve higher efficiency (Yanhui Xie et al., 2010; Zhao et al., 2017). The circuit topology of the three-level DC converter is relatively simple, easy to control, and more stable (Xiao et al., 2014; Xinbo Ruan et al., 2008). These three types of converters have their own characteristics. As for load converters, they can all be regarded as constant power loads with negative resistance, which introduce the system instability concern.
In prior to analyzing the influence of the network formed by the connection of multiple load converters on power quality, a suitable system model should be established. Many [references] have proposed modeling methods for MVDC systems. The reference by Khan et al., (2017) divided the MVDC system into three parts, including the power system, load system, and energy storage system, and established a detailed transient simulation model. The reference by Ji et al., (2018) described the system with an adjacency matrix and proposed a hierarchical control based on the system matrix. The reference by Tan et al., (2017) proposed a convex model for MVDC systems to study the transmission losses. The modeling methods mentioned in the studies by Khan et al., (2017); Tan et al., (2017); and Ji et al., (2018) were all for specific research purposes and could not be used to analyze the system state in general. References by Shi et al., (2015); Bosich et al., (2017); and Sulligoi et al., (2017) used the state-space averaging model and the small-signal analysis method to analyze the dynamic process of the system and then proposed a corresponding control strategy to maintain the stability of the bus voltage. Among them, the load converter model was taken as a constant power load model with a controlled current source connected in parallel with a capacitor. The parallel connection of multiple constant power load models is equivalent to a constant power load model, while this model is not appropriate for investigating the interactions of different load converters. The reference by Liu et al., (2017) utilized impedance modeling to analyze the stability and harmonics of the MVDC system including the power generation system and the motor drive system, while the influence of multiple load converters is also ignored. Although the models in references by Shi et al., (2015); Bosich et al., (2017); Liu et al., (2017); Sulligoi et al., (2017) cannot be used to describe the effects of multi-load converters, the modeling method can be used to analyze the system state.
In view of the above problems, this study explores the mechanism of the multi-load converter affecting the power quality based on the impedance network analysis method. An MVDC system with four load regions is taken as an example. A three-level H-bridge DC converter is used as the load converter. The state-space averaging method and the small-signal analysis method are used to establish the impedance model of the load converter; then, the impedance network of the system is established. Through comparing the system impedance spectrum under different numbers of load converters, the influence of the number of load converters on power quality is revealed.
The contribution of this study is as follows.
(1) This study reveals for the first time that an increase in the number of load converters will increase the probability of background harmonics being amplified in the MVDC system and make the system more susceptible to low-frequency background harmonics.
(2) The impedance model of the MVDC system is established by using the state-space averaging method and the small-signal analysis method to analyze the spectrum change of the system resonance point, and the mechanism of the power quality deterioration of the MVDC system caused by the multi-load converter is revealed.
The rest of this study is organized as follows. A modeling method of MVDC systems is proposed in Section 2. In Section 3, the input impedance model of the three-level H-bridge DC converter is introduced. On the basis, the influence of load converters on power quality is analyzed in Section 4, and the mechanism of the influence is verified in Section 5. Section 6 concludes the full text.
2 Modeling of an MVDC System
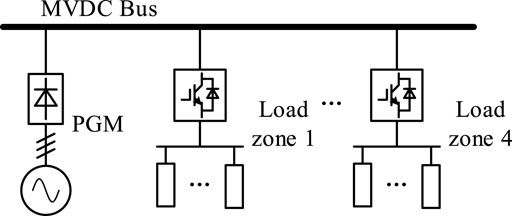
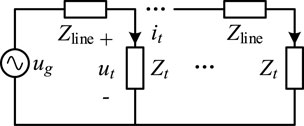
Figure 1 shows the network architecture of the MVDC system. Its configuration includes the following parts: 1) one power generation module (PGM); 2) one MVDC system bus; and 3) one to four load areas. The PGM is connected to the bus through a three-phase rectifier bridge, and the load area is connected to the bus through a three-level H-bridge DC converter. It is assumed that there are background harmonics on the output side of the three-phase rectifier bridge, which affects the power quality of the DC bus. To simplify the analysis, the output impedance of the PGM is ignored, and the load on the output side of the three-level H-bridge is replaced by a pure resistance. Finally, the small-signal model of the MVDC system shown in Figure 2 is obtained. The inductance and the resistance are represented by a series of Zline in Figure 2. The input impedance of the load converter can be derived from equations 3 and (4).
3 Input Impedance Model of the Three-Level H-Bridge DC Converter
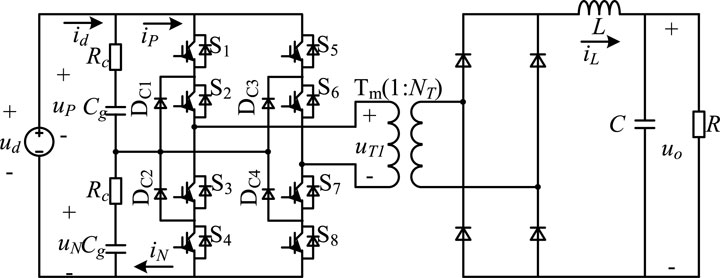
The topology of the three-level H-bridge DC converter is shown in Figure 3. Cg is the voltage equalizing capacitor on the output side. RC is the equivalent resistance of the voltage equalizing capacitor. S1∼S8 are the switching tubes on the inverter side. Dc1∼Dc4 are the clamping diodes. The transformation ratio of the intermediate frequency transformer Tm is 1:NT. L and C are the output filter parameters, and R is the load. ud is the input voltage, and id is the input current. iL is the current on L. uo is the output voltage. uP is the voltage of the upper-end equalizing capacitor. uN is the voltage of the lower-end equalizing capacitor. uT1 is the primary side voltage of the transformer, and its direction is specified as the direction shown in Figure 3.
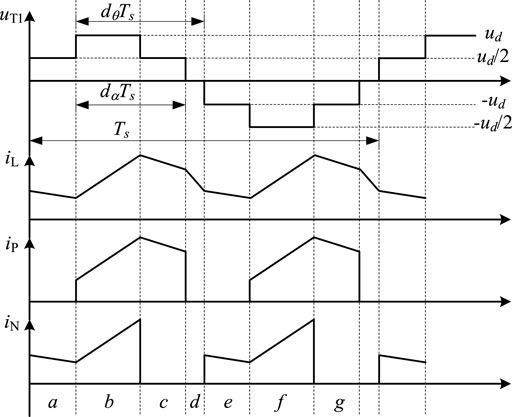
In this model, it is assumed that the frequency of the equalizing control loop is high; the influence of the control loop can be ignored. As a result, the switch devices in the figure are all ideal devices, and the transformer is an ideal transformer. Through the analysis, the working waveforms of the converter can be obtained, as shown in Figure 4, and the simplified model of Figure 3 can be obtained, as shown in Figure 5 (Zhao et al., 2017).
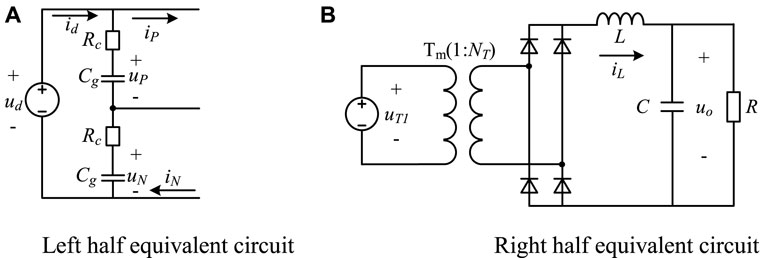
FIGURE 5. Simplified circuit of the three-level H-bridge DC/DC converter. (A) Left half equivalent circuit (B) Right half equivalent circuit.
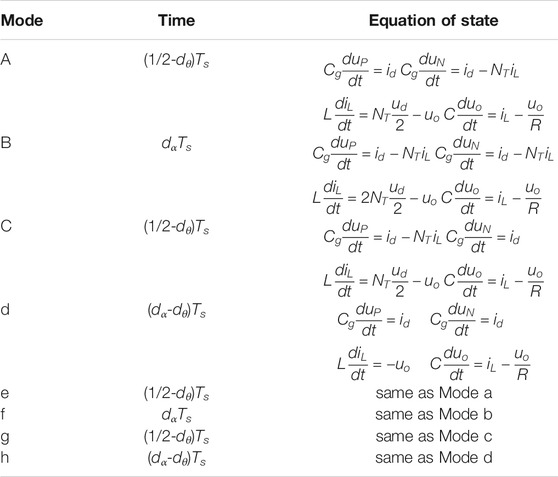
According to Figures 4, 5, the state equations for the eight operating states (a∼h) of the three-level H-bridge converter can be listed in Table 1.
Based on the previous assumptions, it can be obtained that
Assuming that the converter is controlled by a single voltage loop, the relationship between the conduction angle dα and the output voltage uo can be expressed as
where kp and ki are the parameters of the PI controller, and
Therefore, the input impedance of a three-level H-bridge converter can be expressed as
4 Influence of the Load Converter on Power Quality
In order to analyze the influence of multi-load converters on power quality, the input voltage ut and input current it of the load area closest to the PGM (hereinafter referred to as load area 1) are taken as an example for analysis. It is denoted that the equivalent input impedance of n load regions is Zn. Thus, it can be deduced from Figure 2 that the expression of Zn is
ut and it can be expressed as
where ug is the background harmonic, and n ranges from 1 to 4.
Equations 6 and 7 reflect that the input voltage and current in load region 1 are affected by its self-impedance, impedance of other load regions, and the background harmonics. The transfer function from ug to ut is denoted by TU(s), and the transfer function from ug to it is denoted by TI(s). Then, their expressions are shown in the following formulas.
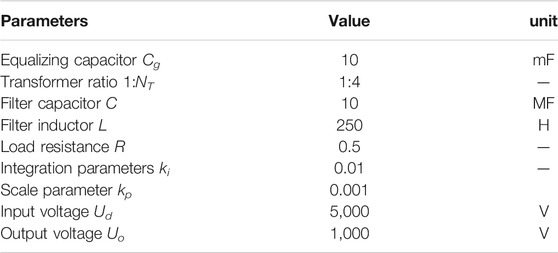
The spectral changes of TU(s) and TI(s) reflect the influence degree of multi-load converters on power quality. With different n, two transfer functions are calculated, and their Bode plots are shown in Figure 6. The parameters of the converter are listed in Table 2.

FIGURE 6. Bode diagrams of TU(s) and TI(s) under different numbers of load zones (A) Bode diagrams of TU(s) (B) Bode diagrams of TI(s).
It can be seen from Figure 6 that with the increase of the load converter number, the resonance point in the Bode diagram increases, and the original resonance peak frequency becomes lower. The resonance peak in the figure indicates that the background harmonics are amplified at this resonance point. The increase of resonance points means that the system is more susceptible to the influence of background harmonics. Lower resonant peak frequencies mean that the system is more susceptible to low-frequency disturbances, which are often difficult or expensive to filter out.
5 Case Study
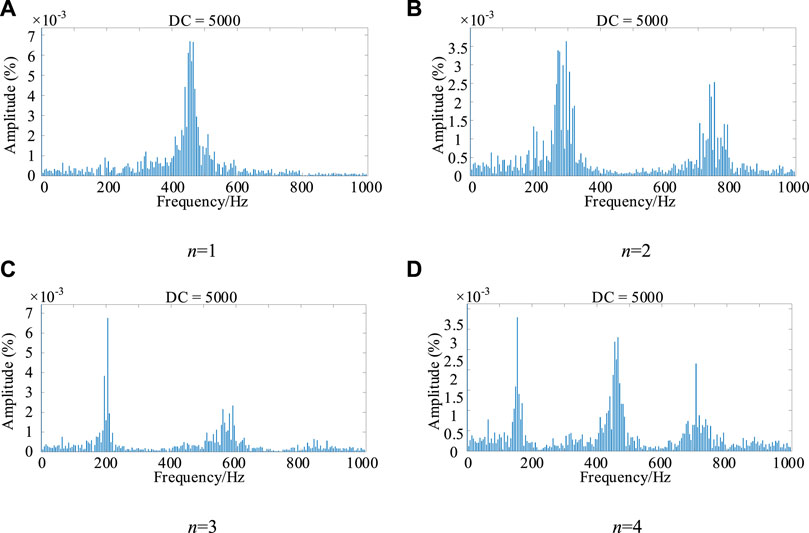
In order to verify the above analysis results, a simulation model of the MVDC system based on the MATLAB/Simulink platform is established with an architecture shown in Figure 1. The PGM is replaced by an ideal voltage source, and a broad-spectrum white noise is superimposed on the ideal voltage source as background harmonics. The number of load zones varies from 1 to 4. The voltage and current on the input side of load area 1 are measured, and the measured data are subjected to fast Fourier transform (FFT) analysis (Li, 2021a; Li, 2021b; Li, 2022). The analysis results are shown in Figures 7,8.
It can be seen from Figures 7,8 that the high content of the ripple frequency in the simulation results is basically consistent with the resonance point frequency in the Bode plot obtained from TU(s) and TI(s). When one load zone is connected to the system, the ripple content at the frequency of 470 Hz is the highest. When two load areas are connected to the system, there are two frequencies with higher ripple content, and their frequencies are 270 and 750 Hz, respectively. As the number of load zones increases, the types of ripples with higher content gradually increase, while the frequency of high-content ripples becomes lower.
6 Conclusion
This study analyzes the mechanism of power quality deterioration caused by the multi-load converter connected to the MVDC system. In this study, the load converter is modeled and analyzed by the state-space average method and the small-signal analysis method, and then, the impedance network model of the MVDC system is established. When the number of load converters changes, voltage and current on the input side of load area 1 are affected by the background harmonics. Finally, the influence of the number of load converters on power quality is analyzed. Two main conclusions are drawn:
(1) As the number of load converters increases, background harmonics are amplified in the MVDC system.
(2) The increase of load converters makes the MVDC system more susceptible to low-frequency background harmonics.
Data Availability Statement
The raw data supporting the conclusions of this article will be made available by the authors, without undue reservation.
Author Contributions
All authors listed have made a substantial, direct, and intellectual contribution to the work and approved it for publication.
Conflict of Interest
The authors declare that the research was conducted in the absence of any commercial or financial relationships that could be construed as a potential conflict of interest.
Publisher’s Note
All claims expressed in this article are solely those of the authors and do not necessarily represent those of their affiliated organizations, or those of the publisher, the editors, and the reviewers. Any product that may be evaluated in this article, or claim that may be made by its manufacturer, is not guaranteed or endorsed by the publisher.
References
Arcidiacono, V., Menis, R., and Sulligoi, G. (2007). Improving Power Quality in All Electric Ships Using a Voltage and VAR Integrated Regulator,” Electric Ship Technologies Symposium. Arlington, VA, USA: ESTS '07IEEE, 322
Bosich, D., Sulligoi, G., Mocanu, E., and Gibescu, M. (2017). Medium Voltage DC Power Systems on Ships: An Offline Parameter Estimation for Tuning the Controllers' Linearizing Function. IEEE Trans. Energ. Convers. 32 (2), 748–758. doi:10.1109/tec.2017.2676618
Crapse, P., Wang, J., Abrams, J., Shin, Y. J., and Dougal, R. (2007). Power Quality Assessment and Management in an Electric Ship Power System,” Electric Ship Technologies SymposiumESTS '07. Arlington, VA, USA: IEEE, 328
Ferreira, J. A. (2013). The Multilevel Modular DC Converter. IEEE Trans. Power Electron. 28 (10), 4460–4465. doi:10.1109/tpel.2012.2237413
Ji, Y., Yuan, Z., Zhao, J., Lu, C., Wang, Y., Zhao, Y., et al. (2018). Hierarchical Control Strategy for MVDC Distribution Network under Large Disturbance. IET Generation, Transm. Distribution 12 (11), 2557–2565. doi:10.1049/iet-gtd.2017.1642
Kenzelmann, S., Rufer, A., Vasiladiotis, M., Dujic, D., Canales, F., and Novaes, Y. R. D. (2011). A Versatile DC-DC Converter for Energy Collection and Distribution Using the Modular Multilevel Converter,” - European Conference on Power Electronics and Applications. Birmingham, UK: IEEE. 1
Khan, M. M. S., Faruque, M. O., and Newaz, A. (2017). Fuzzy Logic Based Energy Storage Management System for MVDC Power System of All Electric Ship, 99. IEEE Transactions on Energy Conversion, 1
Li, H. (2022). Detection and Segmentation of Loess Landslides via Satellite Images: a Two-phase Framework. Landslides, 1–14. doi:10.1007/s10346-021-01789-0
Li, H. (2021). Monitoring and Identifying Wind Turbine Generator Bearing Faults Using Deep Belief Network and EWMA Control Charts. Front. Energ. Res., 770. doi:10.3389/fenrg.2021.799039
Li, H. (2021). Short-Term Nacelle Orientation Forecasting Using Bilinear Transformation and ICEEMDAN Framework. Front. Energ. Res., 697. doi:10.3389/fenrg.2021.780928
Liu, H., Guo, H., Liang, J., and Qi, L. (2017). Impedance Based Stability Analysis and Harmonics Mitigation of MVDC Systems Using Generator-Thyristor Units and DTC Motor Drives. IEEE J. Emerging Selected Top. Power Electro. 99, 1
Mo, R., and Li, H. (2017). Hybrid Energy Storage System with Active Filter Function for Shipboard MVDC System Applications Based on Isolated Modular Multilevel DC/DC Converter (IM2DC). IEEE J. Emerging Selected Top. Power Electro. 99, 1
Mo, R., Li, R., and Li, H. (2015). Isolated Modular Multilevel (IMM) DC/DC Converter with Energy Storage and Active Filter Function for Shipboard MVDC System Applications. Electric Ship Technologies Symposium, 113
Ouyang, H., and Li, H. The Ship Power Quality Monitoring System Based on Virtual Instrument and Configuration Software. Chinese Automation Congress, 1646
Puthalath, S., and Bhuvaneswari, G. Power Quality Enhancement and Renewable Energy Integration in Ship's Distribution Grid,” 2018 IEEMA Engineer Infinite Conference (eTechNxT). 1
Shi, J., Amgai, R., and Abdelwahed, S. (2015). Modelling of Shipboard Medium‐voltage Direct Current System for System Level Dynamic Analysis. IET Electr. Syst. Transportation 5 (4), 156–165. doi:10.1049/iet-est.2014.0033
Shin, Y. J., Monti, A., Ponci, F., Arapostathis, A., Grady, W. M., Powers, E. J., et al. (2004). Virtual Power Quality Analysis for Ship Power System Design, in” Proceedings of the IEEE Instrumentation and Measurement Technology Conference Imtc 04, 1758–1763.
Steurer, M., Andrus, M., Langston, J., Qi, L., Suryanarayanan, S., Woodruff, S., et al. (2007). Investigating the Impact of Pulsed Power Charging Demands on Shipboard Power Quality,” Electric Ship Technologies Symposium. Arlington, VA, USA: ESTS '07IEEE, 315
Su, C.-L., Lin, K.-L., and Chen, C.-J. (2016). Power Flow and Generator-Converter Schemes Studies in Ship MVDC Distribution Systems. IEEE Trans. Ind. Applicat. 52 (1), 50–59. doi:10.1109/tia.2015.2463795
Sulligoi, G., Bosich, D., Giadrossi, G., Zhu, L., Cupelli, M., and Monti, A. (2017). Multiconverter Medium Voltage DC Power Systems on Ships: Constant-Power Loads Instability Solution Using Linearization via State Feedback Control. IEEE Trans. Smart Grid 5 (5), 2543
Tan, Y., Li, Y., Cao, Y., and Shahidehpour, M. (2017). Integrated Optimization of Network Topology and DG Output for MVDC Distribution Systems. IEEE Trans. Power Syst. 99, 1
Xiao, F., Yang, G., Fan, X., Xie, Z., Wang, R., and Han, X. (2014). Design of an Isolated Medium-Frequency Medium-Voltage High-Power Three-Level H-Bridge DC/DC Converter. Instrumentation and Measurement Technology Conference, 637–642.
Xie, C., and Zhang, C. (2010). Research on the Ship Electric Propulsion System Network Power Quality with Flywheel Energy Storage,” Asia-pacific Power & Energy Engineering Conference. Chengdu, China: IEEE. 1
Xinbo Ruan, X., Bin Li, B., Qianhong Chen, Q., Siew-Chong Tan, S. C., and Tse, C. K. (2008). Fundamental Considerations of Three-Level DC-DC Converters: Topologies, Analyses, and Control. IEEE Trans. Circuits Syst. 55 (11), 3733–3743. doi:10.1109/tcsi.2008.927218
Yanhui Xie, Y., Jing Sun, J., and Freudenberg, J. S. (2010). Power Flow Characterization of a Bidirectional Galvanically Isolated High-Power DC/DC Converter over a Wide Operating Range. IEEE Trans. Power Electron. 25 (1), 54–66. doi:10.1109/tpel.2009.2024151
Zhao, B., Song, Q., Li, J., Xu, X., and Liu, W. (2017). Comparative Analysis of Multilevel-High-Frequency-Link and Multilevel-DC-Link DC-DC Transformers Based on MMC and Dual-Active-Bridge for MVDC Application. IEEE Trans. Power Electro. 99, 1
Zhao, S., Dearien, A., Wu, Y., Farnell, C., Rashid, A. U., Luo, F., et al. (2020). Adaptive Multi-Level Active Gate Drivers for SiC Power Devices. IEEE Trans. Power Electron. 35 (2), 1882–1898. doi:10.1109/tpel.2019.2922112
Keywords: MVDC, impedance modeling, multiple load converters, power quality, mechanism analysis
Citation: Huang H, Liu F and Zha X (2022) Mechanism of Power Quality Deterioration Caused by Multiple Load Converters for the MVDC System. Front. Energy Res. 10:864211. doi: 10.3389/fenrg.2022.864211
Received: 28 January 2022; Accepted: 08 February 2022;
Published: 17 March 2022.
Edited by:
Yusen He, Grinnell College, United StatesReviewed by:
Lu Wang, National University of Singapore, SingaporeShuang Zhao, Hefei University of Technology, China
Copyright © 2022 Huang, Liu and Zha. This is an open-access article distributed under the terms of the Creative Commons Attribution License (CC BY). The use, distribution or reproduction in other forums is permitted, provided the original author(s) and the copyright owner(s) are credited and that the original publication in this journal is cited, in accordance with accepted academic practice. No use, distribution or reproduction is permitted which does not comply with these terms.
*Correspondence: Fei Liu, bGZfZHlqQHdodS5lZHUuY24=
 Heming Huang
 Fei Liu*