
94% of researchers rate our articles as excellent or good
Learn more about the work of our research integrity team to safeguard the quality of each article we publish.
Find out more
ORIGINAL RESEARCH article
Front. Energy Res., 01 June 2022
Sec. Wind Energy
Volume 10 - 2022 | https://doi.org/10.3389/fenrg.2022.863995
This article is part of the Research TopicOffshore Wind Energy: Modeling and MeasurementsView all 7 articles
In California offshore waters, sustained northwesterly winds have been identified as a key energy resource that could contribute substantially to California’s renewable energy mandate. It is these winds that drive upwelling, which is responsible for much of the primary productivity that sustains one of the richest ecosystems on the planet. The goal of this study is to quantify changes in wind fields at the sea surface as the result of offshore wind turbine deployments by use of an atmospheric model. Modeled wind fields from this study will drive an ocean circulation model. The Weather Research and Forecasting model was implemented on a regional scale along the U.S. west coast, with a higher resolution nest along the California continental shelf. Simulated arrays of offshore wind turbines were placed within call areas for wind farm development offshore of Central and Northern California. At full build-out, it was found that wind speeds at 10 m height are reduced by approximately 5%, with wakes extending approximately 200 km downwind of the nominated lease block areas. The length scale of wind speed reductions was found to be several times the internal Rossby radius of deformation, the spatial scale at which rotationally-influenced ocean circulation processes such as upwelling occur.
In California offshore waters, sustained northwesterly winds have been identified as a key energy resource, with the offshore wind resource potential estimated at 112 gigawatts (Musial et al., 2016). This resource could contribute substantially to California’s renewable energy mandate (Senate Bill [SB] 100). The key advantage of offshore wind over its land-based counterpart is that the offshore wind resource is far more consistent, reliable, and energetic, with little of the topographic and small-scale variability typically observed over land. It is believed that floating offshore wind technologies could reach capacity factors of more than 70%, and the levelized cost of energy of floating offshore wind projects is projected to decrease by as much as 53% by 2050 (Wiser et al., 2016), making offshore wind a viable energy source. However, a lack of understanding of potential environmental impacts is a current barrier to offshore wind that requires further investigation and mitigation.
Wind-driven upwelling is responsible for much of the primary productivity that sustains one of the richest ecosystems on the planet (Xiu et al., 2018). Wind-driven upwelling along the California coast is forced in two ways (Figure 1). First, northwesterly winds drive offshore Ekman transport near the coast, which produce coastal divergence and consequently, upwelling of deep, nutrient-rich waters in a band adjacent to the coast whose width is approximatelythe Rossby radius of deformation (tens of kilometers at these latitudes). Second, wind stress (i.e., shear stress exerted by the wind on the sea surface) curl drives divergent flow near the ocean’s surface and consequently, upwelling (Ekman suction) that can extend farther offshore than that driven by coastal divergence (Checkley Jr and Barth, 2009). Thus, an offshore wind farm with an areal extent approximately equal to a lease block area of, e.g, 20 km × 20 km (i.e., full build-out) is on the order of spatial scales at which upwelling occurs off the California coast.
Three California offshore wind energy areas were nominated by the Bureau of Ocean Energy Management (BOEM) [Docket No. BOEM-2018-0045]—Humboldt, Morro Bay, and Diablo Canyon—where suitable offshore wind resources have been identified (Musial et al., 2016). Diablo Canyon is now no longer under consideration for offshore wind farm development. Therefore, results presented in this paper can be considered an upper-bound on potential atmospheric effects. These sites also provide essential habitat and migration routes for a variety of marine life including threatened and endangered species of birds, marine mammals, sea turtles, fish, and invertebrates, while also supporting commercial and recreational fishing and a maritime economy valued at approximately $22 billion (NMFS-F/SPO-187A, 2018).
The development of large-scale offshore wind energy projects has the potential to reduce the wind stress, which could have local and/or regional implications on wind-driven upwelling, nutrient delivery, and ecosystem dynamics. With increasing turbine heights, blade sizes, and spatial scales, concerns in the ability of wind farms to alter the downstream wind field are growing. On land, alterations to the wind field have been hypothesized to affect global climate through the extraction of kinetic energy and altering turbulent transport in the atmospheric boundary layer (Keith et al., 2004). On a more local scale, these alternations primarily result in changes in downstream temperature (Roy et al., 2004). While this alteration can affect surface meteorological conditions, siting of land-based wind farms in areas of high turbulence can mitigate these effects (Roy and Traiteur, 2010). Offshore wind, however, presents a unique environmental case study because of the potential of indirect effects such as changes to coastal currents caused by a reduction in downstream wind stress, and subsequent cascading ecosystem responses.
A number of approaches with varying degrees of accuracy and complexity are available to estimate the behavior of wind turbine wakes from offshore wind farms. Analytical and semi-empirical models such as those by Jensen (1983), Ainslie (1988), or the Dynamic Wake Meandering model (Larsen et al., 2007) can quickly calculate the downstream wake deficit and wake spreading of multiple turbines. However, many of the commonly used semi-empirical models rely on calibrations against measured data or simulations, and can neglect important atmospheric boundary layer (ABL) physics such as stratification or wake-wake interactions. Furthermore, these models generally focus on wake quantities at hub height and may not provide accurate information regarding wind stress changes due to the presence of atmospheric wakes in the lee of wind turbines.
An alternate approach is to simulate the wind farm and turbine wakes using high-fidelity, computational fluid dynamics (CFD) based methods. CFD-based simulations can be done at both the wind farm (microscale, order 100 km) level, and also at the larger mesoscale (order 1000s of km) level. In both cases, a wider range of ABL phenomena is captured when compared to lower fidelity analytical models. Wind farm-level CFD approaches, such as the Simulator for Wind Farm Applications (SOWFA, Churchfield et al., 2012) and the ExaWind code suite (Sprague et al., 2020) typically consider domain sizes up to 30 km × 30 km, and include the Coriolis, buoyancy, stratification, and surface effects necessary for resolving realistic ABL physics. The effect of turbines are simulated using blade-resolved or actuator line models, and the necessary turbulent scales are resolved in the large eddy simulations (LES). This allows for a highly-resolved model of turbine behavior and various wake interactions downstream of the wind farm, and accurately captures the changes in wind profiles and surface stress in the waked regions.
While farm-level CFD simulations can provide detailed results at high resolution, the modeling is computationally intensive and often limited to the region immediately surrounding the simulated turbine, and over relatively short time periods. In contrast, mesoscale-level CFD simulations can cover larger domains and analyze longer term trends, including seasonal and yearly variations. These mesoscale models also allow for simulations of a greater range of physical effects, including precipitation, cloud dynamics, and radiative transport phenomena. However, coarser turbine representations such as the actuator disk model (Martinez et al., 2012; Blaylock et al., 2022) are typically used due to the larger mesh resolutions involved. Nevertheless, previous studies have successfully used mesoscale-level CFD modeling to study offshore wind farm wakes (Platis et al., 2018; Cañadillas et al., 2020).
Here, the publicly available Weather Research and Forecasting (WRF) mesoscale model with the wind farm parameterization (WFP) module is applied to simulate changes to wind fields following the introduction of offshore wind projects off California. The WRF-WFP model (Fitch et al., 2012) represents wind turbines as a momentum sink and turbulence source, and allows for the specification of turbine parameters such as hub height, rotor diameter, power curve, and thrust coefficients (Lee and Lundquist, 2017). By allowing for wind farm parameterization within an established and validated operational weather model, WRF-WFP has been utilized in a number of studies to evaluate the effects of wind farms on mesoscale weather patterns. For example, Eriksson et al., (2015) compared WRF-WFP with LES of wind farms and found that while power production was better estimated by LES, the two methods showed similar wake expansion. Jiménez et al. (2015) conducted an observational and modeling study at the Horns Rev offshore wind farm (Denmark) and concluded that the WRF-WFP model qualitatively reproduced wind farm power deficits, while Miller et al. (2015), also using WRF-WFP, found that the limits to power production by large scale wind farms are determined by the reduction in wind speeds.
With the exception of the Horns Rev study (Jiménez et al., 2015) that was applied to a 21 km2 wind farm, there have been relatively few studies that have examined wind field reductions at the sea surface for large offshore wind farms, such as those planned offshore of California. Of particular relevance to this study are works by Duin (2019) and Huang and Hall (2015). Duin (2019) studied wind field reductions for a large offshore wind farm in the North Sea and found that typical wind speeds at 10 m above the sea surface are reduced by up to 1 m/s, with secondary effects on temperature, relative humidity, and radiation. Specific to California, Huang and Hall (2015) applied WRF-WFP to simulate a 10 km × 10 km wind farm offshore of Bodega Bay, California. The authors found approximately 10% reduction in wind speeds, with reductions seen 100 km downstream. Similar to Duin (2019) and other land-based studies, temperature decreases in the lower marine boundary layer were reported, accompanied by increases in humidity. The results presented in this study can be considered a logical extension of the above two efforts in that wind field reductions are examined on regional scales using a full build-out of wind farms at specific call areas that have been identified for commercial leases.
In this study, the WRF-WFP model is applied to the Eastern Pacific region, with a higher resolution inner nest that encompasses the continental shelf, the call areas, and the California coast. Simulated offshore wind farms are placed within three call areas, each approximately 100 km × 100 km, and located offshore of Humboldt, Morro Bay, and Diablo Canyon, California. In this preliminary assessment, each nominated lease block is fully built-up, with turbines occupying the entire call area. Winds at 10 m are found to be typically lowered by 5%, while the wakes are seen to extend over 200 km downwind. The spatial scales of perturbation seen in this modeling study are on the order of scales at which ocean processes such as upwelling occur, which forms the subject of an ongoing follow-on study. This paper is organized as follows: Section 2 describes the model setup and simulations performed, Section 3 presents results from the modeling study, while Section 4 presents the discussion and conclusion of results, along with future research directions.
The Weather Researching and Forecasting (WRF) Model (Skamarock et al., 2019) is used to simulate the atmospheric effects of wind turbines off the coast of California with the goal of providing input data for an ocean circulation model. The WRF model is configured to use two levels of horizontal discretization, with each model grid set up using a Mercator projection. The coarser, outer nest consists of 150 × 144 cells in the latitudinal and longitudinal directions, respectively, with latitudinal spacing that varies from 0.12 to 0.15° and a longitudinal spacing equal to 0.17° (nominal Δx = 15 km). The inner, finer nest consists of 426 × 516 cells, with latitudinal spacing that varies from 0.026 to 0.03° and a longitudinal spacing equal to 0.035° (nominal Δx = 3 km). Each nest has 61 terrain-following vertical levels that span from the sea surface to approximately 3.4 km height above the sea surface. The horizontal discretization values for each nest were chosen to correspond with the discretization of an accompanying ocean circulation model, and follow recommendations from Tomaszewski and Lundquist (2020) for refinement levels of inner nest WRF simulations of wind turbines. The extent of the outer (inner) model domain was chosen to overlap with that of the outer (inner) domain of the accompanying ocean circulation model, while the large size prevents boundary artifacts arising from the mismatch between boundary conditions and the model solution near the lateral boundaries from propagating into the interior of the domain that consist of areas of interest. Both the outer and inner domains are centered nominally at latitude and longitude coordinates of 39°N and 122.75°W, with the outer domain spanning longitudinal values from 136°W to 110°W, and latitudinal values from 29.5°N to 48.5°N. The inner, refined domain spans longitudinal values from 130°W to 115°W, and latitudinal values from 31.1°N to 45.25°N. Figure 2 shows the model grid extents, topography, and a vertical section of the modeled wind turbines overlaid on a subset of offshore terrain-following WRF vertical levels between the surface and 1,200 m above the sea surface to better highlight vertical discretization around the turbine.
The physical simulation was run using the Ferrier microphysics scheme, the Kain-Fritsch cumulus option on the outer nest, and no cumulus scheme on the inner nest, as adapted from Optis et al. (2020a, 2020b). The Rapid Radiative Transfer Mode longwave and shortwave models with reduced integration intervals (also known as g-intervals) were utilized with cloud effects turned on. Subgrid scale turbulence is modeled using the Mellor–Yamada–Nakanishi–Niino (MYNN) planetary boundary-layer scheme, which was employed with the MYNN third level turbulent kinetic energy option. The Noah Land-Surface model was used with four soil temperature and moisture layers, as well as fractional snow cover and frozen soil physics. Table 1 shows the exact physics parameters input into the WRF simulations.
The European Center for Medium Range Weather Forecasts (ECMWF) Reanalysis v5 (Hersbach et al., 2018) provided pressure and sea-surface temperature (SST) input conditions for the WRF model. The quality-assured ERA5 boundary conditions cover the Earth on a 30 km grid and resolve the atmosphere using 137 levels from the surface to a height of 80 km. These physics parameters and forcing fields used in the WRF model implementation are identical to the validated model used to develop the Wind Toolkit (Optis et al., 2020b), and therefore no duplicate validation effort was performed for this study.
Each simulation was performed twice; once without turbines and once with turbines present, every 3 h for a 13-year period from 1988 to 2000, a period chosen to overlap with boundary conditions for an ocean circulation model, for which the WRF model output will serve as forcing fields. Turbine parameters (hub height of 128 m, rotor diameter of 196 m, thrust and power coefficient curves) were taken from the 10 MW floating offshore turbine model described in Beiter et al. (2020) with a commercial operation date of 2022. Simulated turbines are located within each call area assuming a full project build-out, as shown in Figure 3. Water depths for the turbine locations range from 800 to 2,000 m. The locations of turbines within the Humboldt call area are identical to those reported by Severy and Garcia (2020), which consisted of 152 turbines spaced roughly 1.8 km apart (approximately 9 turbine diameters). A similar ∼9-diameter turbine spacing was applied to the Morro Bay and Diablo Canyon call areas, resulting in a total of 230 and 495 turbines in each nominated call area, respectively.
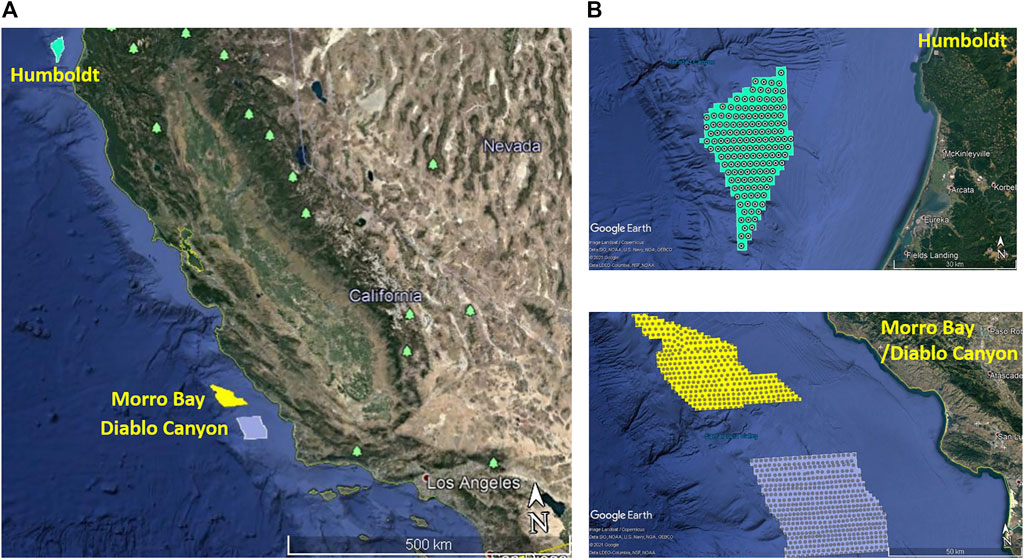
FIGURE 3. Location of wind energy call areas along the California coast (A), and modeled layouts of turbines within each call area (B).
Thirteen years of WRF model results are presented, covering the years 1988–2000, assuming full build-out of turbines at each of the three call areas (Humboldt, Morro Bay and Diablo Canyon). The model was run without and with simulated turbine arrays and the differences in atmospheric circulation were compared. Atmospheric fields of interest were those that constitute forcing fields to an ocean circulation model, namely: east-west and north-south horizontal winds at 10 m height above the sea surface (U10 and V10, respectively), specific humidity at 2 m height above the sea surface, downward longwave radiation, net shortwave radiation, precipitation, surface air pressure, and surface air temperature at 2 m height above the surface.
Figure 4 shows an example of the approximate hub height (127.12 m) meridional component of velocity (V, positive to the north, i.e., southward winds have a negative V) for the entire model domain, as well as a closeup of V-deficit (no turbines minus turbines) for the Morro Bay and Diablo Canyon call areas at 1200 h on 15 April 2000 in the simulation. Overlaid on each panel are velocity streamlines in the absence of turbines. Meridional wind speeds over land are observed to show considerable topographic variability, modulated by the Coast Ranges, central plains, and the Sierra Nevada mountains. In contrast, the offshore meridional wind speeds are predominantly northwesterly, with magnitudes that occasionally approach 25 m/s. Significant reduction of the northwesterly winds are observed south of Point Conception, which marks a distinct biogeographic boundary between Central and Southern California (Burton, 1998). The map of the meridional wind speed deficit shows a marked reduction in V in the lee of the Morro Bay/Diablo Canyon call areas, with the wake extending south of the Channel Islands. Instantaneous reductions in V range from a maximum of 1 m/s down to 0.25 m/s or less offshore of Los Angeles. In addition to wake effects extending to the lee of the predominant wind direction, shorter-term wake effects are seen southeast of the call areas, presumably due to eddying of wind fields. While distinct in Figure 4, these shorter term wakes are not expected to affect coastal upwelling, which requires sustained northwesterly winds to occur on time scales of several days (Huyer, 1983).
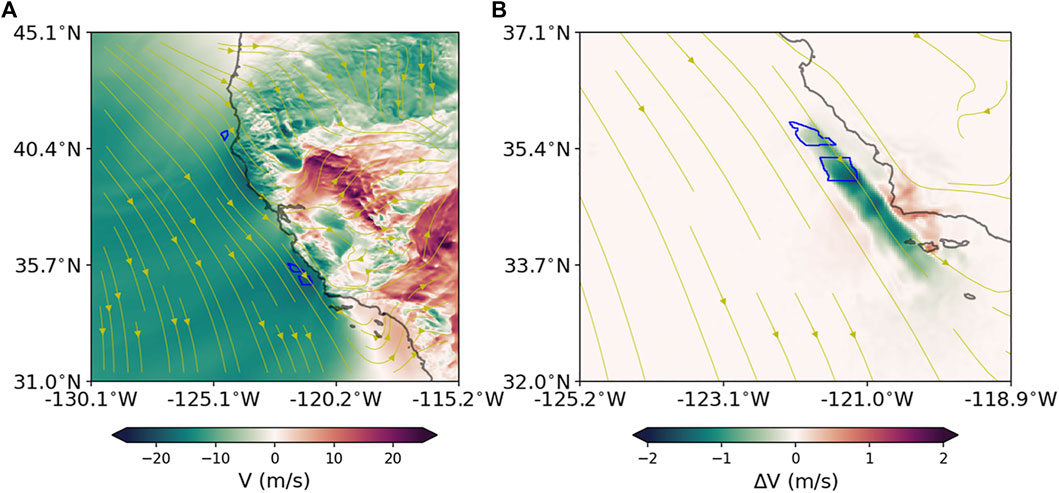
FIGURE 4. (A) North-south component of hub height velocity (V) at 1200 h on 15 April 2000, and, (B) difference in hub-height V, zoomed in around the Morro Bay/Diablo Canyon call areas. Velocity streamlines in the absence of turbines are shown on each plot, and wind farm call areas are outlined in blue.
Variability in wind speed deficits (no turbines minus turbines) at different heights above the sea surface are highlighted in Figure 5, which shows the mean wind speed deficit at 1200 h on 15 April 2000, at 10 m, 100 m, 200 m, and 250 m above the sea surface. Note that in contrast to Figure 4, which showed meridional wind speeds and therefore deficits in the presence of turbines as negative values, Figure 5 shows wind speed magnitudes and therefore deficits in the presence of turbines are positive values. Interestingly, a modest increase in wind speeds (negative deficit) at 10 m height is observed inside the call areas where turbines are located. This increase has previously been attributed to enhanced turbulent mixing of higher momentum air towards the sea surface and from the speed-up on winds around a blockage due to pressure perturbations (Rajewski et al. (2014); Vanderwende et al. (2016), and recall that the turbine hub height is 128 m, with a rotor diameter of 196 m, placing the turbine tips at a minimum of 30 m above the sea surface). Further up the air column, wind speed differences are predominantly in the form of deficits (relative to the background field) whose magnitudes range from 0.5 to 1 m/s, relative to mean wind speeds that range from 11 to 16 m/s. Wind directions were also examined (not shown) and little to no change in wind direction was observed.
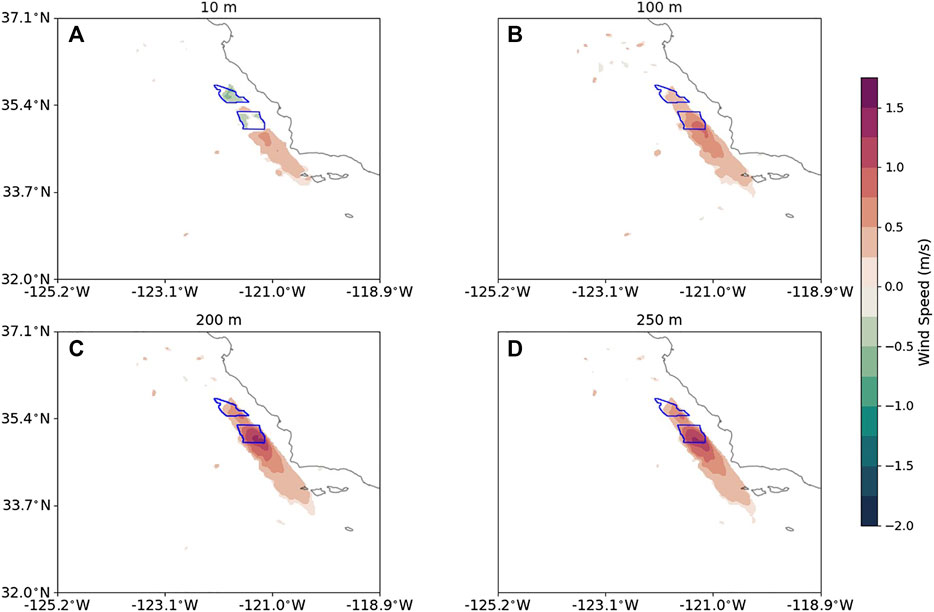
FIGURE 5. Differences in wind speeds without and with simulated turbines at different heights above the sea surface ((A): 10 m, (B): 100 m, (C): 200 m, (D): 250 m) at 1200 h on 15 April 2000 around the Morro Bay/Diablo Canyon wind farm call areas (outlined in blue).
In order to evaluate the extent of wakes downwind of the wind farms, and to understand the spatial scales of wake recovery, wind speed deficits are evaluated along a transect through the Morro Bay/Diablo Canyon call areas (Figure 6). The horizontal extent of the transect spans a distance of 300 km, starting north of the Morro Bay call area down to the Channel Islands. Figure 6 shows a 1,000 m vertical extent of wind speed differences along the aforementioned transect. Wind speed deficits are largest near hub height, accompanied by wind speed increases close to the sea surface in the immediate vicinity of the wind farms, followed by a gradual reduction in deficits further up the air column. Wind speed reductions are seen to extend up to 600 m (or ∼3 turbine diameters) above the sea surface (or 400 m above the upper extent of the turbine). Horizontally along the transect, wake effects are observed starting at 50 km downstream of the arrays, and extend a distance of approximately 200 km (or 1000 turbine diameters) downstream.
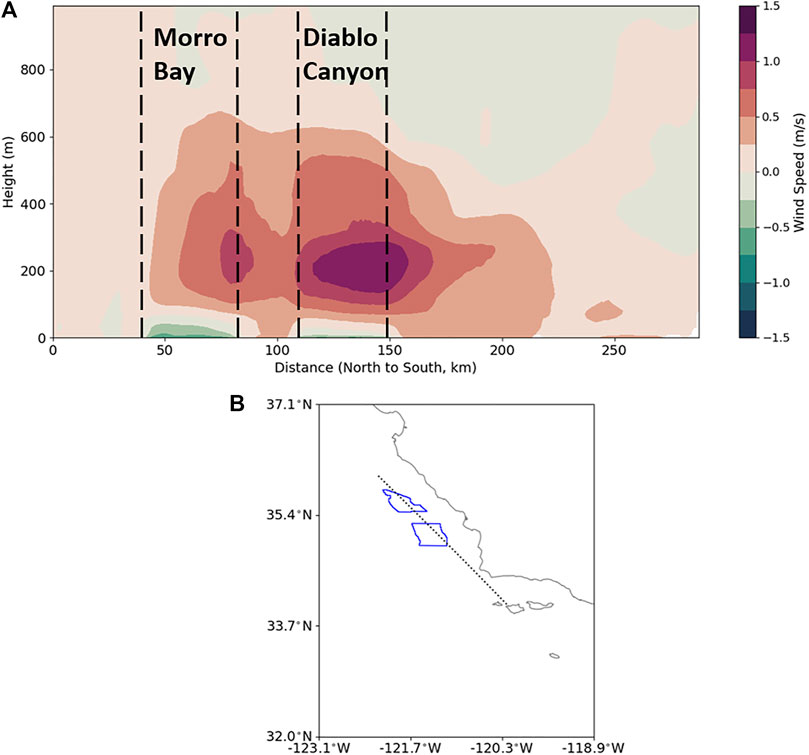
FIGURE 6. (A): Wind speed deficit (baseline simulation minus turbine simulation) along a transect through the Morro Bay/Diablo Canyon call areas (B) at 1200 h on 15 April 2000. The wind farm call areas are bracketed with each set of dashed lines in (A).
Longer-term perturbations and changes in wind speed and direction in the absence and presence of simulated turbines are evaluated in terms of seasonal variability (Figure 7). Here, the seasons winter, spring, summer and fall are defined as: January to March, April to June, July to September, and October to December, respectively. Sustained northwesterly winds are observed in the spring and summer months, accentuated by particularly intense winds between 10 and 15 m/s around headlands such as Cape Mendocino and Point Conception. Accompanied by the intensification of winds are the corresponding differences in wind speeds that approach 1 m/s ( ∼5% reduction) within the Morro Bay/Diablo Canyon call areas. No measurable change was observed in wind speed directions in the presence to turbines relative to the baseline condition. As also indicated in Figure 6, the regional extent of wind speed reduction induced by wind turbines over seasonal scales is often seen to extend southward past the Channel Islands, covering an aerial extent of approximately 14,000 km2, with a length scale of approximately 200 km. Wind speeds generally trend lower as fall transitions to winter, typical of weather patterns along the California coast. The seasonal atmospheric circulation is driven by the location of the North Pacific High and terrestrial surface pressures that in turn are modulated by seasonal heating and cooling (Huyer, 1983).
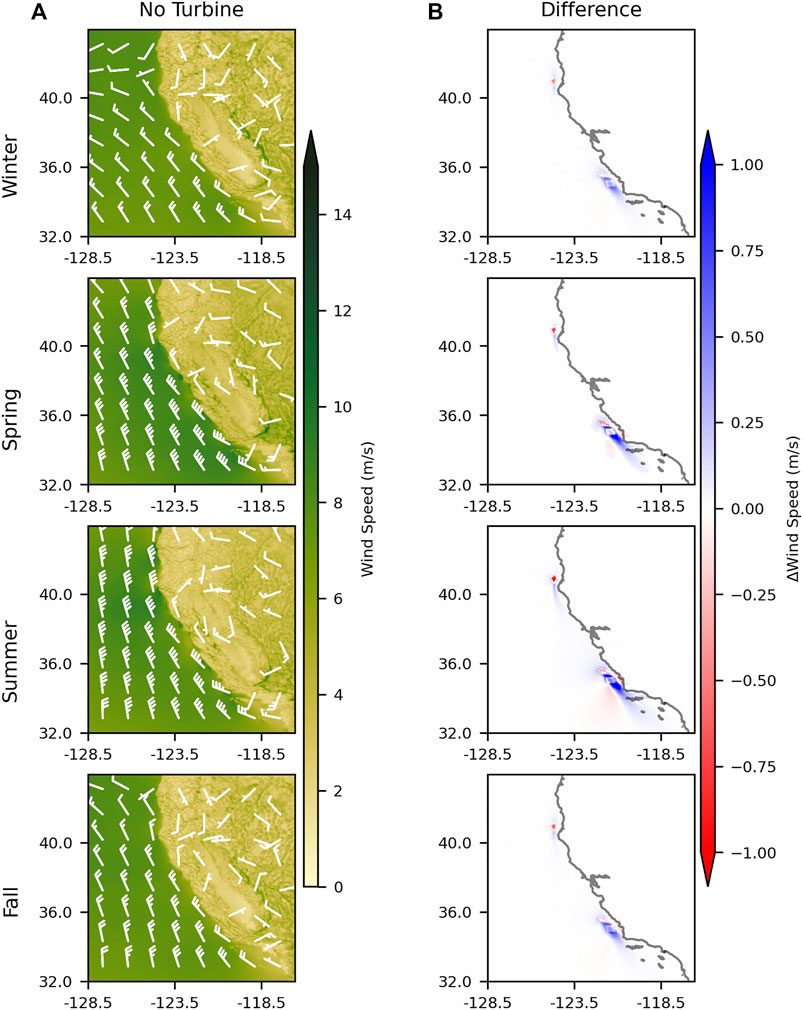
FIGURE 7. (A): Seasonal variability in modeled wind speeds in the absence of turbines and (B): wind speed differences (baseline minus turbine simulations).
Figure 8 shows a close-up of spring season wind speed changes around each of the call areas, at 10 m height above the sea surface. Also shown are wind barbs for the baseline condition only since no significant change in wind direction is observed in the presence of turbines. The increase in wind speeds in the immediate vicinity of the call areas is more apparent than in Figure 5, attributed to enhanced turbulent mixing of higher momentum air and channeling of winds around the turbine blade tips (Rajewski et al., 2014; Vanderwende et al., 2016). The dependence of the increase in wind speeds on background wind speeds is also evident, wherein the increase in wind speed inside the call area is more pronounced in the presence of lower background wind speeds (such as in Humboldt), while a higher background wind speed results in a smaller region in the call area that is subject to an increase in wind speeds.
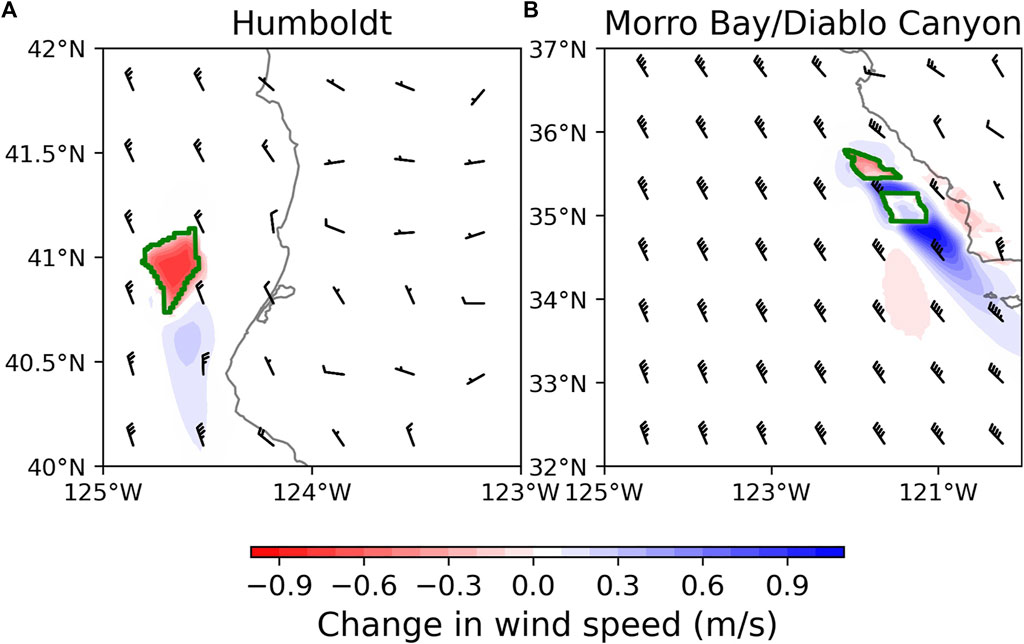
FIGURE 8. Average spring season differences (baseline minus turbine simulations) in wind speeds 10 m above the sea surface, around the call areas.
Given the changes in wind speeds, and due to the particular relevance of spatial scales of wind speed reductions on coastal upwelling, the area affected by wind speed reductions at each call area was calculated over the 13 years-long WRF simulation. Figure 9 shows the area over which wind speed reductions are larger than 0.5 m/s when applied to weekly-averaged wind speeds in the absence and presence of simulated wind turbines. The largest areas affected are around the Morro Bay/Diablo Canyon sites, with areas on the order of 12,500 km2, consistent with Figure 7 where wind speeds are observed to be largest in the summer. Also observed is a seasonal modulation of the area affected, consistent with the largest wind speeds occurring between April and September. With the exception of the large spike in April 1999 (due to sustained wind speeds exceeding 15 m/s within the Humboldt call area during that time period), effects observed at the Humboldt site are significantly smaller than those at the Morro Bay/Diablo Canyon sites, consistent with the smaller areal footprint of the Humboldt call area. Other spikes in August 1991 and February 1996 are also due to sustained wind speeds exceeding 15 m/s over a week-long period during which the areal average was computed.
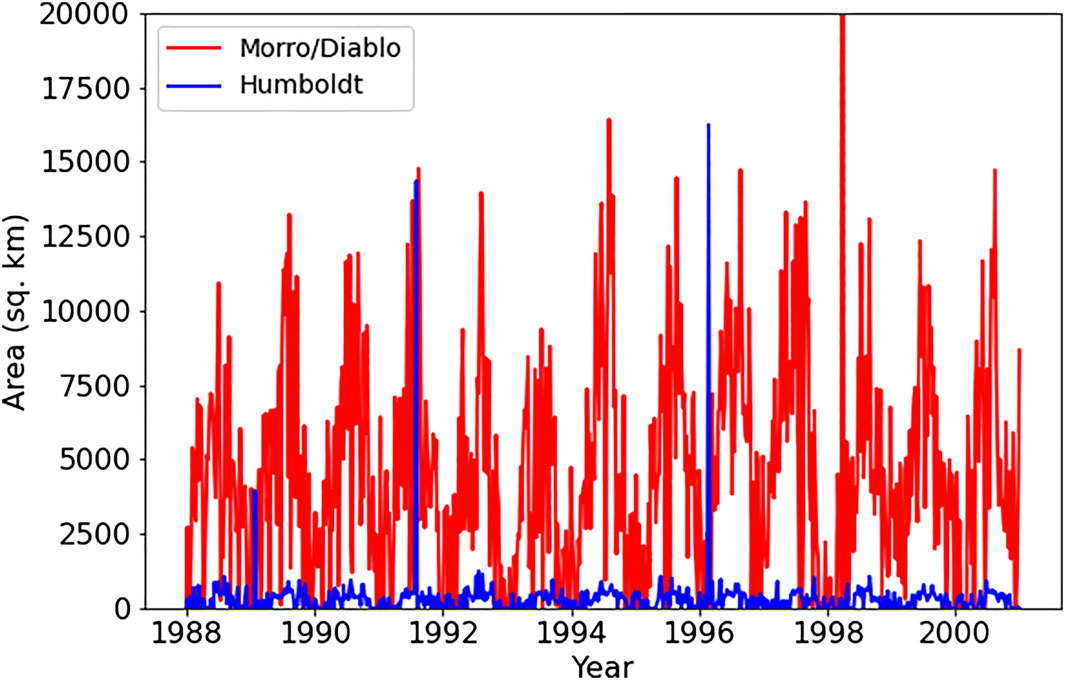
FIGURE 9. Area over which simulated wind speeds are reduced by more than 0.5 m/s around the Humboldt and Morro Bay/Diablo Canyon call areas.
Figure 10 shows springtime perturbations in the atmospheric fields of relevance as forcing fields to the ocean circulation model: zonal and meridional winds, specific humidity, downward longwave radiation, net shortwave radiation, precipitation, surface air pressure, and surface air temperature. Since changes to these parameters are significantly more apparent for the Morro Bay/Diablo Canyon nominated lease block than those for Humboldt, the following description of results applies only to the Morro Bay/Diablo Canyon region. Wind speed changes are mainly observed as a reduced westerly and northerly wind speeds, with a larger areal extent of the wake from northerly winds relative to the wake from westerly winds. There is little to no change in westerly wind speed within the Humboldt call area, while there is a modest increase in westerly wind speed within the Morro Bay call area. Northerly wind speeds are observed to show a modest increase within both the Humboldt and Morro Bay/Diablo Canyon call areas (note that wind speeds are positive to the north) while a reduction in northerly wind speeds are mainly observed in the wake region of the call areas. Changes in temperature are modest and on the order of 0.1°C. An increase in temperature is observed in the immediate vicinity of the turbine and in the downwind region, accompanied by a reduction in coastal temperatures. Regardless of the magnitude of the change, it is of note that the downwind temperature increase extends much further past the Channel Islands than the reduction in meridional wind speed. Perturbations in 10 m air pressure appear as an increase in air pressure in the vicinity of the call area, followed by a much more modest reduction downwind of the call area. Relative humidity shows a likely insignificant ( ∼0.05 g/kg) reduction downwind of Morro Bay/Diablo Canyon, with no measurable change in rainfall rate. No observeable change is seen in the net shortwave radiation while changes in the downward longwave radiation are on the order of 2 W/m2, relative to background values on the order of 300 W/m2.
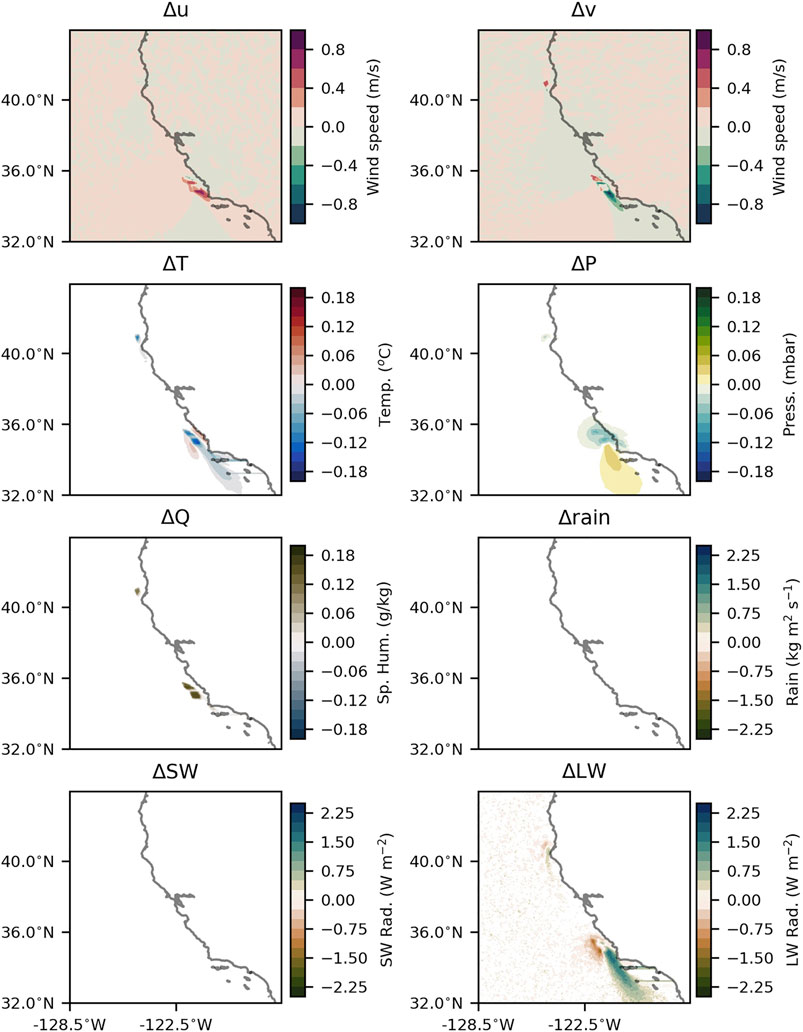
FIGURE 10. Differences in zonal and meridional winds (Δu, Δv), temperature (ΔT), pressure (ΔP), relative humidity (ΔQ), rainfall (Δrain), shortwave radiation (ΔSW), and longwave radiation (ΔLW) in the absence and presence of simulated wind turbines.
A tremendous wind energy resource, characterized by nearly year-round northwesterly winds, has been identified along the California coastline. As promising as this wind field is as a source of offshore wind energy, it also supports a thriving marine ecosystem through wind-induced coastal upwelling of cooler, nutrient-rich waters. Therefore, this study was designed to consider the potential effects of offshore wind energy extraction on the strength of California coastal upwelling. An atmospheric circulation model is applied to simulate changes to wind fields following the introduction of wind farms at Humboldt, Morro Bay, and Diablo Canyon, all of which were part of the original set of call areas at the time this study commenced. Simulated turbine arrays assume full call area build-out and hence, these results can be considered to represent an upper-bound on potential upwelling effects of California offshore wind projects, and consistent with the project design envelope approach favored in drafting offshore wind construction and operation plans (Tetra Tech, 2021).
Here, a first step towards addressing this environmental concern is taken through the application of the WRF atmospheric model with the WFP module to simulate and evaluate the potential effects of wind turbine arrays on atmospheric fields that will form the forcing fields to an ocean circulation model. The WRF-WFP model was run with boundary conditions and physics parameterizations that are identical to the previously validated model that was reported by Optis et al. (2020b). The model was run without and with simulated wind turbines at a temporal resolution of 3 h for a period of 13 years (1988–2000). WRF-WFP was applied to a full build-out of wind turbines at the Humboldt, Morro Bay, and Diablo Canyon call areas that included 152, 230, and 495 turbines spaced nine turbine diameters apart, respectively. This methodology has been previously applied to evaluate the effects of wind farms on atmospheric circulation at a number of onshore and offshore geographic locations (Roy and Traiteur, 2010; Lee and Lundquist, 2017; Huang and Hall, 2015; Duin, 2019), all of which have documented reductions in wind fields, the formation of vortices, and changes to turbulent kinetic energy in the lee of the wind farms. This study further corroborates these results, while evaluating atmospheric changes of particular relevance to wind-forced ocean circulation as a result of wind farm placement in identified U.S. West Coast offshore wind call areas.
WRF-WFP model results were evaluated over multiple temporal and spatial scales. Seasonal patterns in wind field reductions were observed, with reductions being most pronounced during the spring and summer months (April-September) when wind speeds were strongest. Changes to wind speeds and other atmospheric forcing fields were considerably more pronounced for the Morro Bay/Diablo Canyon call areas, relative to the Humboldt call area. This is reasonable given that the size and number of turbines for Humboldt is about four times smaller than the combined Morro Bay/Diablo Canyon site. Wind speed reductions were observed in excess of 1 m/s, or roughly 5% of maximum wind speeds off Central California. The height extent of wind speed reductions in the Morro Bay/Diablo Canyon call areas was observed at about 600 m above the sea surface. While modifications to the wind field were primarily in the form of wind speed deficits, a modest increase in wind speeds was observed within the immediate vicinity of the wind turbines. These low level increases have been observed in both numerical model studies (Vanderwende et al., 2016) and using measurements (Rajewski et al., 2014), and attributed to enhanced turbulent mixing of higher-momentum air downward toward the sea surface and the channeling of winds at the sea surface below the rotor as a result of pressure perturbations.
The horizontal extent of the wake in wind speed reductions for the Morro Bay/Diablo Canyon call areas is approximately 200 km (for a threshold of 0.2 m/s), extending south past the Channel Islands. With a predominantly northwesterly wind direction, the wind speed deficit 10 m above the sea surface is qualitatively similar to measured offshore wind farm wakes by Cañadillas et al. (2020). While the N-3 and N-4 wind farm clusters in the North Sea have many fewer turbines with less nameplate capacity than the nominated Morro Bay/Diablo Canyon lease blocks, Cañadillas et al. (2020) observed that under stable atmospheric conditions, 95% wake recovery, calculated as the ratio of the local velocity to the reference wind velocity U/U∞, was only achieved after 55 km. Analytic models of wake recovery, fitted to available data, also suggest that the wake deficit recovery can follow a slow exponential trend (Emeis, 2018). In the presence of low turbulence and stratified conditions, the long extent of wakes far downstream of wind farms has been observed. These areal extents are on the order of several times the modified Rossby radii of deformation (10–20 km in these regions, Szoeke and Richman, 1984). This is the spatial scale at which rotational phenomena such as coastal upwelling occur. Of course, a more definitive and quantitative characterization of effects of wind turbine arrays on upwelling will require application of an ocean circulation model, which is the next stage of this study.
Additional wind farm-induced changes are observed in temperature and relative humidity fields around the Morro Bay/Diablo Canyon call areas, although these perturbations are small relative to their respective baseline values. The magnitude of changes in temperature and relative humidity are similar to those reported by Huang and Hall (2015) and likely to have a much lesser impact on upwelling dynamics than wind stress reductions. These, and additional atmospheric changes observed in model results are: cooling effects on the order of 0.1°C (relative to a background temperature that ranges from 12 to 20°C), surface pressure perturbations on the order of 0.06 mbar (relative to a background air pressure on the order of 1,000 mbar), changes in specific humidity on the order of 0.1 g/kg (relative to a background range of 0–10 g/kg), and perturbations to the downward longwave radiation on the order of 2 W/m2 (relative to a background on the order of 300 W/m2). No measurable changes were found in precipitation and net shortwave radiation fields.
As with all modeling efforts, uncertainties are undoubtedly present. These include discretization effects (i.e., the finite resolution of the atmospheric circulation model) that fail to resolve finer scale turbulence processes and the cascading effects of these on larger scale processes. The use of a one-way coupled model (i.e., no ocean feedback on the lower atmospheric boundary layer) neglects well-known effects of upper ocean dynamics such as waves and sea surface roughness (Janssen and Viterbo, 1996) on the lower atmospheric boundary layer. The use of a fully-coupled model is, however, still an active area of research and not suitable for a study focused on a specific question such as this study. Further, the use of identical modeling approaches between simulations without and with turbines to evaluate the effects of wind farms on upwelling has the advantage of yielding comparative insights given that identical uncertainties exist in both the control run (no turbines) and in the modified state estimates (turbines present).
Future work involves extending this study over a longer period (1988–2012). Large scale wind patterns (see, for e.g., Trenberth and Hurrell (1994); Alexander et al. (2002)) are modulated by decadal phenonmena such as El Niño, La Niña and the Pacific Decadal Oscillation. Therefore, extending the study over a longer period will not only allow for a deeper look into seasonal variability, but also provide insights into interannual reductions in wind fields and comparison to natural observed variability in California coastal wind fields. Further, a number of different model scenarios will be run to address modifications to the identified call areas (e.g., delisting Diablo Canyon, modifications in size and shape to Morro Bay [Morro Bay 376], and potential addition of a Crescent City call area), and to explore various turbine characteristics (hub height, rotor diameter, thrust and power coefficient curves) and turbine array configurations. Finally, a companion paper to this effort will present potential effects of wind field reductions on California coastal wind-driven upwelling transport and nutrient supply to the euphotic zone through application of the interannual wind fields presented in this paper as forcing fields to an ocean circulation model.
The raw data supporting the conclusion of this article will be made available by the authors, without undue reservation.
KR and GC conceived this study; CC and KR conducted the modeling and analysis; GC, LC, and JR provided technical and programmatic oversight. All authors contributed to manuscript revision, read, and approved the submitted version.
The team thanks the California Energy Commission for supporting this work through cooperative agreement EPC-19-009.
Authors KR and GC are employed by Integral Consulting Inc.
The remaining authors declare that the research was conducted in the absence of any commercial or financial relationships that could be construed as a potential conflict of interest.
All claims expressed in this article are solely those of the authors and do not necessarily represent those of their affiliated organizations, or those of the publisher, the editors and the reviewers. Any product that may be evaluated in this article, or claim that may be made by its manufacturer, is not guaranteed or endorsed by the publisher.
We are also deeply grateful to Mike Optis at the National Renewable Energy Laboratory and Julie Lundquist at University of Colorado, Boulder, for their helpful insights in configuring and interpreting WRF-WFP results. Jerome Carman and Arne Jacobson at Humboldt State University provided the turbine locations for the Humboldt call area. We have greatly benefited from input by our California Energy Commission Agreement Manager, David Stoms, and our project technical advisory committee: Genevra Harker-Klimeš, Jaime Jahncke, Fayçal Kessouri, Sharon Kramer, Chris Potter, Tyler Studds, and Susan Zaleski. Sandia National Laboratories is a multimission laboratory managed and operated by National Technology & Engineering Solutions of Sandia, LLC, a wholly owned subsidiary of Honeywell International Inc., for the U.S. Department of Energy’s National Nuclear Security Administration under contract DE-NA0003525.
Ainslie, J. F. (1988). Calculating the Flowfield in the Wake of Wind Turbines. J. Wind Eng. Industrial Aerodynamics 27, 213–224. doi:10.1016/0167-6105(88)90037-2
Alexander, M. A., Bladé, I., Newman, M., Lanzante, J. R., Lau, N.-C., and Scott, J. D. (2002). The Atmospheric Bridge: The Influence of ENSO Teleconnections on Air-Sea Interaction Over the Global Oceans. J. Clim. 15, 2205–2231. doi:10.1175/1520-0442(2002)015<2205:tabtio>2.0.co;2
Baidya Roy, S., Pacala, S. W., and Walko, R. L. (2004). Can Large Wind Farms Affect Local Meteorology? J. Geophys. Res. 109. doi:10.1029/2004JD004763
Baidya Roy, S., and Traiteur, J. J. (2010). Impacts of Wind Farms on Surface Air Temperatures. Proc. Natl. Acad. Sci. U.S.A. 107, 17899–17904. doi:10.1073/pnas.1000493107
Beiter, P., Musial, W., Duffy, P., Cooperman, A., Shields, M., Heimiller, D., et al. (2020). The Cost of Floating Offshore Wind Energy in California Between 2019 and 2032. Golden, CO, USA: Tech. Rep., National Renewable Energy Lab.. doi:10.2172/1710181
Blaylock, M. L., Martinez-Tossas, L., Sakievich, P., Houchens, B. C., Cheung, L., Brown, K., et al. (2022). “Validation of Actuator Line and Actuator Disk Models with Filtered Lifting Line Corrections Implemented in Nalu-Wind Large Eddy Simulations of the Atmospheric Boundary Layer,” in AIAA SCITECH 2022 Forum. doi:10.2514/6.2022-1921
Burton, R. S. (1998). Intraspecific Phylogeography Across the Point Conception Biogeographic Boundary. Evolution 52, 734–745. doi:10.1111/j.1558-5646.1998.tb03698.x
Cañadillas, B., Foreman, R., Barth, V., Siedersleben, S., Lampert, A., Platis, A., et al. (2020). Offshore Wind Farm Wake Recovery: Airborne Measurements and its Representation in Engineering Models. Wind Energy 23, 1249–1265.
Checkley, D. M., and Barth, J. A. (2009). Patterns and Processes in the California Current System. Prog. Oceanogr. 83, 49–64. doi:10.1016/j.pocean.2009.07.028
Churchfield, M. J., Lee, S., Michalakes, J., and Moriarty, P. J. (2012). A Numerical Study of the Effects of Atmospheric and Wake Turbulence on Wind Turbine Dynamics. J. Turbul. N14. doi:10.1080/14685248.2012.668191
Duin, M. (2019). Effect of Wind Farms at the North Sea on Meteorological Conditions in the Netherlands. Master’s thesis.
Emeis, S. (2018). Wind Energy Meteorology: Atmospheric Physics for Wind Power Generation. Berlin, Germany: Springer.
Eriksson, O., Lindvall, J., Breton, S.-P., and Ivanell, S. (2015). Wake Downstream of the Lillgrund Wind Farm - A Comparison Between LES Using the Actuator Disc Method and a Wind Farm Parametrization in WRF. J. Phys. Conf. Ser. 625, 012028. doi:10.1088/1742-6596/625/1/012028
Fitch, A. C., Olson, J. B., Lundquist, J. K., Dudhia, J., Gupta, A. K., Michalakes, J., et al. (2012). Local and Mesoscale Impacts of Wind Farms as Parameterized in a Mesoscale NWP Model. Mon. Weather Rev. 140, 3017–3038. doi:10.1175/MWR-D-11-00352.1
Hersbach, H., Bell, B., Berrisford, P., Biavati, G., Horányi, A., Muñoz Sabater, J., et al. (2018). “ERA5 Hourly Data on Pressure Levels from 1979 to Present,” in Copernicus Climate Change Service (C3S) Climate Data Store (CDS).
Huang, H.-Y., and Hall, A. D. (2015). Preliminary Assessment of Offshore Wind Development Impacts on Marine Atmospheric Environment: Final Project Report. California: California Energy Commission, Energy Research and Development Division.
Huyer, A. (1983). Coastal Upwelling in the California Current System. Prog. Oceanogr. 12, 259–284. doi:10.1016/0079-6611(83)90010-1
Janssen, P. A. E. M., and Viterbo, P. (1996). Ocean Waves and the Atmospheric Climate. J. Clim. 9, 1269–1287. doi:10.1175/1520-0442(1996)009<1269:owatac>2.0.co;2
Jiménez, P. A., Navarro, J., Palomares, A. M., and Dudhia, J. (2015). Mesoscale Modeling of Offshore Wind Turbine Wakes at the Wind Farm Resolving Scale: a Composite-Based Analysis with the Weather Research and Forecasting Model Over Horns Rev. Wind Energy 18, 559–566. doi:10.1002/we.1708
Keith, D. W., DeCarolis, J. F., Denkenberger, D. C., Lenschow, D. H., Malyshev, S. L., Pacala, S., et al. (2004). The Influence of Large-Scale Wind Power on Global Climate. Proc. Natl. Acad. Sci. U.S.A. 101, 16115–16120. doi:10.1073/pnas.0406930101
Lee, J. C. Y., and Lundquist, J. K. (2017). Evaluation of the Wind Farm Parameterization in the Weather Research and Forecasting Model (Version 3.8.1) with Meteorological and Turbine Power Data. Geosci. Model. Dev. 10, 4229–4244. doi:10.5194/gmd-10-4229-2017
Martinez, L., Leonardi, S., Churchfield, M., and Moriarty, P. (2012). “A Comparison of Actuator Disk and Actuator Line Wind Turbine Models and Best Practices for Their Use,” in 50th AIAA Aerospace Sciences Meeting including the New Horizons Forum and Aerospace Exposition, 900. doi:10.2514/6.2012-900
Miller, L. M., Brunsell, N. A., Mechem, D. B., Gans, F., Monaghan, A. J., Vautard, R., et al. (2015). Two Methods for Estimating Limits to Large-Scale Wind Power Generation. Proc. Natl. Acad. Sci. U.S.A. 112, 11169–11174. doi:10.1073/pnas.1408251112
Musial, W., Beiter, P., Tegen, S., and Smith, A. (2016). Potential Offshore Wind Energy Areas in California: An Assessment of Locations, Technology, and Costs. Golden, CO, USA: Tech. Rep., National Renewable Energy Lab.
NMFS-F/SPO-187A, N. T. M. (2018). Fisheries Economics of the United States 2016. Economics and Sociocultural Status and Trends Series. Golden, CO, USA: Tech. Rep., National Oceanic and Atmospheric Administration, National Marine Fisheries Service.
Optis, M., Optis, M., Kumler, A., Scott, G. N., Debnath, M. C., and Moriarty, P. J. (2020a). Validation of RU-WRF, the Custom Atmospheric Mesoscale Model of the Rutgers Center for Ocean Observing Leadership. Golden, CO, USA: Tech. Rep., National Renewable Energy Lab.
Optis, M., Rybchuk, A., Bodini, N., Rossol, M., and Musial, W. (2020b). 2020 Offshore Wind Resource Assessment for the California Pacific Outer Continental Shelf. Golden, CO: Tech. Rep., National Renewable Energy Laboratory. NREL/TP-5000-77642.
Platis, A., Siedersleben, S. K., Bange, J., Lampert, A., Bärfuss, K., Hankers, R., et al. (2018). First In Situ Evidence of Wakes in the Far Field Behind Offshore Wind Farms. Sci. Rep. 8, 2163. doi:10.1038/s41598-018-20389-y
Rajewski, D. A., Takle, E. S., Lundquist, J. K., Prueger, J. H., Pfeiffer, R. L., Hatfield, J. L., et al. (2014). Changes in Fluxes of Heat, H2o, and Co2 Caused by a Large Wind Farm. Agric. For. Meteorology 194, 175–187. doi:10.1016/j.agrformet.2014.03.023
Severy, M., and Garcia, T. (2020). “Description of Study Assumptions,” in California North Coast Offshore Wind Studies. Humboldt. Editors M. Severy, G. Alva, G. Chapman, M. Cheli, T. Garcia, C. Ortegaet al. (CA: Schatz Energy Research Center).
Skamarock, W. C., Klemp, J. B., Dudhia, J., Gill, D. O., Liu, Z., Berner, J., et al. (2019). A Description of the Advanced Research WRF Model Version 4. Boulder, CO, USA: National Center for Atmospheric Research, 145.
Sprague, M. A., Ananthan, S., Vijayakumar, G., and Robinson, M. (2020). Exawind: A Multifidelity Modeling and Simulation Environment for Wind Energy. J. Phys. Conf. Ser. 1452, 012071. doi:10.1088/1742-6596/1452/1/012071
Szoeke, R. A. D., and Richman, J. G. (1984). On Wind-Driven Mixed Layers with Strong Horizontal Gradients-A Theory with Application to Coastal Upwelling. J. Phys. Oceanogr. 14, 364–377. doi:10.1175/1520-0485(1984)014<0364:owdmlw>2.0.co;2
Tetra Tech (2021). Empire Offshore Wind, Empire Wind Project EW1 and EW2 Construction and Operations Plan. Washington, D.C: Tech. Rep., Bureau of Ocean Energy Management.
Tomaszewski, J. M., and Lundquist, J. K. (2020). Simulated Wind Farm Wake Sensitivity to Configuration Choices in the Weather Research and Forecasting Model Version 3.8.1. Geosci. Model. Dev. 13, 2645–2662. doi:10.5194/gmd-13-2645-2020
Trenberth, K. E., and Hurrell, J. W. (1994). Decadal Atmosphere-Ocean Variations in the Pacific. Clim. Dyn. 9, 303–319. doi:10.1007/bf00204745
Vanderwende, B. J., Kosović, B., Lundquist, J. K., and Mirocha, J. D. (2016). Simulating Effects of a Wind‐Turbine Array Using LES and RANS. J. Adv. Model. Earth Syst. 8, 1376–1390. doi:10.1002/2016ms000652
Wiser, R., Jenni, K., Seel, J., Baker, E., Hand, M., Lantz, E., et al. (2016). Forecasting Wind Energy Costs and Cost Drivers: The Views of the World’s Leading Experts.
Keywords: offshore wind, environmental effect analysis, wake effect, weather research and forecasting (WRF) model, wind farm (WF), atmospheric model
Citation: Raghukumar K, Chartrand C, Chang G, Cheung L and Roberts J (2022) Effect of Floating Offshore Wind Turbines on Atmospheric Circulation in California. Front. Energy Res. 10:863995. doi: 10.3389/fenrg.2022.863995
Received: 27 January 2022; Accepted: 25 April 2022;
Published: 1 June 2022.
Edited by:
Joanna Staneva, Institute of Coastal Systems Helmholtz Centre Hereon, GermanyReviewed by:
Yongxiang Huang, Xiamen University, ChinaCopyright © 2022 Raghukumar, Chartrand, Chang, Cheung and Roberts. This is an open-access article distributed under the terms of the Creative Commons Attribution License (CC BY). The use, distribution or reproduction in other forums is permitted, provided the original author(s) and the copyright owner(s) are credited and that the original publication in this journal is cited, in accordance with accepted academic practice. No use, distribution or reproduction is permitted which does not comply with these terms.
*Correspondence: Kaustubha Raghukumar, a3JhZ2h1a3VtYXJAaW50ZWdyYWwtY29ycC5jb20=
Disclaimer: All claims expressed in this article are solely those of the authors and do not necessarily represent those of their affiliated organizations, or those of the publisher, the editors and the reviewers. Any product that may be evaluated in this article or claim that may be made by its manufacturer is not guaranteed or endorsed by the publisher.
Research integrity at Frontiers

Learn more about the work of our research integrity team to safeguard the quality of each article we publish.