- 1Key Laboratory of Exploration Technologies for Oil and Gas Resources, Ministry of Education, Yangtze University, Wuhan, China
- 2College of Geophysics and Oil Resources, Yangtze University, Wuhan, China
In the production development stages of volatile oil reservoirs and condensate gas reservoirs, especially in the early stages of production, the phenomenon of high gas–oil ratio often occurs. As a result, the prediction results of oil and gas are greatly deviated from the actual situation, which seriously affects the implementation of potential excavation and increases production operation for condensate gas reservoirs. Therefore, the accurate identification of condensate gas and volatile oil is the key to improve the development efficiency in condensate reservoirs. However, due to the similar geophysical logging response characteristics for condensate gas, volatile oil, and light oil reservoirs, the qualitative identification effect only based on conventional logging is not ideal. Therefore, we propose a method to calculate the gas–oil ratio by introducing gas logging information and use the gas–oil ratio quantitative calculation results to identify condensate gas and volatile oil layers. First, we establish a physical model of the formation components of the condensate gas reservoir. Based on this physical model, we establish the response equations of various logging tools and evaluate the correlation between the gas logging information and the production gas–oil ratio to establish the response equation of gas logging. Then, we comprehensively use the well logging and gas logging response equations to establish an optimization mathematical model, solve the optimization objective function, obtain the relative content of natural gas and movable oil in the formation to calculate the gas–oil ratio parameters, and finally use this calculation result of the gas–oil ratio to quantitatively identify the fluid type. The application results show that the gas–oil ratio quantitative calculation method that we proposed can calculate the gas–oil ratio parameter accurately, and the calculation results are consistent with the formation testing data, which provides technical support for the identification of complex fluid properties in condensate gas reservoirs.
Introduction
Condensate gas reservoir is a special kind of reservoir between an oil reservoir and a gas reservoir. Under the condition of high temperature and pressure in deep formation, condensate gas reservoir exists in the form of a single gas phase. In the development process, with the continuous reduction of formation pressure and temperature, the heavy hydrocarbon components in the gas phase will change in phase state, precipitate from the gas phase and condense into liquid condensate to form gas–liquid two-phase (Orangi et al., 2011; Panja et al., 2019; Tang et al., 2021). By the end of 2020, the total recoverable resources of conventional condensate in the world were 534.9 × 10⁸ t, and the cumulative output was 55.4 × 10⁸ t, accounting for 10.4% and indicating that the discovered condensate oil and gas resources still have great development potential. The recoverable resources to be discovered are 241.8.9 × 108 t, accounting for 45.2% and indicating that the condensate oil and gas resources still have great exploration potential (Tong et al., 2014; Tong et al., 2018; Wang et al., 2021). The newly discovered condensate oil and gas fields in China are mainly located in the Tarim Basin and Bohai Bay Basin (Hu et al., 2020; Yang et al., 2020; He et al., 2021). There are many transition types of fluids in the condensate gas reservoir, which have the characteristics of complex phase behavior and hydrocarbon components. These reservoir characteristics lead to a large deviation between the prediction result and the actual situation in the condensate gas reservoir, which seriously affects the implementation of potential tapping and well stimulation. So, accurate identification of hydrocarbon types is the key issue to improve the development efficiency of the condensate gas reservoir. The main methods to identification condensate gas include phase behavior research methods such as oil and gas reservoir temperature–pressure phase diagram and empirical statistical methods based on the content of methane (C1), ethane (C2), propane (C3), butane (C4), and pentane (C5), formation fluid density, component average molecular weight, and production gas oil ratio Among them, the identification result of phase state research method is more accurate, but it needs a large number of field sampling and experimental data. Empirical statistical methods need less data, but the reliability of the identification results will be reduced. In recent years, some researchers have tried to use logging information to quantitatively distinguish complex hydrocarbon types; for example, Gao et al. (2003) proposed a quantitative calculation of the gas–oil ratio method using the logging information to identify condensate gas reservoirs. Zhao et al. (2006) introduced the genetic algorithm into optimization of logging data processing due to the characteristics of global optimization in genetic algorithm. On this basis, they calculated the surface gas–oil ratio and achieved the purpose of identifying condensate gas reservoirs. Feng et al. (2020) used the logging information to calculate the relative content of CO2 and apparent porosity to identify CO2 gas reservoirs comprehensively. These attempts provide the ideas and methods for simple, rapid, and accurate identification of complex hydrocarbon types in reservoirs.
Because the condensate gas reservoir exists in the form of a single gas phase under the conditions of formation temperature and pressure, its geophysical logging response characteristics are similar to the conventional gas reservoirs, which leads to the unreliable discrimination results of the condensate gas reservoirs through only conventional logging information. Compared with conventional logging data, gas logging can directly obtain the relative content of C1–C5 components of the hydrocarbon reservoir and can more intuitively reflect the characteristics of reservoir fluid properties. So, the gas logging information is also widely used in complex hydrocarbon discrimination. For example, Liu et al. (2017) used the interpretation chart of gas logging to qualitatively identify condensate gas reservoir and light oil reservoir. Xu et al. (2019) proposed a method for identifying buried-hill condensate gas reservoirs in BZ 19-6 structure based on the statistical analysis of the geochemical logging data. Wei and Li (2020) applied similar conventional logging and mud logging comprehensive identification technology to the western South China Sea and achieved good application results in the identification of condensate gas layers and volatile oil reservoirs. Taking advantage of the advantages of the gas logging information in complex hydrocarbon identification, and based on the above research, we propose a gas–oil ratio calculation method which introduces gas logging data and uses the quantitative calculation results of the gas–oil ratio to distinguish the condensate gas reservoir.
Optimization Mathematical Model for Quantitative Calculation of Gas–Oil Ratio
For the condensate gas reservoirs, the formation components mainly include immovable oil, movable oil, movable water, natural gas, shale, and various skeletal minerals of rocks (Gao et al., 1995; Li et al., 2020; Zhao et al., 2020). The relative contents of these components in the formation are defined as xor,xom,xfw,xgas,xsh,xma, and the formation component volume model of the condensate gas reservoirs is as shown in Eq. 1:
According to the formation component volume model, we can get the general response equation as Eq. 2 for various of logging instruments:
where Aij is the response value of the ith logging instrument to the jth component; m is the number of logging types, and B is the response value of the logging instruments to the formation.
The equation set of the model can be written as:
where c, xmaxj are both constants. In the formation component analysis program, c = 1,xmaxj is the maximum relative volume of the j-th component. By solving Eq. 3, which consists of m equations, the relative contents of all of components in the formation can be obtained.
According to the ideal gas state equation, the relationship between the adiabatic bulk modulus, density, temperature, and pressure, as well as compressibility coefficient of gases, can be derived (Batzle and Wang 1992; Li, 2006):
where p is the pressure, MPa; V is the molar volume, the value between 0 and 1; R is the gas constant, dimensionless; Ta is the absolute temperature, K; and Z is the gas compression factor.
The volume of the natural gas under the surface condition Vgs can be obtained from the volume of the natural gas under the formation condition Vgf from Eq. 4:
where Ts is the surface temperature, K; Pgf is the formation pressure, which is the pressure acting on the fluid in the rock pores, MPa; Tf is the formation temperature, which is converted from the surface temperature and the ground temperature gradient, K; Zf is the compression factor of the natural gas at the well bottom, zero dimension; and Pgs is the surface pressure, MPa.
ROG is the ratio of the normal gas volume (Vgs) and the movable oil volume (Vom) under ground conditions:
The volume of movable oil on the ground is approximately equal to that under the ground. Assuming that the rock volume is Vrock, then Vgf = xgasVrock, Vom = xomVrock. Bringing Eq. 5 into Eq. 6, we get the calculation formula of the gas–oil ratio as follows:
where xgas is the relative content of natural gas in the formation, and xom is the relative content of movable oil in the formation.
Introducing Gas Logging Information Into the Gas–Oil Ratio Calculation Process
Gas Logging and Logging Response Characteristics of Condensate Gas Reservoir
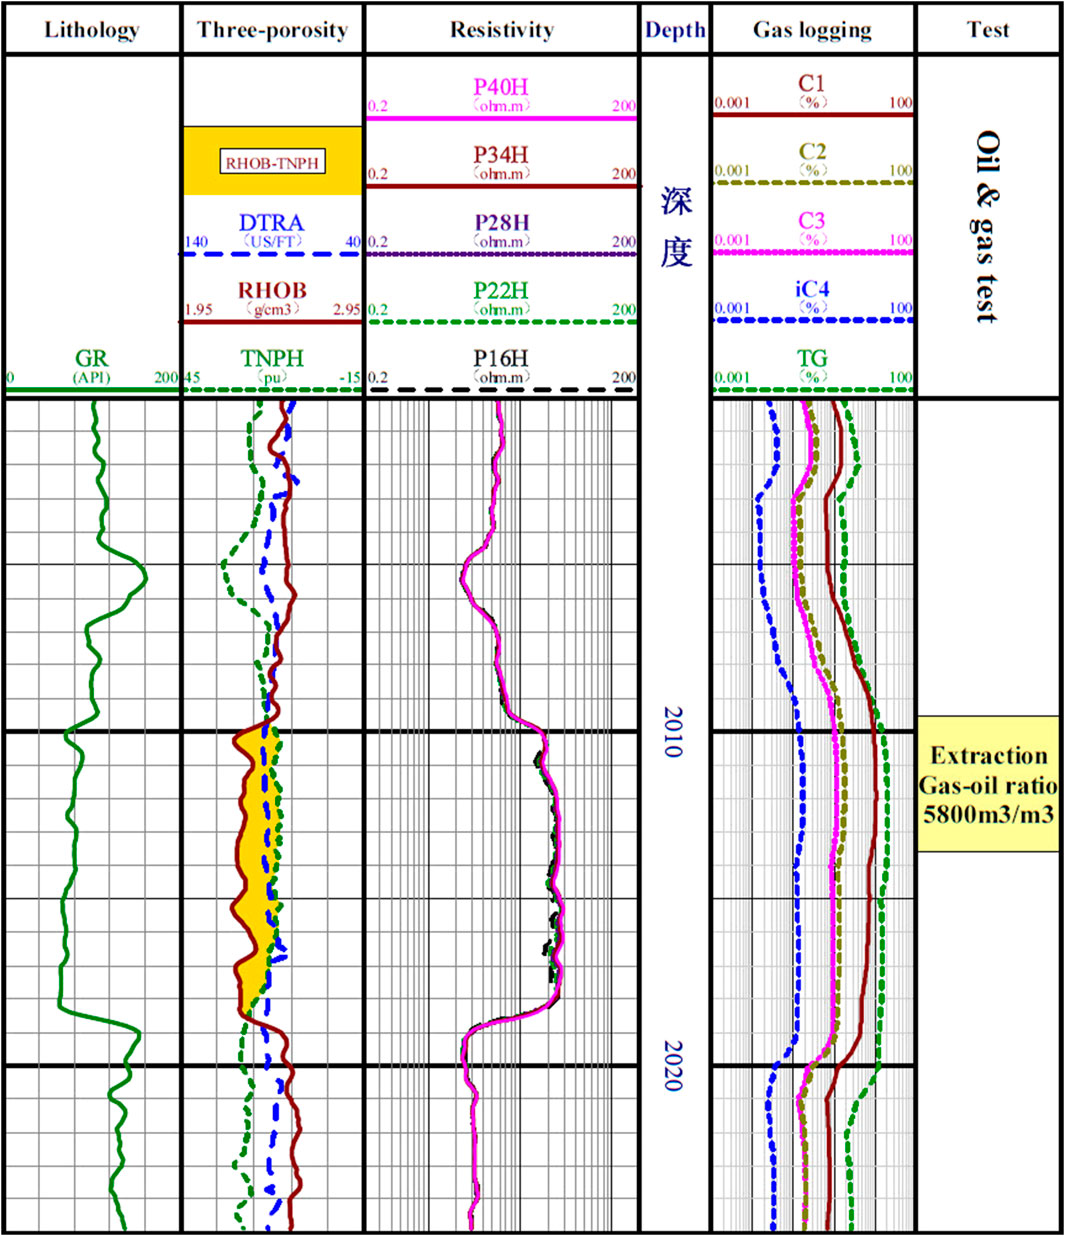
Figure 1 shows conventional logging and gas logging information at the depth of 2000–2025 m in well O-A1 of WZ oilfield in the western South China Sea. The production gas–oil ratio of the reservoir at 2007–2018.4 m is 5800 m3/m3. This layer is a condensate gas layer according to the value of the production gas–oil ratio. The fourth track in Figure 1 is the gas logging data, which displays the information of methane C1, ethane C2, propane C3, isobutane iC4, and total hydrocarbon TG. The gas logging response characteristics of the 2007–2018.4 m condensate gas layer are: the total hydrocarbon TG content is high and the C1 content is close to the total hydrocarbon TG, indicating that the hydrocarbon components in this interval are mainly light hydrocarbons, and the heavy hydrocarbon content is low. The content of light hydrocarbons in conventional oil layers or volatile oil layers is less than that in condensate gas layers, therefore, the C1 content in these two types of hydrocarbon reservoirs is significantly lower than that of the total hydrocarbons TG.
Figure 2 shows a histogram of the average value of Tg/C1 and (C1 + C2)/(C3 + C4 + C5) corresponding to conventional oil, volatile oil, and condensate gas layers in O oilfield, where well O-A1 is located. In this figure, the average value of Tg/C1 at the condensate gas reservoir is obviously lower than at the conventional oil reservoir and the volatile oil reservoir, while the average value of (C1 + C2)/(C3 + C4 + C5) at the condensate gas reservoir is higher than at the conventional oil reservoir and volatile oil reservoir. It shows that the light hydrocarbon content of the condensate gas reservoir is obviously higher than that of the conventional oil reservoir and volatile oil reservoir, and Tg/C1 can be used as a sensitive parameter for condensate gas reservoir identification.
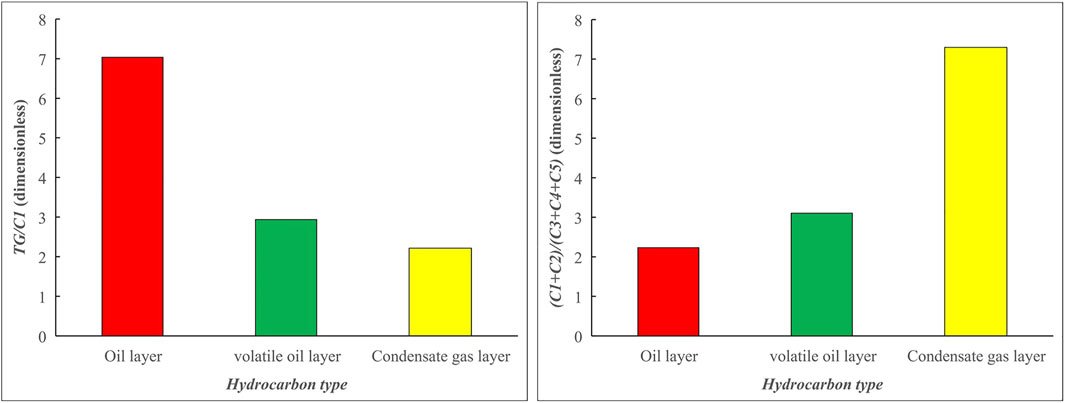
FIGURE 2. The histogram of Tg/C1 and (C1 + C2)/(C3 + C4 + C5) corresponding to different hydrocarbon types in O oilfield.
Correlation Analysis of Production Gas–Oil Ratio and Gas Logging Parameters in Condensate Gas Reservoir
There are obvious differences in the response characteristics of the gas logging of condensate reservoir, conventional reservoir, and volatile oil reservoir in the O oilfield. The C1 content of the light hydrocarbons in the condensate gas reservoir is relatively high, which is close to the content of the total hydrocarbon Tg, so the Tg/C1 value in the condensate gas reservoir is small. We collected and sorted out the production gas–oil ratio data of condensate gas, conventional oil, and volatile oil layers in O oilfield and analyzed the correlation between the production gas–oil ratio of the layers of different hydrocarbon types and gas logging parameters. Figure 3 shows the correlation between the production gas–oil ratio and Tg/C1 of the layers with different hydrocarbon types in the O oilfield. We can see that the Tg/C1 of the condensate gas, the volatile oil, and the conventional oil layers increases monotonically with the decrease of production gas–oil ratio. There is a clear correlation between the production gas–oil ratio and Tg/C1.
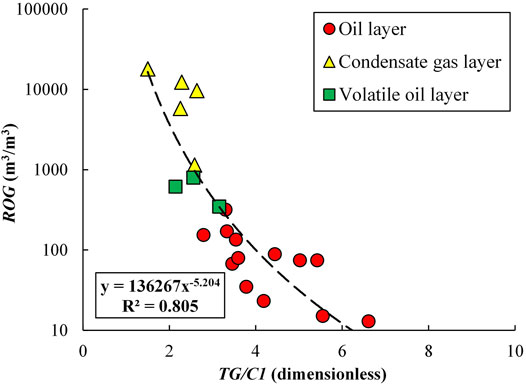
FIGURE 3. Correlation between production gas-oil ratio and Tg/C1 of the layers of different hydrocarbon types in O oilfield.
To further highlight the difference between light and heavy hydrocarbon components in different fluid types of O oilfield reservoirs, we introduce two parameters, Hheavy and Hlight, which reflect the components of light and heavy hydrocarbons, and their expressions are as follows:
where C1, C2, C3, and C4 are the content values of methane, ethane, propane, and butane in gas logging, respectively.
We collected the production gas–oil ratio and gas logging data of different hydrocarbon types in O oilfield and calculated the Hheavy and Hlight parameters of the corresponding layers; the statistical data of this are given in Table 1.
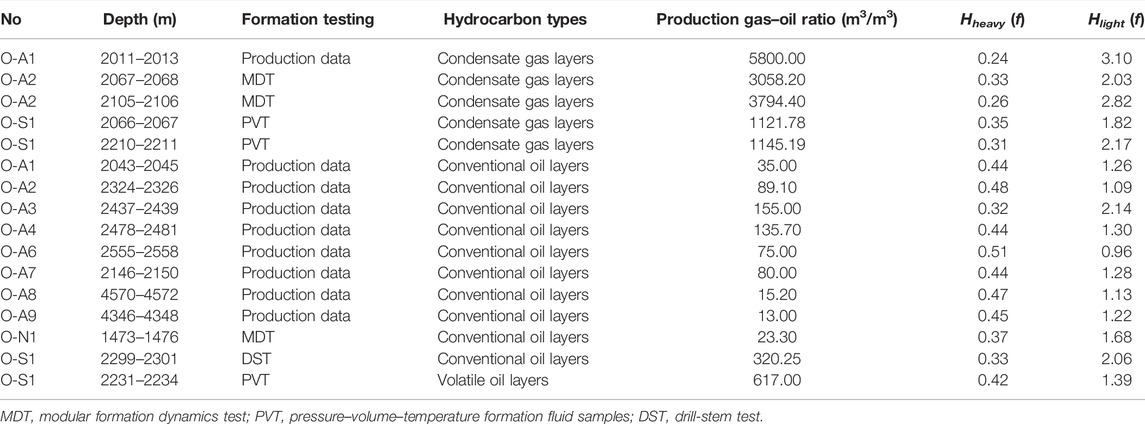
TABLE 1. Statistical table of production gas-oil ratio and gas logging data for different hydrocarbon types in O oilfield.
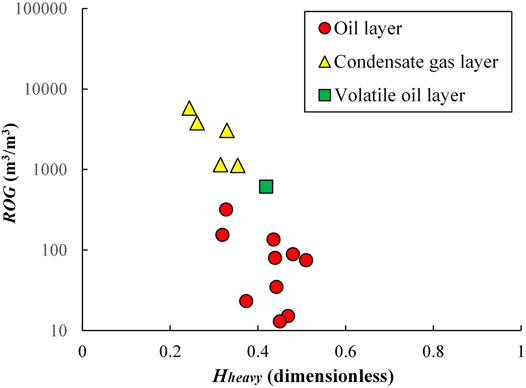
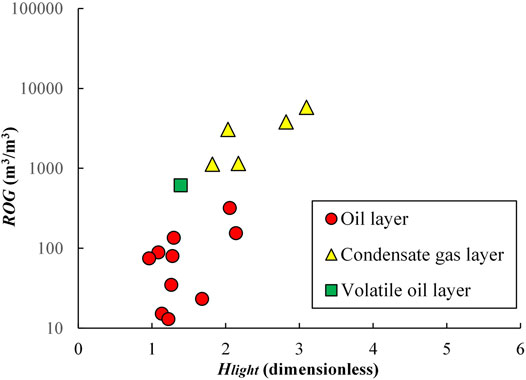
Using the statistical data in Table 1, we made the cross-plot between the production gas–oil ratio and Hheavy and Hlight parameters of the O oilfield reservoirs, respectively.
Figure 4 shows that with the increase of the Hheavy parameter, the production gas–oil ratio of the condensate gas reservoir, the volatile oil reservoir, and the conventional oil reservoir presents a monotonically decreasing function. Figure 5 shows that with the increase of the Hlight parameter, the production gas–oil ratio of condensate gas reservoir, volatile oil reservoir, and conventional oil reservoir presents a monotonically increasing function. The above analysis results provide a theoretical basis for the calculation of gas–oil ratio parameters by introducing gas logging information.
Introducing Hheavy and Hlight Information Into the Optimization Mathematical Model for Calculating Gas–Oil Ratio
By fitting the produced gas–oil ratio and Hheavy and Hlight parameters of the layers of different fluid types in Table 1, we established the quantitative relationship between the production gas–oil ratio and the Hheavy and Hlight parameters of the O oilfield reservoir.
By bringing Eq. 7 into Eq. 10, we can get the correlation between the Hheavy, Hlight, and relative content of natural gas (xgas) and the movable oil (xom). This correlation can be expressed by the following equation:
where f(Hheavy, Hlight) is the response value of gas logging to the formation, which corresponds to “Bi” in Eq. 2; a and b are the response values of gas logging to xgas and xom, which correspond to “Aij” in Eq. 2.
Therefore, Eq. 11 can be derived as the form of Eq. 2, that is, the general response equation for various logging instruments.
According to the above steps, the gas logging information is introduced into the gas–oil ratio calculation process. Because the introduced gas logging information is related to the production gas–oil ratio, the reliability of the gas–oil ratio calculation result is guaranteed.
Solving Optimization Mathematical Model
The solution of the optimization mathematical model is to obtain xgas and xom by solving Eq. 3 and then bring them into the gas–oil ratio calculation formula, namely Eq. 7. In this way, we can quantitatively calculate the gas–oil ratio parameters. The specific solving process is as follows:
Select a point
In the above equation,
1) When
2) When
For the optimal solution λ0, there must be
Let
Application Results and Discussion
Using the method proposed in this article, we quantitatively calculate the gas–oil ratio parameters of the target layer of well O-A2 in O oilfield and identify the different hydrocarbon types.
Figure 6 shows the logging interpretation results of the interval from 2005 to 2052 m in well O-A1. The production gas–oil ratios of the No. 2 interpretation layer (2010–2019 m) and No. 4 interpretation layer (2040–2049.5 m) in this well are 5800 m3/m3 and 35 m3/m3, respectively. According to the production data, they are identified as condensate gas reservoir and conventional oil reservoir. The sixth track in Figure 6 is the parameter curve of the gas–oil ratio, quantitatively calculated by using the optimization mathematical model. The calculated gas–oil ratio of No. 2 interpretation layer (2010–2019 m) and No. 4 interpretation layer (2040–2049.5 m) is 8921 m3/m3 and 89 m3/m3, respectively. The interpretation and identification results are condensate gas reservoir and conventional oil reservoir, respectively, which are consistent with the production situation of the reservoirs.
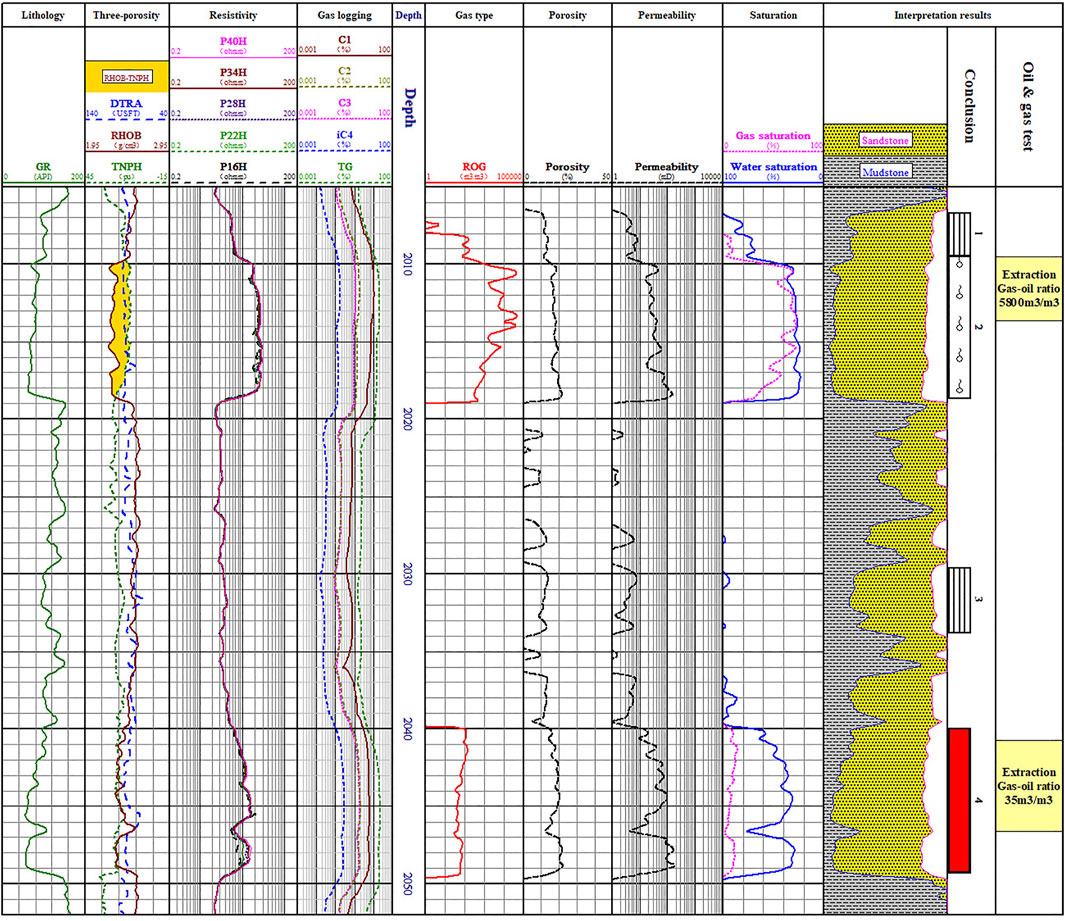
FIGURE 6. Diagram of the logging interpretation results of well O-A1 (2005–2052 m). GR means the natural gamma-ray logging curve, DT means the acoustic logging curve, RHOB means the density logging curve, TNPH means the neutron logging curve, P16H-P40H means the resistivity logging curve while drilling, C1 means methane, C2 means ethane, C3 means butane, iC4 means isobutane, TGAS means total hydrocarbon, and ROG means quantitatively calculated gas–oil ratio.
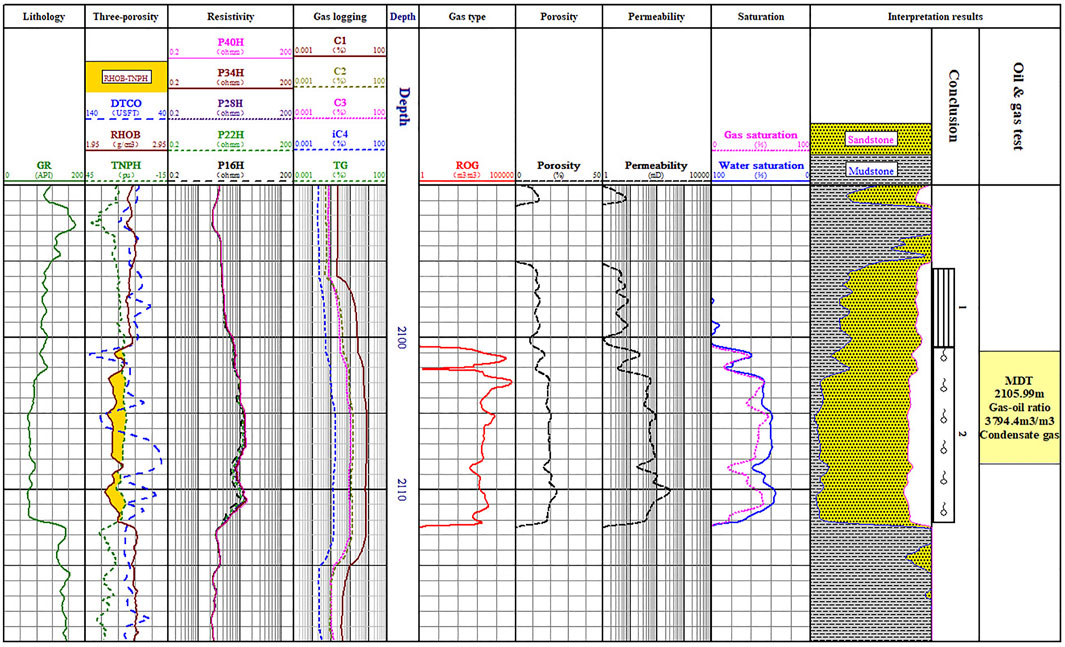
Figure 7 shows the logging interpretation results of 2090–2052 m in well O-A1, in which M2RX means deep investigation induction logging curve, other logging curves are the same as Figure 6. The Modular Formation Dynamics Test (MDT) was performed at this well, and the MDT sampling gas–oil ratio of 2105–2106 m is 3794.4 m3/m3. According to the formation testing results, this layer was identified to be a condensate gas reservoir. The sixth track in Figure 7 is the parameter curve of the calculated gas–oil ratio. The calculated gas–oil ratio of No. 2 interpretation layer (2100.3–2112 m) is 3788 m3/m3, which is close to the MDT testing gas–oil ratio. According to the calculation results of gas-oil ratio, this layer is determined as a condensate gas layer.
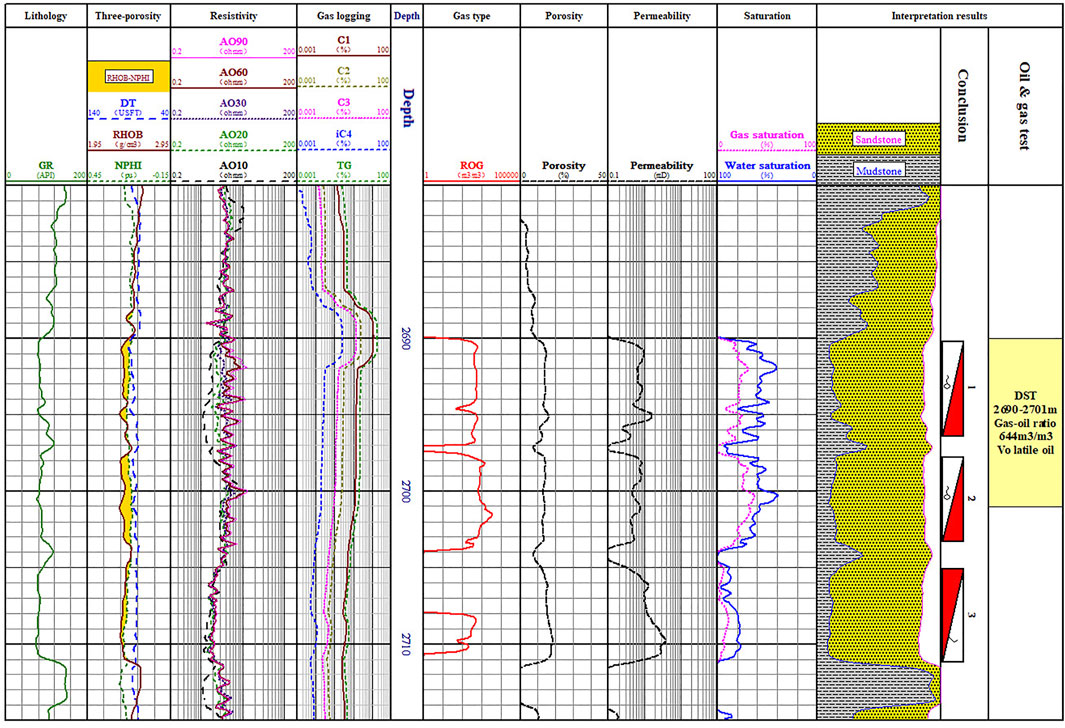
Because the gas logging–derived parameters, Hheavy and Hlight, show different response characteristics to the condensate gas reservoir, volatile oil reservoir, and conventional oil reservoir, the calculated gas–oil ratio can also discriminate the volatile oil reservoir effectively. There are some volatile oil layers in the W oilfield near the O oilfield, and we applied the quantitative calculation method of gas–oil ratio into the W oilfield. Figure 8 shows the logging interpretation results in the interval 2680–2713 m of well W-3-1. In this figure, AO20-AO90 means the array induction resistivity curve, other logging curves are the same as in Figure 6. The gas–oil ratio from the drill-stem test (DST) in the interval 2690–2701 m is 644 m3/m3. The conventional logging and gas logging response characteristics are between the condensate gas reservoir and the conventional oil reservoir. According to the DST testing results, this layer was identified to be a volatile oil reservoir. In the sixth track of Figure 8, the calculated gas–oil ratios of No. 1 interpretation layer (2690.2–2696.5 m) and No. 2 interpretation layer (2697.5–2703.4 m) are 605.3 m3/m3 and 676.58 m3/m3, respectively, which are close to the gas–oil ration from the DST. The interpretation and discrimination results are volatile oil reservoirs, which are consistent with the DST testing conclusions.
Conclusion
In this article, we propose a method to identify condensate gas reservoirs using gas–oil ratio parameters calculated by the optimization mathematical model. Through the analysis of gas logging data, we found that gas logging response character of the light hydrocarbon and heavy hydrocarbon components have obvious differences in condensate gas, volatile oil, and conventional oil reservoirs, and there is a clear correlation between the production gas–oil ratio and Tg/C1. Based on this cognition, we convert the fitting relationship between the gas logging derived parameters, Hheavy and Hlight, and the production gas–oil ratio to the general form of the response equation of the logging instruments, then introduce it into the process for calculating the gas–oil ratio parameters. We apply the proposed theoretical method in the article to the condensate gas reservoirs in the O oilfield. The application results show that the quantitative calculation method of the gas–oil ratio can calculate the gas–oil ratio parameters more accurately, and the calculation results are consistent with the conclusions of the formation testing data. In addition, we also apply the above theoretical methods to the volatile oil reservoirs in the W oilfield and achieve good results in identifying the volatile oil reservoirs.
Data Availability Statement
The original contributions presented in the study are included in the article/Supplementary Material, and further inquiries can be directed to the corresponding author.
Author Contributions
ZL is the main contributor to this article, ZL and CG contributed to the Optimizing Mathematical Models section in this article, and YT contributed to the example applications of this article.
Funding
We appreciate the financial support provided for the research from the National Science Foundation of China (Grant No. 41402113) and the China National Science and Technology Major Project (Grant No. 2016ZX05027-002-002).
Conflict of Interest
The authors declare that the research was conducted in the absence of any commercial or financial relationships that could be construed as a potential conflict of interest.
Publisher’s Note
All claims expressed in this article are solely those of the authors and do not necessarily represent those of their affiliated organizations, or those of the publisher, the editors, and the reviewers. Any product that may be evaluated in this article, or claim that may be made by its manufacturer, is not guaranteed or endorsed by the publisher.
References
Batzle, M., and Wang, Z. (1992). Seismic Properties of Pore Fluids. Geophysics 57, 1396–1408. doi:10.1190/1.1443207
Feng, J., Zhao, B., Gao, C., Shi, L., Guan, Y., Li, Z., et al. (2020). Comprehensive Identification of CO2 Nonhydrocarbon Gas Layers by Relative CO2 Content and Apparent Porosity Calculated from Well Logs: A Case Study in the Baiyun Deep-Water Area in the Eastern South China Sea. Interpretation 8, T715–T725. doi:10.1190/INT-2019-0290.1
Gao, C., Zhang, C., Xiao, C., and Song, F. (2003). Identification of Condensate Gas Reservoirs by Gas-Oil Ratio Obtained from Logging Information. Pet. Geophys. Exploration 31, 290. doi:10.3321/j.issn:1000-7210.2003.03.015
Gao, C., Zhang, C., and Zhong, X. (1995). Analysis of ELAN Interpretation Program. Well Logging Technol. 19, 135–139. doi:10.16489/j.issn.1004-1338.1995.02.009
He, H., Fan, T., Guo, X., Yang, T., Zhen, M., Huang, F., et al. (2021). Major Achievements in Oil and Gas Exploration of PetroChina during the 13th Five-Year Plan Period and its Development Strategy for the 14th Five-Year Plan. China Pet. Exploration 26, 17–30. doi:10.3969/j.issn.1672-7703.2021.01.002
Hu, A., Niu, C., Wang, D., Li, H., Ye, T., and Xu, P. (2020). The Characteristics and Formation Mechanism of Condensate Oil and Gas in Bozhong 19-6 Structure, Bozhong Sag, Bohai Bay Basin. Acta Petrolei Sinica 41, 403. doi:10.7623/syxb202004003
Li, S. (2006). Analysis of Oil Gas Water Velocity and its Influencing Factors. Xinjiang Geology. 3, 82. doi:10.3969/j.issn.1000-8845.2006.03.017
Li, Z., Gao, C., Zhao, B., Guan, Y., and Liu, J. (2020). Application of Nuclear Magnetic Resonance Logging in the Low-Resistivity Reservoir - Taking the XP Area as an Example. Interpretation 8, T885–T893. doi:10.1190/INT-2019-0179.1
Liu, J., Wang, X., and Wu, H. (2017). Gas Logging Identification Method and Application of Condensate Gas and Light. oil: Spec. Oil Gas Reservoir 24, 48. doi:10.3969/j.issn.1006-6535.2017.05.009
Orangi, A., Nagarajan, N. R., Honarpour, M. M., et al. (2011). Unconventional Shale Oil and Gas-Condensate Reservoir Production, Impact of Rock, FLuid, and Hydraulic Fractures. All Days, 24–26. doi:10.2118/140536-ms
Panja, P., Pathak, M., and Deo, M. (2019). Productions of Volatile Oil and Gas-Condensate from Liquid Rich Shales. Adv. Geo-energy Res. 3, 29–42. doi:10.26804/ager.2019.01.02
Tang, Y., Long, K., Wang, J., Xu, H., Wang, Y., He, Y., et al. (2021). Change of Phase State during Multi-Cycle Injection and Production Process of Condensate Gas Reservoir Based Underground Gas Storage. Pet. Exploration Develop. 48, 395–406. doi:10.1016/s1876-3804(21)60031-9
Tong, X., Zhang, G., Wang, Z., Tian, Z., Niu, J., and Wen, Z. (2014). Distribution and Potential of Global Oil and Gas Resources. Earth Sci. Front. 21, 1–9. doi:10.13745/j.esf.2014.03.001
Tong, X., Zhang, G., Wang, Z., Wen, Z., Tian, Z., Wang, H., et al. (2018). Distribution and Potential of Global Oil and Gas Resources. Pet. Exploration Develop. 45, 727–736. doi:10.11698/PED.2018.04.1910.1016/s1876-3804(18)30081-8
Wang, Z., Wen, Z., He, Z., Song, C., Liu, X., Chen, R., et al. (2021). Global Condensate Oil Resource Potential and Exploration fields. Acta Petrolei Sinica 42, 1556–1565. doi:10.7632/SYXB202112002
Wei, F., and Li, Y. (2020). Identification Technology of Complex Fluid Properties Based on Logging and Mud Logging Data. Fault-Block Oil & Gas Field 27, 760–765. doi:10.6056/dkyqt202006017
Xu, C., Huang, Z., Li, Y., Tian, Q., Li, Y., and Wang, Z. (2019). Application of Geochemical Logging Technology in Identification of Condensate Gas- Bearing Formation in Buried hill Reservoir of BZ 19-6 Structure. Mud Logging Eng. 30, 63–66. doi:10.3969/j.issn.1672-9803.2019.03.011
Yang, H., Chen, Y., Tian, J., Du, J., Zhu, Y., Li, H., et al. (2020). Great Discovery and its Significance of Ultra-deep Oil and Gas Exploration in Well Luntan-1 of the Tarim Basin. China Pet. Exploration 25, 62–72. doi:10.3969/j.issn.1672-7703.2020.02.007
Zhao, B., Gao, C., Hou, J., Li, Z., Gao, G., and Zhang, H. (2020). Physical Parameter Modeling of Carbonate Dissolution-Vug Reservoirs Based on Porosity Inversion with Optimization Algorithm. Interpretation 8, 1–34. doi:10.1190/INT-2019-0175.1
Keywords: condensate gas reservoir, calculated gas–oil ratio parameter, identification of complex fluid properties, the gas logging response equations, optimization mathematical model
Citation: Zhao B, Li Z, Gao C and Tang Y (2022) Identification of Complex Fluid Properties in Condensate Gas Reservoirs Based on Gas–Oil Ratio Parameters Calculated by Optimization Mathematical Model. Front. Energy Res. 10:863776. doi: 10.3389/fenrg.2022.863776
Received: 27 January 2022; Accepted: 11 March 2022;
Published: 05 April 2022.
Edited by:
Qi Zhang, China University of Geosciences Wuhan, ChinaReviewed by:
Long Luo, Chongqing University of Science and Technology, ChinaDebanjan Chandra, Indian Institute of Technology Bombay, India
Guangliang Yang, China Earthquake Administration, China
Copyright © 2022 Zhao, Li, Gao and Tang. This is an open-access article distributed under the terms of the Creative Commons Attribution License (CC BY). The use, distribution or reproduction in other forums is permitted, provided the original author(s) and the copyright owner(s) are credited and that the original publication in this journal is cited, in accordance with accepted academic practice. No use, distribution or reproduction is permitted which does not comply with these terms.
*Correspondence: Bin Zhao, emhhb2JpbkB5YW5ndHpldS5lZHUuY24=
 Bin Zhao
 Zhaoping Li
 Chuqiao Gao
 Yang Tang