 Tong Yu
 Kai Da1
- 1Guangxi Power Grid Co.,Ltd, Electric Power Research Institute, Nanning, China
- 2Guangxi Power Grid Co., Ltd, Hechi Power Supply Bureau, Hech, China
In order to solve the problem of the time offset between the supervisory control and data acquisition system and phasor measurement unit and the unknown distribution of non-Gauss noise, this paper proposes a robust state estimation method for power systems based on the Maximum Exponential Square and data fusion. Firstly, the robust Mahalanobis distance is used to detect system outliers and assign appropriate weights to the selected PMU buffer measurement. Then, the MES-based estimator uses these weights to filter out non-Gauss PMU measurement noise to generate a set of state estimation results. At the same time, the MES estimator is used to process the received SCADA measurement with unknown measurement noise, thereby generating another set of state estimation results. Finally, the two sets of estimation results from two independent MES estimators are fused by using data fusion theory to obtain the final optimal state estimation results. Based on IEEE-14 and 30-buses standard system, the simulation results prove the effectiveness and robustness of the method proposed in this paper.
1 Introduction
State Estimation technology can be used to improve the state awareness and defense against bad data in smart grid monitoring, reliability analysis and optimal load distribution, etc. (Liu Y et al., 2021). Reliable data foundation is the cornerstone of other advanced applications (Alnowibet et al., 2021). The purpose of SE is to obtain the best estimate of the current system node voltage modulus and phase angle given a set of redundant measurements and accurate network topology and parameters (Ma et al., 2021). Therefore, the performance of SE is highly dependent on the accuracy of the measurement and the estimation model established under the assumptions, and reasonable assumptions are crucial to the establishment of the model (Wang H et al., 2021). In SE, measurements can be affected by the errors of the measuring instruments, and even serious errors can occur due to instrument failures, impulse communication noise, etc. (Yu et al., 2021) Due to changes in the environment and temperature, the network parameters will also change over time, thus introducing uncertainty into the assumed SE model (Zanni et al., 2020). In addition, in the absence of sufficient field information or lack of calibration, the zero-injection information of the contact node may also be wrong (Zhao and Mili, 2018). Therefore, the measurement noise is unknown in the actual power system, and the uncertainty is strong, not the traditional Gauss noise.
However, in the existing research on power systems, measurement noise is often assumed to be Gaussian distribution, but actual measurement statistics show that measurement noise often deviates from the assumed Gauss model, resulting in outliers. In this case, the performance of existing SE methods, which rely on the Gauss assumption that measurement noise is Gaussian, may be significantly degraded (Zhao and Mili, 2018). With the widespread deployment of PMUs, PMUs can provide more and more simultaneous voltage and current phasor measurements with time stamps and higher accuracy than traditional SCADA measurements, so are often used to improve the accuracy of SE as well as enhance Detection and identification of bad data. However, the sampling frequencies of the measurements from the SCADA system and the PMU are very different, leading to time offset issues, which must be unified under the same time profile (Thomas and Mili, 2007; Gandhi and Mili, 2010; Zhang et al., 2013; Murugesan et al., 2015; Zhao et al., 2015; Le et al., 2020).
To address this issue, PMU measurements can be buffered and hypothesis testing used to select the optimal buffer length (Thomas and Mili, 2007; Gandhi and Mili, 2010; Zhang et al., 2013; Murugesan et al., 2015; Zhao et al., 2015; Le et al., 2020). The sample mean and covariance of these buffered PMU measurements are then combined with SCADA measurements for SE. For PMU measurement, it is generally assumed that its error follows Gauss distribution. However, the latest statistical research shows that PMU measurement noise follows heavy-tailed distribution rather than Gaussian distribution (Zhao and Mili, 2018). Based on this, the literature (Zhao and Mili, 2018) improves the traditional static SE in the case of non-Gauss noise, but this literature does not consider the time offset problem between SCADA and PMU measurements.
Data Fusion theory is a relatively new area in the fields of aerospace, information theory, and signal processing, dealing with processes or states monitored by different classes of sensors and performing information fusion. Each class of sensors may have common characteristics, such as underlying technology, level of accuracy, etc., and then combine the data generated by the various sensors in an optimal way, in a sense, relative to the information obtained from a single sensor; the resulting final fused information quality is improved. Taking SCADA and phasor measurements as different sources of information for monitoring the state of the same power grid, and applying data fusion technology to integrate PMU measurements into state estimation, SCADA and phasor data can be fused to improve the quality of the fusion data (Zheng, 2015; Li et al., 2021).
To improve the monitoring state awareness and deal with unknown non-Gauss noise and time offset between SCADA and PMU measurements, this paper proposes a robust SE method for power systems based on MES and data fusion. In this method, robust Mahalanobis distances are utilized to detect system anomalies and assign appropriate weights to each selected PMU buffering measure. These weights are further exploited based on the MES estimator to filter out non-Gauss PMU noise and help suppress outliers. At the same time, the MES estimator is also used to process the received SCADA measurements with unknown measurement noise, resulting in another set of SEs. Finally, the effectiveness and robustness of the proposed method are verified based on IEEE-14 and 30-node standard systems.
The contributions of this paper are as follows: embed the zero-injection expression in the MES estimation model to eliminate the equality constraints, which can improve the efficiency of the algorithm; calculate the PMU buffer based on the robust Mahalanobis distance, and unify the PMU and SCADA data to a unified cross-sectional scale, which can eliminate the time delay problem; use the state fusion based on data fusion theory which can obtain the optimal state estimation result.
2 Measurement Equation
By the Wiener approximation theorem, the non-Gauss distribution p(x) can be well approximated by the known Gaussian distribution, so the following model can be used to simulate the non-Gaussian distribution error:
Based on whether the known measurement error obeys the Gauss distribution, the above formula can be further expressed as follows (Zhao and Mili, 2018):
where
The measurement equation under non-Gauss noise can be expressed as follows:
3 PMU Optimal Buffer Length Calculation
Since the sampling frequency of the PMU is much higher than that of the SCADA measurement, there is a time skew problem for the PMU and SCADA measurements. In the existing research, such as the literature (Zhang et al., 2013) and (Murugesan et al., 2015), it is proposed to use the hypothesis test method to select the optimal buffer length of the PMU measurement between two SCADA measurement scans, but this is only for a single PMU measurement point, therefore, it is necessary to calculate each measuring point one by one, which is inefficient.
In this paper, based on Mahalanobis distance, the optimal buffer length of multiple PMU measuring points is determined (Zhao and Mili, 2018), and all PMU measuring points are taken as a whole.
Let the PMU sample
(1) Calculate the median value of the Z matrix:
(2) Perform change point detection on
(3) Based on the Mahalanobis distance, the system changes are detected for
If all of Mahalanobis distance
(4) Calculate the measurement mean
Based on the above steps, the optimal buffer length of multiple PMU measuring points can be obtained. After calculating the mean
4 Robust SE Method Based on MES and Data Fusion
4.1 MES-Based SCADA Robust SE
Based on the MES estimation method, the MES estimation model is established by using SCADA measurement, and its expression is as follows:
The zero injection constraint in polar coordinates can be expressed as:
Substituting this constraint into the MES estimation model, we get:
make:
Using Newton’s method to solve, the modified equation is obtained:
Where F and Q are:
The state quantity is corrected to:
The iterative calculation flow of estimation based on MES is shown in Figure 1:
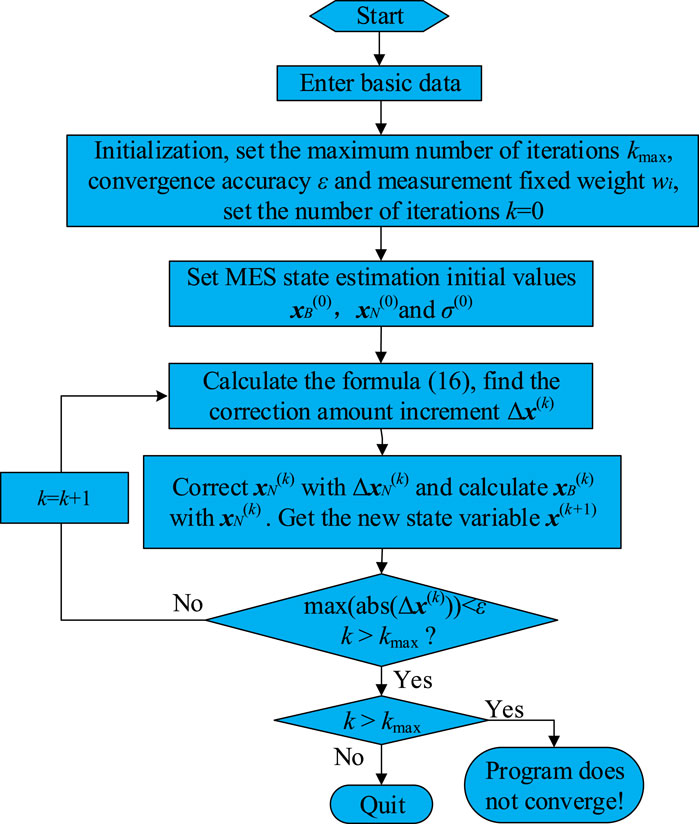
FIGURE 1. MES calculation flowchart.
The calculation flow of MES estimator is as follows:
(1) Initialization parameters,
(2) Calculate
(3) Calculate the matrices H, F and Q, solve Eq 16, get
(4) If
The state error variance matrix of SCADA-based MES estimation is:
It should be noted that this paper embeds the zero-injection expression in the MES estimation model, so that the equality constraints do not have to be explicitly expressed, and the equality constraints are eliminated. It is not necessary to use Lagrange multiplier method to improve the efficiency of the algorithm, which is one of the main tasks in this paper.
4.2 MES-Based PMU Robust SE
Similar to SCADA robust SE, PMU measurement alone is used for robust estimation based on MES model (Min et al., 2021; Wang Q et al., 2021), but PMU measurement is a voltage and current phasor, and its measurement function is a linear function:
Based on the MES model, we can get:
The Newton method is also used to solve the equation, and the modified equation is obtained:
The state quantity correction is the same as formulas (19)-(21).
After iterative convergence, the state error variance matrix of the PMU-based MES estimation is:
4.3 State Fusion Based on Data Fusion Theory
In this paper, referring to data fusion theory, SCADA and PMU measurements are regarded as different data sources and their measurements are represented by
Based on a, b, c and d, the best state fusion result is obtained by data fusion:
As can be seen from the above formula, the denominator of the weight of the SE of xs and xp is the same, and the numerators are
Combining data fusion with MES estimation model is the second main work of this paper.
The schematic diagram of the fusion SE calculation logic is shown in Figure 2.
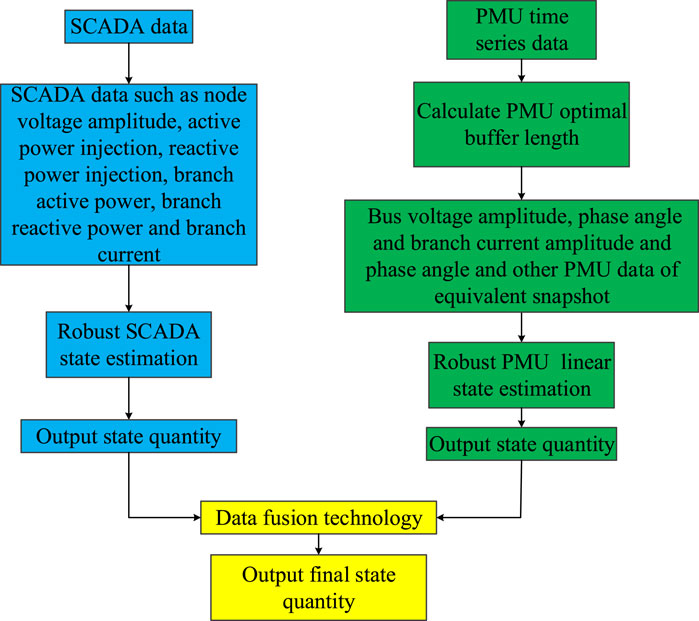
FIGURE 2. Data fusion SE calculation flowchart.
5 Case Simulation and Analysis
5.1 Basic Data and Simulation Conditions
In order to verify the performance of the robust SE method based on MES and data fusion proposed in this paper, simulations are carried out based on the IEEE-14 node and IEEE-30 node standard system, and the topology diagrams are shown in Figures 3, 4, respectively.
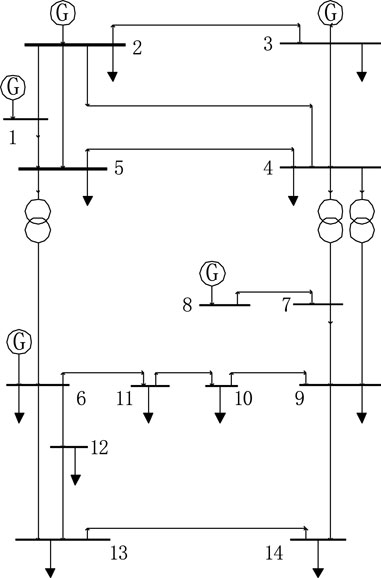
FIGURE 3. IEEE-14 buses standard system network structure.
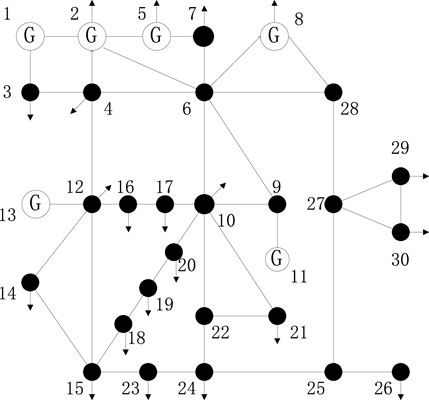
FIGURE 4. IEEE-30 buses standard system network structure diagram. Use two methods to compare with the method proposed in this paper.
For the IEEE-14 node standard system, three PMUs were deployed on nodes 4, 7, and 14, and 31 SCADA measurements were considered, including 16 branch power, 14 injected power, and one node voltage amplitude. For the IEEE-30 node standard system, 38 pairs of power measurements are considered, including 15 pairs of active and reactive power injection and 23 pairs of branch active and reactive power measurements; active and reactive power injection at nodes 11, 12, 24,27,30, and active and reactive power at branches 24-23, 25-26, 30-27 are key measurements, six PMUs are deployed on nodes 8, 9, 12, 24, 25, and 26.
At each layout point, PMU provides the voltage of the layout point and the branch current vector associated with the layout point; SCADA provides the voltage amplitude of the layout point, injected active power, reactive power and the branch active power, reactive power associated with the layout point.
1) Hybrid data WLS estimator (ie HWLS) (Li et al., 2013), which combines buffered PMU measurements with SCADA measurements for SE.
2) Two-stage WLS estimator (ie TWLS) (Liu X et al., 2021), which first performs traditional SE based on SCADA measurements, and its SE estimation results are further combined with PMU measurements to perform second-stage linear SE.
Using the MAE of the voltage modulus value and the angle estimate value as the overall performance evaluation index, the algorithm relationship between the method proposed in this paper and the HWLS and TWLS methods is shown in Figure 5.
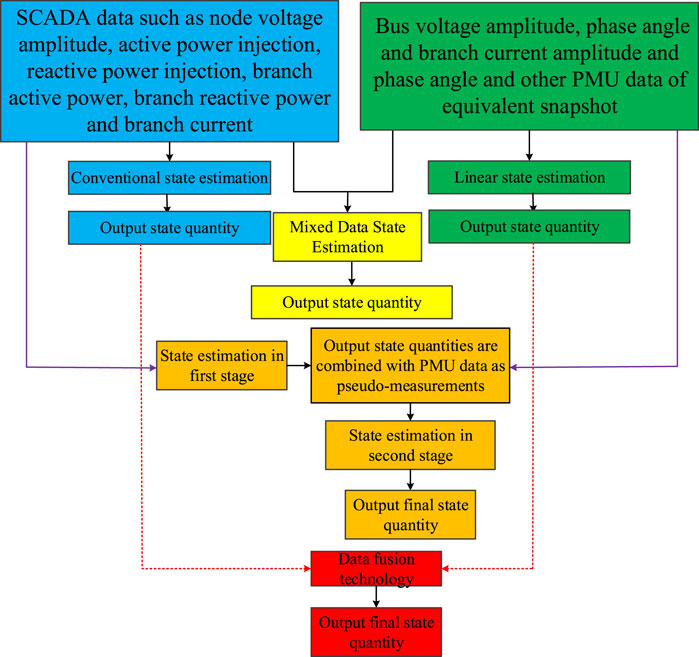
FIGURE 5. The algorithm relationship diagram between the method proposed in this article and the HWLS and TWLS methods.
5.2 Simulation Results and Analysis
5.2.1 Under Gaussian Noise
First consider adding known Gauss noise to SCADA and PMU measurements to better understand the best performance of each method (Al-Saud et al., 2019; Mohamed et al., 2019).
For this, the noise of each SCADA and PMU measurement is assumed to be Gaussian random variables with zero mean and variance of 2 × 10⁻⁴ and 2 × 10⁻⁶ respectively. The mean absolute errors of the voltage modulus and angle estimated by each method are shown in Tables 1, 2, respectively.
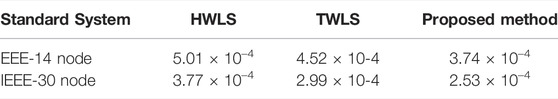
TABLE 1. Average absolute error of voltage amplitude under Gaussian noise (pu).
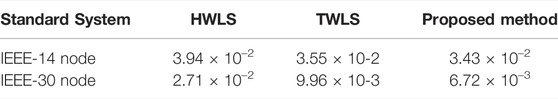
TABLE 2. Average absolute error of voltage phase angle under Gaussian noise (°).
It can be seen from Tables 1, 2 that under the Gauss measurement noise, for the IEEE-14 node standard system, the voltage modulus value and the MAE of the phase angle of the HWLS are 5.01 × 10⁻⁴ and 3.94 × 10⁻², respectively. The voltage modulus of TWLS and the MAE of the phase angle are 4.52 × 10⁻⁴ and 3.55 × 10⁻², respectively. The voltage modulus value and the phase angle MAE of the method proposed in this paper are 3.74 × 10⁻⁴ and 3.43 × 10⁻² respectively. For the IEEE-30 node standard system, the MAE of the HWLS voltage modulus and phase angle is 3.77 × 10⁻⁴ and 2.71 × 10⁻², respectively. The voltage modulus value and phase angle MAE of TWLS are 2.99 × 10⁻⁴ and 9.96 × 10⁻³ respectively. The MAE of the voltage modulus and the phase angle of the method proposed in this paper are 2.53 × 10⁻⁴ and 6.72 × 10⁻³, respectively.
Therefore, the method proposed in this paper is better than TWLS and outperforms the HWLS method. This is because both the proposed method and TWLS fully consider the buffered PMU measurement, which avoids the influence of SCADA with lower measurement accuracy on the PMU with higher measurement accuracy in the hybrid measurement, thereby improving the estimation accuracy.
To further evaluate the performance of various methods at another Gauss noise level. Assuming that the variance of each SCADA and PMU measurement is increased to 6 × 10⁻³ and 6 × 10⁻⁵, respectively, the verification is performed based on the IEEE-30 node standard system, and the results are shown in Table 3.

TABLE 3. Average absolute error of voltage under Gaussian noise in three methods.
It can be seen from Table 3 that for HWLS, TWLS and the proposed method, the MAEs of the estimated voltage modulus values are 1.57 × 10⁻³, 1.35 × 10⁻³, and 1.21 × 10⁻³, respectively, and the MAEs of the estimated voltage phase angles are 4.32 × 10⁻², 3.33 × 10⁻² and 1.94 × 10⁻². It can be seen that the estimation error of all methods increases slightly as the noise level increases, because at a given measurement redundancy level, the estimation statistical efficiency will decrease if the noise level increases. However, the proposed method still outperforms the other two HWLS and TWLS methods.
5.2.2 Under Non-Gaussian Noise
In practical applications, the noise statistics of SCADA and PMU measurements are usually unknown and deviate from Gauss assumptions due to the aging process of voltage and current transformers, changes in ambient temperature, communication channel noise, etc. To evaluate the performance of each method against unknown statistical noise, non-Gauss noise models, namely Gauss mixture model and heavy-tailed Laplacian noise, were used for simulation. Specifically, for SCADA measurements, a Gaussian mixture model with two Gauss components (non-Gaussian after mixing) is assumed, which is represented by zero mean and variance 2 × 10⁻⁴ and 2 × 10⁻³ with weights of 0.95 and 0.05, respectively. For the PMU measurement, the variances are assumed to be 2 × 10⁻⁶ and 2 × 10⁻⁴, and the weights are 0.9 and 0.1. In the second case, a Laplacian distribution with zero mean and scale parameter 10–3 is used for the noise of SCADA and PMU measurements.
Tables 4, 5 present the MAE results for the voltage modulo values and angles estimated by each method in the presence of non-Gauss measurement noise simulated by the Gauss hybrid model, respectively. Under the Gauss mixed model noise, for the IEEE-14 node standard system, the voltage modulus value and phase angle MAE of HWLS are 9.41 × 10⁻³ and 0.51, respectively, and the voltage modulus value and phase angle MAE of TWLS are 8.37 × 10⁻³ and 0.39, the MAE of the voltage modulus and the phase angle of the method proposed in this paper are 6.75 × 10⁻³ and 0.18, respectively. For the IEEE-30 node standard system, the voltage modulus value and phase angle MAE of HWLS are 4.91 × 10⁻³ and 0.34, respectively, and the voltage modulus value and phase angle MAE of TWLS are 1.95 × 10⁻³ and 0.27, respectively. The voltage modulus value and the phase angle MAE of the proposed method are 1.42 × 10⁻³ and 0.13, respectively.

TABLE 4. Average absolute error of voltage amplitude under non-Gaussian noise (pu).
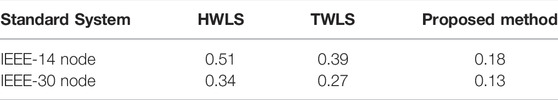
TABLE 5. Average absolute error of voltage phase angle under non-Gaussian noise (°).
Compared with the Gauss noise cases in Tables 1, 2, the estimation errors of all three methods are increased. But HWLS and TWLS have a larger increase in estimation error because they rely heavily on the Gauss assumption of SE. In contrast, the robust estimator proposed in this paper based on MES and data fusion is more robust and produces more reasonable SE results.
Figures 6, 7 show the absolute error values of HWLS, TWLS and the proposed method under Laplace measurement noise. As can be seen from the results in the figures, the results are in complete agreement with those shown in Tables 4, 5. Therefore, it can be concluded that the robust estimator based on MES and data fusion proposed in this paper does not require the measurement noise to be Gauss noise, and has better robustness in dealing with non-Gauss noise.
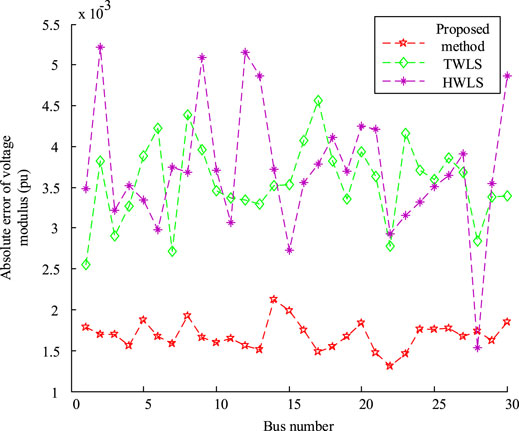
FIGURE 6. The absolute error of the voltage amplitude of each method under Laplace measurement noise.
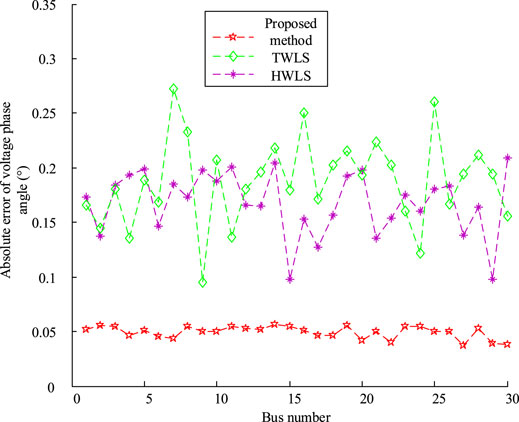
FIGURE 7. The absolute error of the voltage phase angle of each method under Laplace measurement noise.
5.2.3 Robustness to Bad Data
In order to verify the robustness of the robust estimator proposed in this paper to various types of bad data, in the presence of bad data for bad leverage points, bad key measurements, and measurements of multiple interactions, based on the IEEE-30 node standard system simulation.
Set up the following four simulation schemes:
Scheme 1: In the case of a single bad data, change the active power injection into P8 of Section 8 to 0.1pu.
Solution 1: For bad lever measurement, change P19 and P19-20 to 0.1pu.
Solution 2: For bad key measurement, change P11 to 0.2pu.
Scheme 3: For bad data affected by multiple interactions, change P2 and Q2 to the original opposite numbers.
Figure 8, 9 show the simulation results of different types of bad data under the four schemes. Obviously, since the robustness of the robust estimator based on MES and data fusion proposed in this paper is provided by the robust Mahalanobis distance and MES estimator. The influence of various types of bad data is bounded, resulting in a very small estimation deviation. The maximum deviation of the voltage modulus value estimation is 0.00094pu, and the maximum deviation of the voltage phase angle estimation is 0.0075°, which can be ignored in practical applications.
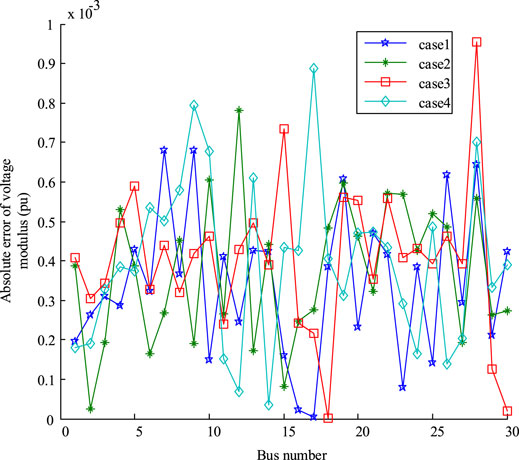
FIGURE 8. The absolute error of the voltage amplitude under different cases.

FIGURE 9. The absolute error of the voltage phase angle different cases.
6 Conclusion
To solve the problem of unknown non-Gauss noise and time offset of SCADA and PMU measurements, this paper proposes a robust SE method for power systems based on MES and data fusion based on data fusion theory and MES estimation model. This method has the following characteristics:
(1) The zero injection expression is embedded in the MES estimation model, so that the equality constraints do not need to be expressed explicitly, and the equality constraints are eliminated, and the Lagrange multiplier method is no longer required to process, thereby improving the efficiency of the algorithm;
(2) PMU buffer measurement based on robust Mahalanobis distance selection, and assign weights, further based on MES SE method, which can filter non-Gauss measurement noise and outliers;
(3) Based on MES and data fusion theory, perform SE for PMU and SCADA measurements with unknown measurement noise. Based on the two sets of estimation results, the estimation results from two independent MES estimators are fused by using data fusion theory to obtain the final optimal SE.
Based on the IEEE-14 and IEEE-30 node standard systems, the simulation results show that the proposed method is effective and robust, and has obvious advantages compared with the existing methods.
Data Availability Statement
The raw data supporting the conclusion of this article will be made available by the authors, without undue reservation.
Author Contributions
Credit author statement TY: Conceptualization, Methodology, Software, Validation, Visualization, Investigation, Writing—Original Draft, Writing—Review and Editing. KD: Conceptualization, Methodology, Software, Validation, Visualization, Investigation, Writing—Original Draft, Writing—Review and Editing. ZW: Conceptualization, Methodology, Software, Validation, Visualization, Investigation, Writing—Original Draft, Writing—Review and Editing. YL: Conceptualization, Methodology, Software, Validation, Visualization, Investigation, Writing—Original Draft, Writing—Review and Editing. XL: Conceptualization, Methodology, Software, Validation, Visualization, Investigation, Writing—Original Draft, Writing—Review and Editing. DB: Conceptualization, Methodology, Software, Validation, Visualization, Investigation, Writing—Original Draft, Writing—Review and Editing. CY: Conceptualization, Methodology, Software, Validation, Visualization, Investigation, Writing—Original Draft, Writing—Review and Editing.
Funding
This work was supported by the Guangxi Power Grid Co., Ltd., Research on vulnerability defense technology of power monitoring system based on interdependent network (047000KK52210031), Research and application of security attack monitoring technology for power intranet terminal equipment based on counter deep learning (047000KK52200012).
Conflict of Interest
Authors TY, KD, YL, XL,DB, and CY were employed by Guangxi Power Grid Co.,Ltd.
Author ZW was employed by Guangxi Power Grid Co.,Ltd.
Publisher’s Note
All claims expressed in this article are solely those of the authors and do not necessarily represent those of their affiliated organizations, or those of the publisher, the editors and the reviewers. Any product that may be evaluated in this article, or claim that may be made by its manufacturer, is not guaranteed or endorsed by the publisher.
References
Al-Saud, M., Eltamaly, A. M., Mohamed, M. A., and Kavousi-Fard, A. (2019). An Intelligent Data-Driven Model to Secure Intravehicle Communications Based on Machine Learning. IEEE Trans. Ind. Electron. 67 (6), 5112–5119. doi:10.1109/TIE.2019.2924870
Alnowibet, K., Annuk, A., Dampage, U., and Mohamed, M. A. (2021). Effective Energy Management via False Data Detection Scheme for the Interconnected Smart Energy Hub-Microgrid System under Stochastic Framework. Sustainability 13 (21), 11836. doi:10.3390/su132111836
Gandhi, M. A., and Mili, L. (2010). Robust Kalman Filter Based on a Generalized Maximum-likelihood-type Estimator. IEEE Trans. Signal. Process. 58 (5), 2509–2520. doi:10.1109/tsp.2009.2039731
Le, J., Li, X., Zhou, Q., and Zhao, L. (2020). Multi-region Distributed State Estimation Method for Power System [J]. Electric Power Automation Equipment 40 (05), 165–173. doi:10.1109/ICIEA51954.2021.9516391
Li, C., Liu, T., Li, X., and Wu, X. (2013). WAMS/SCADA Hybrid Measurement Data Fusion Method for Power System State Estimation [J]. High Voltage Technol. 39 (11), 2686–2691. doi:10.1109/ACCESS.2021.3060631
Li, X., Yu, Q., Alzahrani, B., Barnawi, A., Alhindi, A., Alghazzawi, D., et al. (2021). Data Fusion for Intelligent Crowd Monitoring and Management Systems: A Survey. IEEE Access 9, 47069–47083. doi:10.1109/access.2021.3060631
Liu, X., Xiang, X., Yang, Z., Shen, D., He, L., Chen, R., et al. (2021). Two-stage Dynamic State Estimation Method for Power System Considering Data Delay[J]. Smart Electric Power 49 (04), 75–81.
Liu, Y., Zhang, L., Xi, L., Sun, Q., and Zhu, J. (2021). Automatic Generation Control for Distributed Multi-Region Interconnected Power System with Function Approximation. Front. Energ. Res. 9, 257. doi:10.3389/fenrg.2021.700069
Ma, H., Liu, Z., Li, M., Wang, B., Si, Y., Yang, Y., et al. (2021). A Two-Stage Optimal Scheduling Method for Active Distribution Networks Considering Uncertainty Risk. Energ. Rep. 7, 4633–4641. doi:10.1016/j.egyr.2021.07.023
Min, L., Alnowibet, K. A., Alrasheedi, A. F., Moazzen, F., Awwad, E. M., and Mohamed, M. A. (2021). A Stochastic Machine Learning Based Approach for Observability Enhancement of Automated Smart Grids. Sustain. Cities Soc. 72, 103071. doi:10.1016/j.scs.2021.103071
Mohamed, M. A., Al-Sumaiti, A. S., Krid, M., Awwad, E. M., and Kavousi-Fard, A. (2019). A Reliability-Oriented Fuzzy Stochastic Framework in Automated Distribution Grids to Allocate $\mu$ -PMUs. IEEE Access 7, 33393–33404. doi:10.1109/access.2019.2902465
Murugesan, V., Chakhchoukh, Y., Vittal, V., Heydt, G. T., Logic, N., and Sturgill, S. (2015). PMU Data Buffering for Power System State Estimators. IEEE Power Energ. Technol. Syst. J. 2 (3), 94–102. doi:10.1109/jpets.2015.2448115
Thomas, L., and Mili, L. (2007). A Robust GM-Estimator for the Automated Detection of External Defects on Barked Hardwood Logs and Stems. IEEE Trans. Signal. Process. 55 (7), 3568–3576. doi:10.1109/tsp.2007.894262
Wang, H., Wang, B., Luo, P., Ma, F., Zhou, Y., and Mohamed, M. A. (2021). State Evaluation Based-Feature Identification of Measurement Data for Resilient Power System. CSEE J. Power Energ. Syst., 1–10. doi:10.17775/cseejpes.2021.01270
Wang, Q., Jin, T., and Mohamed, M. A. (2021). A Fast and Robust Fault Section Location Method for Power Distribution Systems Considering Multisource Information. IEEE Syst. J., 1–11. doi:10.1109/jsyst.2021.3057663
Yu, W., Huang, M., Wei, Z., Sun, G., Duan, F., and Liu, R. (2021). Power System Adaptive Robust State Estimation Based on Dynamic Partition and Multiple Estimation Criteria[J]. Automation Electric Power Syst. 45 (19), 173–180.
Zanni, L., Derviškadić, A., Pignati, M., Xu, C., Romano, P., Cherkaoui, R., et al. (2020). PMU-based Linear State Estimation of Lausanne Subtransmission Network: Experimental Validation[J]. Electric Power Syst. Res. 189, 106649. doi:10.1016/j.epsr.2020.106649
Zhang, Q., Chakhchoukh, Y., Vittal, V., Heydt, G. T., Logic, N., and Sturgill, S. (2013). Impact of PMU Measurement Buffer Length on State Estimation and its Optimization. IEEE Trans. Power Syst. 28 (2), 1657–1665. doi:10.1109/tpwrs.2012.2215890
Zhao, J., and Mili, L. (2018). A Framework for Robust Hybrid State Estimation with Unknown Measurement Noise Statistics. IEEE Trans. Ind. Inf. 14 (5), 1866–1875. doi:10.1109/tii.2017.2764800
Zhao, J., Zhang, G., Scala, M. L., and Zhang, J. (2015), “Multistage Phasoraided Bad Data Detection and Identification,” in Proceedings of the 2015 IEEE Power & Energy Society General Meeting, Denver, CO, USA, July. 26-30, 2015. doi:10.1109/pesgm.2015.7286267
Zheng, Y. (2015). Methodologies for Cross-Domain Data Fusion: An Overview. IEEE Trans. Big Data 1 (1), 16–34. doi:10.1109/tbdata.2015.2465959
Nomenclature
Supervisory control and data acquisition system SCADA
Phasor measurement unit PMU
State Estimation SE
Data Fusion DF
Maximum Exponential Square MES
Mean absolute error MAE
Variables
The weight of measurement
The number of Gauss elements
The mean of measurement
The variance of measurement
The non-Gauss distribution
The Gauss distribution
The unknown distribution
Contamination coefficient
The measurement
The nonlinear measurement function
The measurement error
Mahalanobis distance
The buffing set
The number of columns of
The weight of the ith column of
The measurement of
The state quantity x
The measurement function
The ith measurement weight wi
The ith measurement zi
The Parzen window width σ
The zero injection node constraint c(x) = 0
The zero injection power node B
The non-zero injection node N
The transformation relationship between
The measurement Jacobian matrix H
The mean value of the measurement in the PMU buffer set
The relationship matrix between the PMU and the state quantity
The PMU measurement error variance in the PMU buffer set
Keywords: status awareness, maximum exponential square method, non-gauss noise, data fusion, state estimation
Citation: Yu T, Da K, Wang Z, Ling Y, Li X, Bin D and Yang C (2022) Robust State Estimation Method for Power System Based on Maximum Exponential Square and Data Fusion. Front. Energy Res. 10:860556. doi: 10.3389/fenrg.2022.860556
Received: 23 January 2022; Accepted: 11 April 2022;
Published: 27 April 2022.
Edited by:
Junhui LiI, Northeast Electric Power University, ChinaReviewed by:
Edimar Jose Oliveira, Juiz de Fora Federal University, BrazilJun Hu, Harbin University of Science and Technology, China
Copyright © 2022 Yu, Da, Wang, Ling, Li, Bin and Yang. This is an open-access article distributed under the terms of the Creative Commons Attribution License (CC BY). The use, distribution or reproduction in other forums is permitted, provided the original author(s) and the copyright owner(s) are credited and that the original publication in this journal is cited, in accordance with accepted academic practice. No use, distribution or reproduction is permitted which does not comply with these terms.
*Correspondence: Tong Yu, WXV0b25ncGdjb0BnbWFpbC5jb20=