
95% of researchers rate our articles as excellent or good
Learn more about the work of our research integrity team to safeguard the quality of each article we publish.
Find out more
ORIGINAL RESEARCH article
Front. Energy Res. , 05 May 2022
Sec. Process and Energy Systems Engineering
Volume 10 - 2022 | https://doi.org/10.3389/fenrg.2022.860092
This article is part of the Research Topic Modeling and Optimization of Renewable Energy Systems by Using Novel Approaches View all 8 articles
 Shoaib Ahmed Khatri1
 Khanji Harijan2*
 Mohammad Aslam Uqaili1Syed Feroz Shah3Nayyar Hussain Mirjat1Laveet Kumar2
There is increased focus to harness renewable energy resources in the 21st century to contain climate change and attain energy security. In this context, wind energy is attaining a significant marketplace to meet the ever-increasing electricity demand. This study, as such, undertakes wind energy assessment and forecasts wind power market penetration in Pakistan considering three different scenarios for the period 2020–2050. The modeling approach of this study is based on the Levenberg–Marquardt algorithm (LMA) optimization method, which is used to estimate the parameters of the logistic model to improve forecasting precision. It is revealed that around 55, 64, and 73% of wind potential could be technically exploited under each of the three scenarios, respectively. The Certified Emission Reductions (CERs) for each scenario are also estimated. The anticipated annual abatement of GHG emissions and CERs earnings at 30% capacity utilization factor is found to be 158 million CERs by the year 2050. These results suggest that wind energy offers great potential to attain energy security, environmental stability, and sustainable development in Pakistan. This study would assist energy professionals, government, and stakeholders to undertake wind energy market assessment and devise appropriate energy management plans.
⁃ Wind energy assessment and market penetration of wind power in Pakistan is forecasted
⁃ Levenberg–Marquardt algorithm optimization is used
⁃ Different scenarios are developed to investigate wind power potential
⁃ Certified Emission Reductions are estimated
The rising crisis of climate and the race to attain energy security have forced nations to consider renewable energy resources to meet the ever-increasing energy demand. This fact is also supported by the decreasing trend of renewable energy technology costs over the last couple of decades. It is pertinent to note that renewable energy-based technological developments have sufficiently augmented their contribution to the tune of 1,246 gigawatts of electric power globally. Figure 1 depicts the renewable energy-based power generation capacities across the world, for EU-28 and the top six countries during the year 2018. The emerging trend in utilizing renewable energy resources (RES) tends to alleviate dependency on fossil fuel resources with associated greenhouse gas emissions involved in the energy conversion processes.
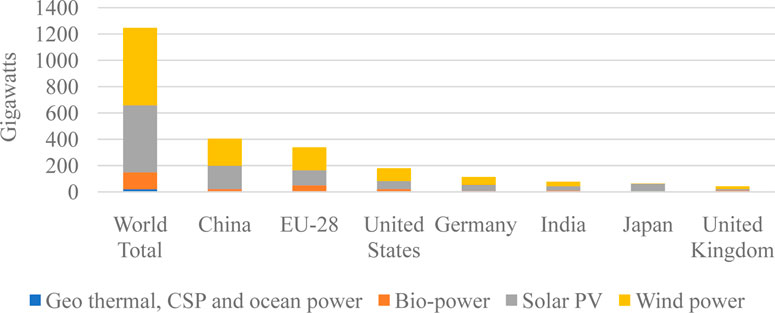
FIGURE 1. Renewable power capacities in world, EU-28 and top six countries 2018 (Renewable 2018 Global Status Report, 2018).
Among other renewable energy resources, wind energy for electricity generation is a promising clean, inexhaustible source, growing rapidly with an annual growth of approximately 30% (Global Wind Energy Council GWEC, 2015). If this commitment to transition and diffusion of wind power generation continues to scale up, this may lead to saving up to 23 billion tons of CO2 emissions by 2030 besides proven benefits of demand curtailment, employment generation, infrastructure development, and community service (GWEC Global Wind Energy Council, 2017).
It is also pertinent to report that according to the International Renewable Energy Agency (IRENA), the onshore wind levelized cost of energy (LCOE) may decrease from USD 0.06 per kilowatt-hour (kWh) to USD 0.03–0.05/kWh in the years 2018–2030 and is likely to fall to USD 0.02–0.03/kWh until the year 2050 (IRENA, 2016).
Its strategic location and its arid mainland corridors having moderate-to-high winds make Pakistan to harness wind energy. In particular, the two provinces of the country, Sindh and Baluchistan, are blessed with wind energy resources. Many researchers (Harijan et al., 2011; Saeed et al., 2021) have estimated and compared the cost of wind energy, especially in the Sindh province with conventional grid-connected thermal power, and concluded wind power to be very competitive, even without considering the externalities (Mohsin et al., 2019).
The current power generation portfolio of Pakistan is depicted in Figure 2, mainly comprising fossil resources such as oil and natural gas. The import of electrical appliances and equipment at lower costs improved lifestyle of people, and urbanization has also increased the electricity demand at the rate of 8% per year. This immense increasing demand for electricity is expected to rise to 114 GW in 2030. This situation is alarming from an energy security perspective because these indigenous resources are limited in the country, whereas the discovery of new reserves is unpredictable.
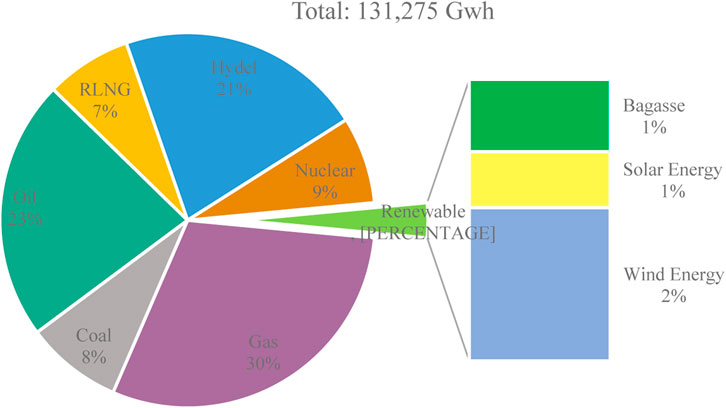
FIGURE 2. Electrical energy generation mix of Pakistan 2017–18 (HDIP Ministry of Energy Government of Pakistan, 2019).
Electricity plants based on fossil fuels are adversely impacting the environment. It is estimated that approximately half of the greenhouse effect is from the GHG emissions of thermal power plants. The World Bank has reported that the estimated cost of environmental degradation is about 6% of GDP per year (G. of Pakistan, 2019). This severe financial damage to the environment is a non-considerate part and is generally paid indirectly by the people through clinical maintenance, taxes and levy, health insurance, and compromised living standards. Since, mitigation of GHG emissions has now become an essential national agenda in many countries, Pakistan is also no exception. The climate change scenario of Pakistan is too multifaceted due to diverse factors; the vulnerability index of climate change of the country is high in contrast to various other developing countries. The country is, therefore, susceptible to changes in climatic conditions that have caused a rise in temperature, precipitation patterns, weather shifts, melting of glaciers, floods, and earthquakes. The National Economy and Environmental Development Study (NEEDS) reported that climate change-induced extreme events and flood disasters cost between USD 7–14 billion per annum. Moreover, Pakistan owes a huge burden of USD 10.68 billion of circular debt of the power sector causing a rack on the already unstable economy. The causes of the circular debt are non-technical losses, improper management, policy lacking, unstable economy, increasing domestic demand, low industrial and commercial demand, government subsidies, and excessive dependency on imported fuel used for power generation. Thus, switching to clean fuel for power generation such as wind energy sets can generate CERs under the Clean Development Mechanism (CDM) or National Appropriate Mitigation Actions (NAMA).
The Government of Pakistan has recently set very specific and ambitious targets to attain the diffusion of renewable energy in the power generation mix under Alternative and Renewable Energy Policy 2019. Wind power generation has been assigned key significance and considered as a priority RE resource in the policy. However, implementation of such determined policies requires systematic analysis such as the assessment of the technical potential and forecast the diffusion of wind power technology. Such analysis would greatly help the country to devise future investments and undertake any macro-level policy interventions and planning for the welfare of its people. In this context, the Levenberg–Marquardt algorithm (LMA) optimization method is employed in this study to estimate the parameters of the logistic model to improve the forecasting precision of wind energy in Pakistan for the study period 2020–2050. The study results are expected to significantly contribute to the contemporary literature and supplement the efforts of energy planning and policymakers in identifying the technical potential of wind energy generation on real grounds. This will allow the viability of wind energy generation penetration and development strategy for stakeholders within the country. Furthermore, this study also seeks to forecast revenue generation from the diffusion of wind energy generation in the system.
Section 2 of the study provides a summary of the relevant literature, while section 3 provides a detailed assessment of wind energy potential across Pakistan. The extended description of the methodology used to achieve the aim and objectives of this study is explained in section 4. The study result, discussions, and conclusion of the study are provided in section 5 and section 6, respectively.
The assessment of wind energy resources in the country requires an imperative approach including forecasting annual electrical energy production and CERs. In this context, a limited number of relevant studies for Pakistan are reported in the literature with certain details and limitations. The review of these studies for Pakistan and other relevant studies are as follows:
Raju et al. (2020) employed the Moth-flame optimization algorithm for assessing the wind energy potential in India, both onshore and offshore. Teimourian et al. (2020) employed the Weibull probability density function and assessed the wind energy potential in the southern province of Iran, and Nazari et al. (2020) used the TOPSIS method for the selection of wind sites in Iran. This technique has also been used in other studies (Khahro et al., 2014; Ahmad et al., 2019; Khalid Saeed et al., 2019) for estimating the wind energy potential of Pakistan. Shoaib et al. (2019) assessed the wind energy potential of Jhampir using the wind energy conversion systems. Umaid Ali et al. (2017) analyzed the wind energy potential with an optimum wind blade design for the Jamshoro wind corridor. Shami et al. (2016) evaluated the wind energy potential of three provinces of Pakistan based on wind data; besides, it also evaluated suitable geographical locations for the installation of grid-connected wind farms. Glasson (2021) highlighted evolution of the United Kingdom’s offshore wind farms and its community benefits in a macro study of the adoption of community benefits approaches across the industry. Cai et al. (2022) investigated the integration of hydrogen storage systems and wind generation in a power system under a demand response program. Harijan (2008) estimated the grid-connected wind energy potential of Pakistan in addition to the estimation of a suitable geographical area for the installation of wind power in Pakistan. da Silva (2017) estimated grid-connected projects of photovoltaics in all regions of Brazil using the system advisor model (SAM).
The diffusion of wind energy resources in context of Pakistan is assumed to be progressing due to the role of domestic policy on renewable energy that enables to adapt and develop in the country. Numerous modeling approaches have been considered in the literature, such as Jha and Saha (2020) forecasted and analyzed broadband diffusion in India having 3G and 4G characteristics. They have used multiple growth models and found that logistic can explain well the diffusion of MBS in India. Zhang et al. (2020a) estimated adoption patterns of a one-way carsharing system in its initial years using the diffusion model. Shaikh and Ji (2016) used a logistic and logistic population model to forecast natural gas demand in China. The Levenberg–Marquardt algorithm (LMA) has estimated the parameters of the logistic model to enhance the forecasting precision. Siemek et al. (2003) estimated a long-term natural gas demand employing logistic modeling for Poland. The parameters of the logistic model have been estimated using the Gauss–Newton algorithm and reported an average error prognosis of up to 20%. Forouzanfar et al. (2010) projected natural gas demand for residential and commercial consumers in Iran using a logistic modeling approach. The parameters have been estimated using a genetic algorithm (GA) and non-linear programming (NLP) with less than 10% average percent error. Melikoglu (2013) projected a long-term natural gas demand using the logistic modeling approach for Turkey and compared their results with linear modeling. Melikoglu (2013) estimated parameters of the logistic model using the SigmaPlot 11 optimization tool and reported enhanced performance than a linear model. The life-long processes have generally used the logistic modeling approach and have been employed in estimating and projecting the data in different fields such as estimation of natural gas consumption in Poland (Siemek et al., 2003), natural gas consumption for residential and commercial sectors in Iran (Forouzanfar et al., 2010), estimation of the investment thresholds of large Japanese manufacturers (Honda and Suzuki, 2000), and for forecasting wind energy diffusion in particular wind energy generation technological paradigm diffusion (Xu et al., 2016a), including wind power diffusion in Europe (Söderholm and Klaassen, 2007), modeling international wind energy diffusion (Diaz-Rainey, 2012), and predicting accuracy of wind power technology diffusion models across countries (Dalla Valle and Furlan, 2011). Harijan et al. (2011) used a logistic modeling approach to estimate the long-term diffusion of wind energy in Pakistan and estimated the parameters using the OLS principle. Lund (2006a) used a logistic modeling approach to estimate the long-term diffusion of wind energy in India. This study estimated the parameters of the logistic model by using the OLS principle.
The diverse climatic conditions and high vulnerability index of Pakistan have pushed the country to consider renewable energy technologies for electricity generation using wind energy as one of the key renewable resources. In this context, various studies in the local context have identified the computation of CERs, such as (Zhang et al., 2020b) has deployed a difference-in-differences (DID) method for evaluating economic growth and carbon emissions using the emission trading system (ETS) and proposed a carbon trading policy by implementing renewable energy–based projects. Li et al. (2019) compared the cost-saving effect before and after implementing the cost-saving certified emission reductions (CCER) scheme. In addition, Lin and Raza (2019) evaluated and analyzed CO2 emissions for power generation from the year 1978–2017 using the Logarithmic Mean Division Index of Pakistan. It is estimated that approximately 277.9 Mt of CO2 emissions are expected in 2035 only from the power sector. El Haj Assad et al. (2021) modeled CO2 emissions of Middle Eastern countries using intelligent methods. Sajid (2020) computed industrial emissions and both directly and indirectly embodied the magnitude of the final pull effects on intermediate industrial emissions in Pakistan. Mengal et al. (2019) referred official electricity demand forecast and proposed four supply-side scenarios for the study period (2013–2035) using the Long-range Energy Alternatives Planning System (LEAP) software tool and also estimated the emission under the developed scenario. Yousuf et al. (2014) estimated the baseline emission factor of the power generation sector considering net efficiencies of annual fossil fuel consumption, annual energy outputs, and carbon emissions. This study proposed a baseline emission factor for power generation-weighted average as 0.606 tCO2/MWh (tons of carbon dioxide per megawatt-hour) for wind and solar power projects in Pakistan. These findings outlined the potential of generating CERs through GHG abatement deploying renewable energy-based power projects (Amatayakul and Fenhann, 2012). The CERs achieved from these projects are a tradable commodity as defined by the Kyoto Protocol and UNFCCC which shall provide additional capital flows into developing countries such as Pakistan, thereby accelerating technology transfer and encouraging penetration and dissemination of cleaner technologies (Anil, 2012).
The existing literature suggest that various aspects of renewable energy diffusion penetration have been investigated using different methods; however, on the technical potential, diffusion, and estimation of CERs from wind energy resources, it does not provide any appropriate insight and suggest requisite measure toward the achievement of ambitious RE policy. To address this gap, a modeling framework based on the Levenberg–Marquardt algorithm (LMA) optimization method has been designed to forecast the technological diffusion of wind power generation in the existing fuel mix of Pakistan. The comparison of various research studies undertaken on the potential and forecasting of wind energy based on various models and locations is given in Table 1. The key contributions from this research includes 1) assessment of technical potential based on the theoretical and geographical aspects using the system advisor model (SAM). 2) Scenario-based modeling of medium to long-term wind energy generation forecasting in Pakistan. The forecasting accuracy and precision have been enhanced using the Levenberg–Marquardt algorithm (LMA) optimization strategy to optimally find the intrinsic parameters of the logistic modeling approach. 3) The CERs, as a result of the implementation of wind-based projects, have also been forecasted, which may help to earn the carbon revenue. It is apparent from Table 1 that this research has considered all major aspects of potential and forecasting of wind energy, that is, theoretical, geographical, technical, future penetration, and CERs.
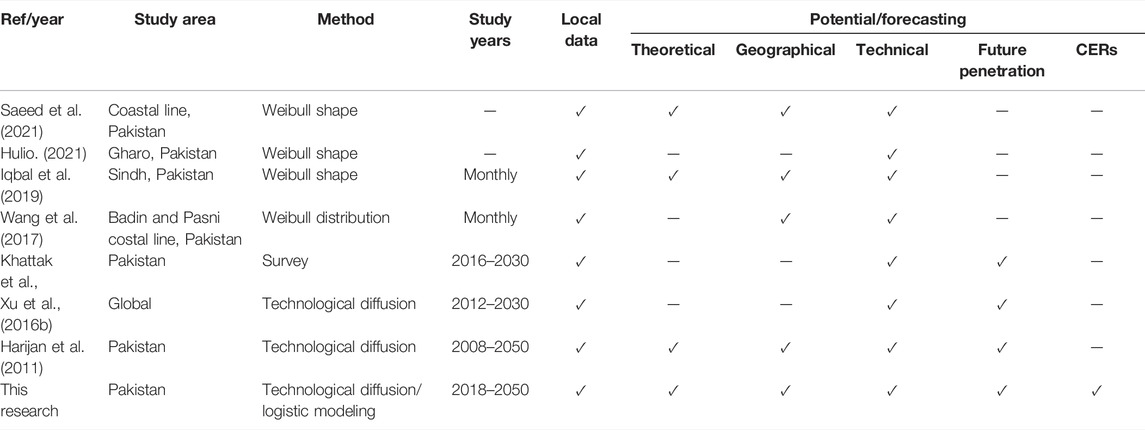
TABLE 1. Summary of the literature focused on the potential and forecasting of wind energy.
The coastline is extended to 1,050 km, of which 250 km is in the Sindh province and the rest 800 km is in the Baluchistan region (Harijan, 2008). The Pakistan Meteorological Department (PMD) under the wind mapping project has recorded wind speed and its direction at 45 locations in coastal areas. NREL in collaboration with USAID has installed ground-based wind mapping stations at 12 different locations. The data from wind masts are validated with previous data of PMD and NASA satellite imaging data. The validated maps are published on (DTU Wind Energy and World Bank Group, 2018). The potential of wind power generation has been projected using a reference wind turbine and the Weibyull K factor-based on-site data.
A GIS wind speed map of 100 m along with wind measurement stations is shown in Figure 3. It is obvious from the figure that Sindh and Baluchistan have high wind potential as compared to that of other provinces. Major wind resource areas of Pakistan are given in Table 2.
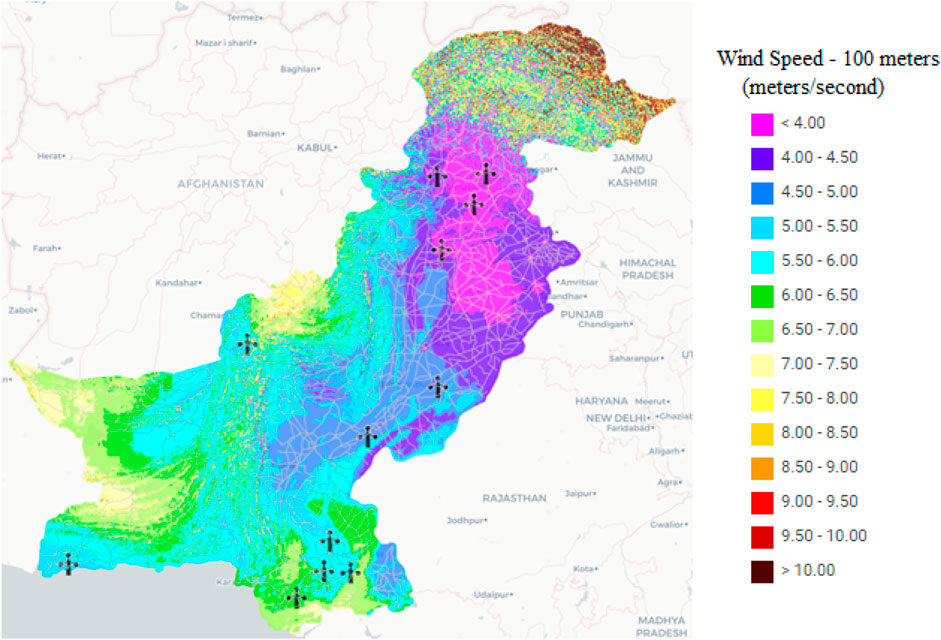
FIGURE 3. Wind map of Pakistan (NREL GIS, 2020).
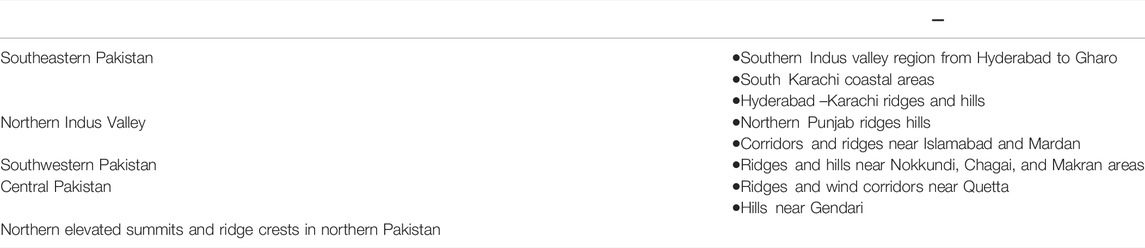
TABLE 2. Potential sites for wind power generation in Pakistan (Shami et al., 2016).
AEDB reported that approximately 346 GW gross wind energy resources are available in Pakistan (Harijan, 2008). The Pakistan Metrological Department (PMD) survey reported that the Sindh–Gharo Wind Corridor has a huge wind power potential of about 44 GW out of this 11 GW is exploitable and may be connected with the grid (Shami et al., 2016), (Chaudhry, 2003).
In Sindh, about 10,000 km2 is available for wind farming at its coastal areas, with an average wind speed of 7 m/s at 50 m height. It is estimated that with 25 Nordex N43/600 wind turbine models, the levelized cost of electrical energy will be 15 MW/km2 with approximately 4 to 5 ¢/kWh. Farooqui (2014) estimated to install 25 GW of wind power generators by 2030. The capacity utilization factor of the wind power technology is taken as 34% (Amer and Daim, 2011).
The theoretical wind power potential as studied by the NREL report is 346 GW (Shami et al., 2016; Farooq and Tayyab, 2014). ESMAP has published wind maps using satellite data and ground-based measurement data; the observed theoretical wind potentials at different heights of 50, 100, and 200 m at wind speeds of 6.63, 7.45, and 8.15 m/s are 345, 486, and 672 W/m2, respectively (DTU Wind Energy and World Bank Group, 2018).
The geographical potential considers the location constraints where wind power turbines may be installed, this helps eliminate areas that are not suitable such as protected spots (national parks and forests), watery areas, high altitude regions, political zones (high populated cities), and living zones. The geographical potential of the coastal areas of Pakistan estimated by Harijan (2008) is 22,700 km2, with a suitability factor of 0.38 and total area of 59,500 km2 for wind power installation.
Pakistan had been slow in exploring wind power resources until 2013. However, PCRET (Pakistan Council of Renewable Energy Technologies) in 2002 installed 14 micro wind turbines (of capacity, six of 500 W each and eight of 300 W each) to demonstrate true potential in Pakistan coastal zones. Around 1,500 houses in the remote coastal villages of Sindh and Baluchistan have been electrified with the installation of 153 kW wind turbines.
The Alternative Energy Development Board has been tasked to install at least 9.7 GW by 2030, which would contribute around 5% of total planned national power generation at that time. The AEDB has developed a policy framework to attract private investors. Currently, around 23 national and international wind power companies have achieved commercial operation with a cumulative installed capacity of 1244 MW; one project is under construction and four are at the LOI stage. The current installed capacity of wind projects and future expected integration is shown in Figure 4.
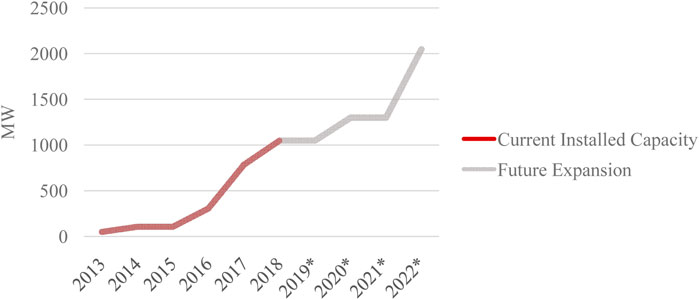
FIGURE 4. Current installed capacity and future expansion of grid-connected wind power in Pakistan (NEPRA-National Electric Power Regulatory Authority, 2018).
The prime goal of this study is the collection of data for assessment of technical potential, medium to long-term forecasting, and certified emission reduction. The various sources of data have been mentioned in detail; wind data have been collected from the Pakistan Meteorological Department (PMD) (Shami et al., 2016). The geographical potential based on suitable available areas has been considered from Harijan (2008). The viable areas for wind energy generation having capacity utilization factors have been identified from Harijan (2008). The installed capacity of wind plants has been taken from the state of industry report from the National Electric Power Regulatory Authority (NEPRA) (NEPRA-National Electric Power Regulatory Authority, 2018). Moreover, the computation and forecasting of certified emission reductions of fuels require intrinsic parameters data which has been taken from HDIP Ministry of Energy Government of Pakistan (2019), Yousuf et al. (2014), and IPCC (2020). Overall, the workflow of the assessment, forecasting, and emission reduction is shown in Figure 5.
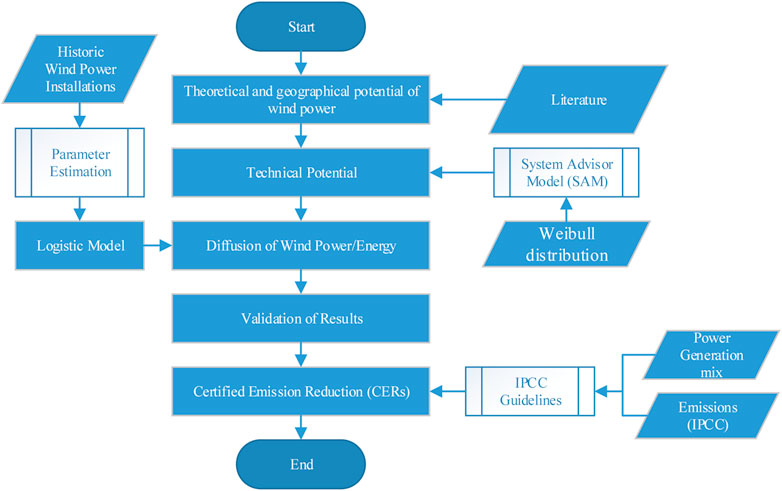
FIGURE 5. Methodological workflow.
The technical potential of wind electricity generation systems has been computed using the system advisor model (SAM). The wind turbine type selected is, namely, Nordex S70 1500 kW. This type of turbine is being used since the leading wind power companies have installed it in Pakistan. The parameters used in the model are given in Table 3. A total of nine turbines per field have been used and standard turbine spacing has been taken. The Nordex S70 turbine power curve is given in Supplementary Figure S1.
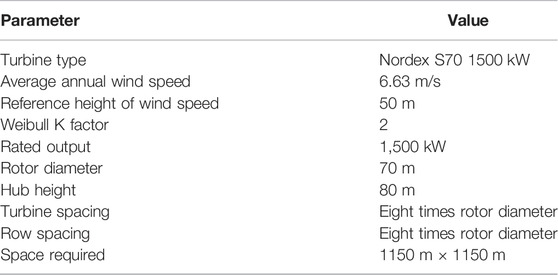
TABLE 3. Wind turbine model parameters (Shoaib et al., 2019; Shami et al., 2016; DTU Wind Energy and World Bank Group, 2018; U. D. of Energy; Lund, 2006b).
The data of Table 3 were used in the wind turbine module of the SAM; the results show that about 42 GWh/year can be generated from the modeled wind farm. Total technical wind energy generation yield can be estimated from the following equation (Harijan et al., 2011; Lund, 2006b):
where TWE is the total technical wind energy generation yield from the available geographical area in TWh, GAwp is the total geographical area available for wind power in Km2, WEf is the wind energy generation from nine turbines, and AWf is the area of each wind farm in Km2
The capacity utilization factor (CUF) of wind energy varies from 36% in Jamshoro, Sindh to a minimum of 6.6% in Mand, Balochistan with an average value of 25% (Harijan, 2008); hence, this study considers three CUF values, that is, 30, 25, and 20% to estimate the technical wind power installed capacity. Total wind power capacity can be estimated from the following equation (Harijan et al., 2011):
where TWPC is total wind power capacity, CUF is the capacity utilization factor, and 8,760 is the number of hours in a year.
Various studies have been conducted on the development of a semi-empirical deterministic model based on the logistic growth curve. The model based on the diffusion may adapt to an S-curve, as given in Supplementary Figure S2. This most popular curve of diffusion follows the moderate slow growth initially, followed by the rapid rate of change in growth, and then attains a steady finite upper limit to the diffusion. The research studies of Shaikh and Ji (2016) proposed logistic growth of natural gas in China based on population; Purohit and Michaelowa (2007a) have studied the future installation of wind energy systems through a scenario-based approach; Lund (2006a) have proposed wind energy diffusion using ordinary least square method for parameter estimation and forecasting.
The wind power diffusion may be forecasted for Pakistan employing the logistic model presented in Eq. 3 (Harijan et al., 2011; Shaikh and Ji, 2016), and associated power generation can be estimated from Eq. 4 (Harijan et al., 2011).
where
where AEP(t) is the annual electricity produced in year t, CUF is the capacity utilization factor, and N(t) is forecasted wind diffusion in year t.
The diffusion path of wind power forecasting model parameter values has been reciprocated for modeling strategy. The logistic model coefficients would be projected if technology market data is available for four or more periods. The logistic modeling approach follows the historic data pattern of utility-scale wind power generation using estimated intrinsic parameters. Therefore, it is significant to estimate and optimize these parameters that can best fit with the historical data of wind power generation.
This study proposes a set of three future scenarios that have been developed to depict possible diffusion levels of wind power systems. The scenarios are elaborated as business as usual (BAU) scenario, high wind energy penetration (HWEP) scenario, and moderate wind energy penetration (MWEP) scenario. Furthermore, the capacity utilization factor based on the literature has been kept for each scenario at 20, 25, and 30% for wind energy generation forecast. This will substantiate the robustness of the model studied.
The accurate estimation of the parameters is significant for successful modeling and forecasting. The estimated intrinsic parameters (Dmax, α, and tmax) of the logistic model that best fit the historical data of wind energy generation are optimized.
In this research to estimate Dmax, α, and tmax a logistic model is fitted with actual data of grid integrated wind turbines from the year 2013–2018 by minimization of the sum of the square errors (SSE) between the actual and forecasted data. SSE has been considered as an objective function for the estimation of the unknown parameters. The object function is mathematically depicted as follows:
where NA is the actual grid integration of wind turbines; NF and t are the dependent and independent variables; and p is the number of parameters to be estimated by the logistic function N(t).
The logistic function parameter optimal value is led through the minimum value of SSE. The objective function is described in Eq. 5 (Shaikh and Ji, 2016) and cannot be resolved ordinarily due to non-linearity in model characteristics. Therefore, the numerical, or iterative method based on the least square is appropriate in solving such objective functions.
The Levenberg–Marquardt algorithm (LMA) also known as the damped least square method is assumed as the strategic iterative solution in applications pertaining to optimization. In this study, LMA is devised to extract converged non-linear parameters. It is a hybrid technique that uses Gauss–Newton (GN) and Gradient Descant (GD) iterative strategies. Primarily GD is initiated due to its less sensitivity to initial values, later GN takes over the computation and accelerates the solution to optimality through its iterative process. Detailed implementation and theory of LMA are explained in Ranganathan (2004) and Moré (1978); however, its working in particular to the estimation of logistic modeling parameters is explained in Shaikh and Ji (2016).
The goodness of fit of the proposed modeling and forecasting has been statistically verified with R-squared (R2), which depicts dependent variable percentage variance and measures the model and dependent variable relationship strength. The logistic model fits the data well if the difference between the observations and predicted values is small and unbiased, which is referred to as the coefficient of determination.
The number of certified emission reductions (CERs) has been regarded as the quantum of carbon credits that the project can earn as per UNFCC guidelines. These credit points can be sold in the international market to earn revenue in foreign exchange. The input data for the operating margin emission factor has been taken from Pakistan Energy Yearbook 2018 and International Panel on Climate Change (IPCC). The computations have been made for the unit of electricity generation (tCO2/MWh) and weighted average CO2 emissions of each power plant (fuel based includes coal, furnace, diesel oil, and natural gas) serving the national system. The fuel consumption and net electricity generation of each power plant have been considered in computations, as shown in the following equation (IPCC, 2020; Yousuf et al., 2014):
where EFgrid, OMsimple, y is CO2 emissions factor operating margin in year y (tCO2/MWh); NCVi,y is fossil fuel net calorific value (energy content) i in year y (Joules(J)/mass or volume unit); FCi,m,y is amount of fossil fuel type i consumed by power plant m in year y (mass or volume units); EFCO2,i,y is CO2 emissions factor of fossil fuel type i in year y [tCO2/Giga Joules (GJ)]; EGm,y is power plant/unit net electricity generated and delivered to the grid m in year y (MWh); m is all power plants serving the grid in year y; i is combusted fossil fuels in power plant/unit min year y; and y is the year of monitoring or most recent 3 years of available data. The Annual Certified Emission Reductions (CERs) in MtCO2 can be calculated from the following equation (Purohit and Michaelowa, 2007b):
where ACER(t) is Annual Certified Emission Reductions in MtCO2 from wind power generation in year t.
This study primarily conducted diffusion analysis of wind energy and certified emission reductions assessment to verify the estimated potential of wind energy generation in Pakistan. This technical potential, forecasting, and emission reductions allow the policymakers to assess their feasibility to measure the utilization rate of technology, curtailment level, and percentage of electricity demand met by wind generators.
The total technical wind energy is the energy yield that can be achieved for the complete available geographical area, which is 22,700 Km2 as discussed in the aforementioned section. However, as the model selected consists of nine wind turbines that cover an area of around 1.3 km2 so available geographical area with the selected model can produce 725 TWh/year. Therefore, to utilize this huge potential, 27 projects have been commenced with a 1,347.4 MW cumulative capacity, of which six projects of 308.2 MW are already commissioned and supplying power to the national grid, while 479 MW of 09 projects are under construction. Moreover, 12 projects of 562.2 MW are at different stages of development (HDIP Ministry of Energy Government of Pakistan, 2019). The total wind power installed capacity of Pakistan is 275, 331, and 414 GW at capacity utilization factor (CUF) of 30, 25, and 20%, respectively.
The diffusion of wind generation in the existing energy mix has been established based on three future scenarios in this study. The scenarios are business as usual (BAU), high wind energy penetration (HWEP) scenario, and moderate wind energy penetration (MWEP) scenario.
The BAU scenario offers a futuristic strategy with similar driving factors as apparent for the installation of wind energy systems, with not many policy changes or occurrence of radical events, or even causes of major disruption. The MWEP and HWEP scenarios assume that wind energy system installations would be 5 and 10% greater than those of the BAU scenario, respectively. This may be due to possible driving forces of subsidized RE market, policy interventions, carbon taxes, and awareness. Furthermore, the capacity utilization factor based on the literature has been kept for each scenario at 20, 25, and 30% for wind energy generation forecast. This will substantiate the robustness of the model studied.
The maximum technology utilization potential of wind power in Pakistan is taken as 120 GW. This is due to the economic conditions, grid limitations, and land area availability. The model parameters have been estimated through the logistic modeling approach from Eq. 3 using the Levenberg–Marquardt algorithm (LMA). The LMA has optimally computed Dmax, α, and tmax for the period of 2013–2018 and are presented in Table 4.
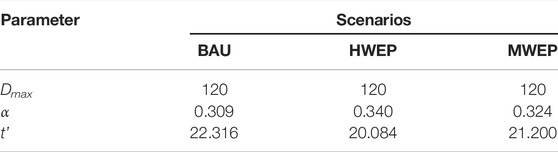
TABLE 4. Wind power diffusion model parameters.
The actual installed wind generation capacity precisely followed the trend of all three scenarios, as depicted in Figure 6. The adjusted coefficient of determination (R2) of the proposed model is BAU (0.89), HWEP (0.88), and MWEP (0.91). This determination metric indicates the strength of the relationship (variance) from actual installed wind generators. The proposed logistic model has been validated, as in Figures 7A,B, with the literature as well as with actual data. The proposed logistic model has been very aligned with the actual data available, whereas the literature has shown huge deviation from the actual data set as well as the proposed model. Although the trend has been followed but the forecasting is in good agreement with the actual trend.
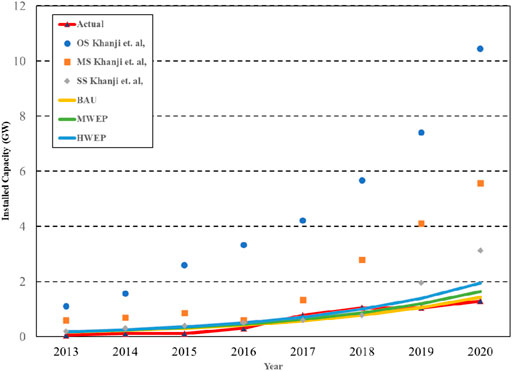
FIGURE 6. Model comparison and validation with existing literature.

FIGURE 7. (A) Projected cumulative installed capacity and (B) projected capacity additions of wind power in Pakistan.
The projected installation capacity has been computed using Eq. 3 under various scenarios, as depicted in Figure 7A. This indicates the growth pattern for wind installation and integration as of its early years; the growth rate is meager due to lack of confidence, maybe certain stakeholders’ resistance, and learning curve to implement new technology. This S-shaped characteristic graph of projection has a mid-portion and shows exponential growth, but the growth rate slows again approaching the maximum limit. In Figure 7B, the capacity addition growth rate for each year has been depicted, which primarily represents the transition. This refers to a capacity enhancement up to the inflection point corresponding to the years 2033, 2034, and 2035 for HWEP, MWEP, and BAU scenarios, respectively. The maximum installed capacity in a particular year may reach up to 10.11, 9.60, and 9.30 GW, respectively, for HWEP, MWEP, and BAU. As the installation capacity tends toward the upper limit the growth rate would slow down gradually and maintain at the lower threshold. This predicts that the years 2033 to 2035 would be crucial for huge investment and installation of wind farms in all scenarios, and policymakers must be aware and plan the appropriate sites and infrastructure to utilize this indigenous clean energy.
The generation of electricity from the estimated wind farms has been forecasted considering 20, 25, and 30% capacity utilization factor (CUF). The capacity factors have been taken as an average wind speed that has been varying with locations (Harijan, 2008). However, wind locations with a CUF of less than 20% are not considered in this study. The wind power and electricity generation cumulative capacity estimation for proposed scenarios in the years 2025, 2035, and 2045 are shown in Table 5. It is projected that about 66.3, 77.0, and 87.5 GW of wind turbine projects may be developed and installed until 2035 under BAU, MWEP, and HWEP scenarios, respectively. The proposed estimated installed capacities are approximately 55, 64, and 73% of the total wind power generation technical potential of Pakistan. If policymakers would like to have wind penetration at a faster rate within the next 15 years, then the 3/4th potential could be utilized in the energy mix.
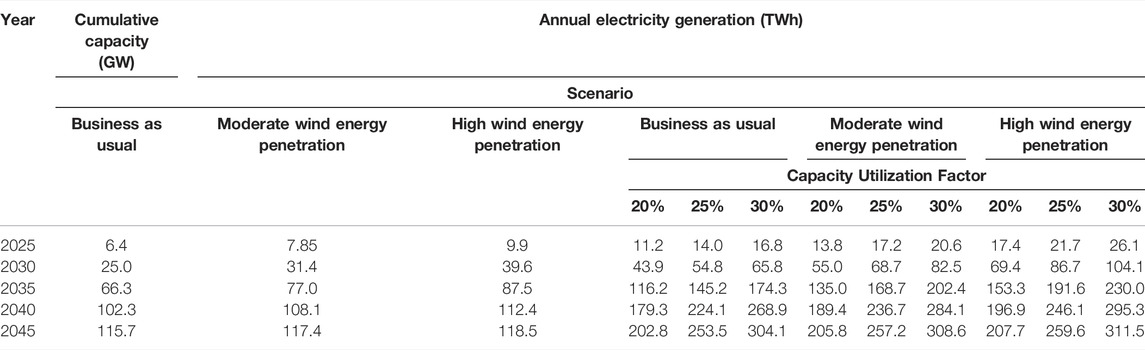
TABLE 5. Wind power and electricity generation cumulative capacity in Pakistan under various scenarios.
The diffused wind energy may generate annual electricity under all scenarios and their respective CUFs using Eq. 6, as depicted in Figures 8A–C. Therefore, in the year 2033, wind power systems would generate approximately 121.3, 151.7, and 182.0 TWh of electricity under HWEP scenario with 20, 25, and 30% CUF, respectively, and 118.7, 148.4, and 178.0 TWh in the year 2034 under MWEP scenario with respective CUFs. However, it would generate 116.2, 145.2, and 174.3 TWh in the year 2035 under BAU with respective CUFs. This project allows appropriate generation of power from the wind generator sets that would feed the system and substantially contributes to the energy mix of the country.
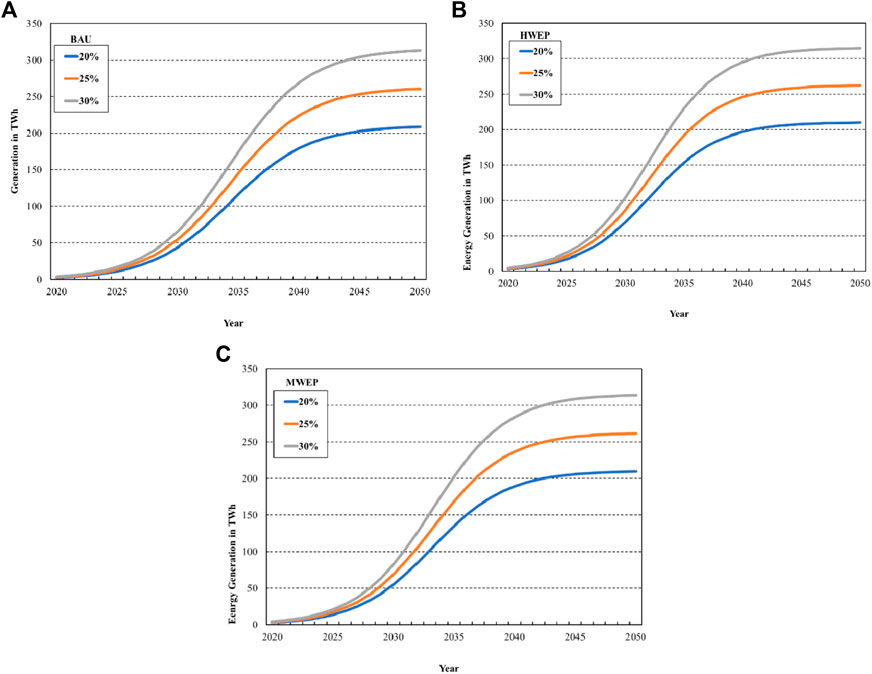
FIGURE 8. Projected cumulative electricity generation from wind power under (A) BAU scenario, (B) HWEP scenario, and (C) MWEP scenario.
The computation of the grid emission factor has been determined as 0.495 MtCO2/TWh for the base year. The expected annual certified emission reductions (CERs) under various scenarios and CUFs are depicted in Figures 9A–C. In the year 2033, wind power systems forecast about 60, 75, and 90 million of CERs under the HWEP scenario with 20, 25, and 30% CUF, respectively, and 58.7, 73.4, and 88.1 million CERs in the year 2034 under the MWEP scenario with respective CUFs. However, approximately 57.5, 71.8, and 86.2 million CERs have been forecasted in the year 2035 under BAU with respective CUFs. Expected Annual CERs in different scenarios with respected CUFs are shown in Table 6.
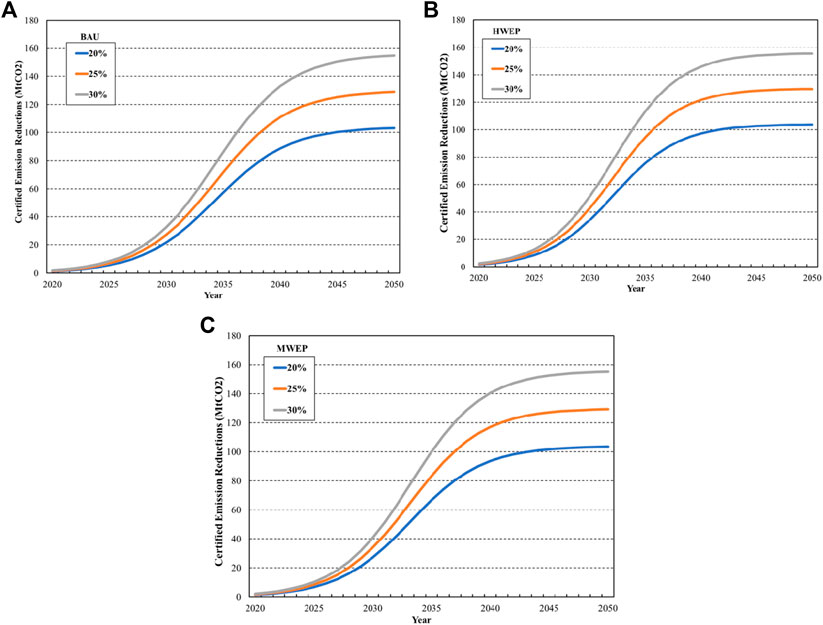
FIGURE 9. Annual emission reduction from wind power under (A) BAU scenario, (B) HWEP scenario, and (C) MWEP scenario.
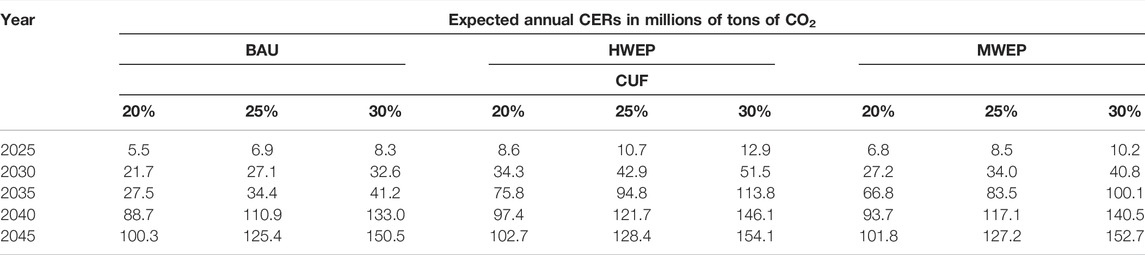
TABLE 6. Expected annual CERs in different scenarios.
This offers definite prospects of transforming grids cleaner by diffusing wind energy generators, results in abating the CO2 emissions. The numbers regarded with each scenario and their respective CUFs allow trading of CERs in the international market under CDM and NAMAs and generate financial revenue from the project.
In this study, the technical potential assessment and forecasting of wind power generation in Pakistan, based on the feasible potential of wind power installations, has been undertaken. The Levenberg–Marquardt algorithm (LMA) optimization method with NREL’s SAM model has been used for the potential assessment. The technical potential of wind power in this study is estimated to be 725 TWh/year, which is duly in line with ongoing developments in the wind energy sector of the country. The logistic modeling approach undertaken is based on medium to long-term diffusion of wind power generation. The LMA deployed has successfully estimated the intrinsic parameters to optimally forecast the diffusion. The accuracy of the model is tested with the goodness of fit which strongly supports considering the results of this research. These results have also been compared and duly validated from the contemporary literature and relevant government data to follow the predicted trend.
Based on the results of this research, it is concluded that
⁃ The proposed model is reasonably well aligned with real intrusions of wind power diffusion in the system
⁃ Three scenarios of study, that is, BAU, MWEP, and HWEP, predict that maximum wind power installation would come online during the period 2033–2035, thereby bringing huge investments in the sector
⁃ It is estimated that during the study period, around 55, 64, and 73% wind potential in total could be technically exploited under each of three scenarios, respectively
⁃ In the BAU scenario, approximately 66.3 GW of wind power installations are estimated in the year 2035, which could generate around 116, 145, and 174 TWh of electricity and 27, 34, and 41 of expected annual CERs in million tons of CO2 with 20, 25, and 30% capacity utilization factor, respectively
⁃ In the MWEP scenario, approximately 77 GW of wind power installations are estimated for the year 2035, which could generate around 135, 169, and 202 TWh of electricity and 67, 84, and 100 of expected annual CERs in million tons of CO2 with 20, 25, and 30% capacity utilization factor, respectively
⁃ In the HWEP scenario, approximately 86 GW of wind power installations are estimated in the year 2035, which could generate around 153, 192, and 230 TWh of electricity and 75.8, 94.8, and 113.8 of expected annual CERs in million tons of CO2 with 20, 25, and 30% capacity utilization factor, respectively
⁃ An average 20–30% capacity utilization factor of 105–158 CERs in million tons of CO2 could be earned during the year 2050
This research study’s results provide some significant insights pertaining to wind energy assessment, briefly summarized before; therefore, various specific recommendations have been devised and provided as follows:
⁃ Proper utilization of wind power potential, aggressive installation strategy, and R&D in this area can only enable the country to produce affordable electricity
⁃ Harnessing wind energy along with other renewable and indigenous energy resources would help this country to attain energy security
⁃ Renewable energy development would greatly help to contain the climate change for this environmentally vulnerable county and at the same time would help to achieve its Nationally Determined Contributions (NDCs) under Paris Agreement
⁃ Since, most equipment and parts of the wind power system are imported, which not only increases the cost but also drains foreign reserves of the country, the indigenous market of these systems should be developed
⁃ Central and scheduled banks should encourage and facilitate sustainable energy financing with minimum interest for wind power installations
⁃ Transparent energy policies along with institutional support should be developed
⁃ Public awareness regarding sustainable energy technologies should be enhanced
⁃ Local R&D teams and research centers should be developed to encourage universities/public institutions to conduct wind energy research and include the same in the curriculum
It is anticipated that considering the results of this and other relevant studies, and the recommendations given above, wind energy would become a key energy carrier in the overall energy mix of Pakistan. It is also expected that an increased share of wind and other RE resources would help to contain climate change and ensure sustainable development.
This research study attempted to estimate wind energy potential and forecasts wind power market penetration of Pakistan considering three different scenarios for the period 2020–2050. In the future, this work could be extended considering more scenarios as well as analyzing these in varying time horizons. As a future recommendation, it is also proposed to undertake a detailed study to assess various RE resource potential and forecast their market penetration to have a fairly realistic scenario to ensure energy transition in the long run.
The original contributions presented in the study are included in the article/Supplementary Material, further inquiries can be directed to the corresponding author.
SK: conceptualization, data curation, formal analysis, investigation, methodology, visualization, and writing—original draft. KH: conceptualization, formal analysis, writing—review and editing, supervision, and project administration. MU: conceptualization, formal analysis, writing—review and editing, supervision, and project administration. SS: conceptualization, formal analysis, writing—review and editing, supervision, and project administration. NM: formal analysis, visualization, and writing—review and editing. LK: formal analysis, visualization, and writing—review and editing.
The authors declare that the research was conducted in the absence of any commercial or financial relationships that could be construed as a potential conflict of interest.
All claims expressed in this article are solely those of the authors and do not necessarily represent those of their affiliated organizations, or those of the publisher, the editors, and the reviewers. Any product that may be evaluated in this article, or claim that may be made by its manufacturer, is not guaranteed or endorsed by the publisher.
This work was supported by the Higher Education Commission (HEC), Pakistan, under the National Research Support Program for Universities (NRPU), Project ID. NRPU/4762 of 2016, and also funded by Mehran University of Engineering and Technology, Jamshoro; the authors highly acknowledge their contribution.
The Supplementary Material for this article can be found online at: https://www.frontiersin.org/articles/10.3389/fenrg.2022.860092/full#supplementary-material
Ahmad, A., Husssain Mangi, F., Fazlani, Y., Chachar, A., and Khan, K. (2019). Wind Potential Assessment Analysis of Jhampir, District Thatta Sindh, Pakistan. Mehran Univ. Res. J. Eng. Technol. 38 (3), 571–580. doi:10.22581/MUET1982.1903.04
Amatayakul, W., and Fenhann, J. V. (2012). Electricity Sector Crediting Mechanism Based on a Power Plant Emission Standard: A clear Signal to Power Generation Companies and Utilities Planning New Power Plants in Developing Countries post.
Amer, M., and Daim, T. U. (2011). Selection of Renewable Energy Technologies for a Developing County: A Case of Pakistan. Energ. Sustain. Develop. 15, 420–435. doi:10.1016/j.esd.2011.09.001
Anil, G. (2012). An Assessment of success of Clean Development Mechanism of Kyoto Protocol in Climate Change Mitigation and Sustainable Development. Int. J. Soc. Sci. Interdiscip. Res. 1 (8), 42
Cai, T., Dong, M., Liu, H., and Nojavan, S. (2022). Integration of Hydrogen Storage System and Wind Generation in Power Systems under Demand Response Program: A Novel P-Robust Stochastic Programming. Int. J. Hydrogen Energ. 47 (1), 443–458. doi:10.1016/J.IJHYDENE.2021.10.027
Chaudhry, Q. Z. (2003). An Investigation of Wind Power Potential at Gharo—Sindh. Technical Report no. 6/2003. Islamabad: Pakistan Meteorological Department.
da Silva, G. D. P. (2017). Utilisation of the System Advisor Model to Estimate Electricity Generation by Grid-Connected Photovoltaic Projects in All Regions of Brazil. Ijseia 11, 1–12. doi:10.14257/ijseia.2017.11.7.01
Dalla Valle, A., and Furlan, C. (2011). Forecasting Accuracy of Wind Power Technology Diffusion Models across Countries. Int. J. Forecast. 27, 592–601. doi:10.1016/j.ijforecast.2010.05.018
Diaz-Rainey, I. (2012). Modelling International Wind Energy Diffusion: Are the Patterns of Induced Diffusion 'S' Shaped? SSRN J. doi:10.2139/ssrn.1635736
DTU Wind Energy and World Bank Group (2018). “Global Wind Atlas,” in Global Wind Atlas. Available at: https://globalwindatlas.info/ (Accessed December 12, 2018).
El Haj Assad, M., Mahariq, I., Al Barakeh, Z., Khasawneh, M., Ali Amooie, M., and Khasawneh, M. (2021). Modeling CO2 Emission of Middle Eastern Countries Using Intelligent Methods. Methods 69, 3767–3781. doi:10.32604/cmc.2021.018872
Farooq, A., and Tayyab, K. (2014). Implementation of a Low Cost Efficient Microcellular Renewable Energy System.” in 2014 International Conference on Energy Systems and Policies (Islamabad, Pakistan: ICESP), 1–5. doi:10.1109/icesp.2014.7346995
Farooqui, S. Z. (2014). Prospects of Renewables Penetration in the Energy Mix of Pakistan. Renew. Sustain. Energ. Rev. 29, 693–700. doi:10.1016/j.rser.2013.08.083
Forouzanfar, M., Doustmohammadi, A., Menhaj, M. B., and Hasanzadeh, S. (2010). Modeling and Estimation of the Natural Gas Consumption for Residential and Commercial Sectors in Iran. Appl. Energ. 87, 268–274. doi:10.1016/j.apenergy.2009.07.008
Glasson, J. (2021). Community Benefits and UK Offshore Wind Farms: Evolving Convergence in a Divergent Practice. J. Env. Assmt. Pol. Mgmt., 2150001. doi:10.1142/S1464333221500010
Global Wind Energy Council Gwec (2015). Global Wind Report 2014. Brussels: Global Wind Energy Council (GWEC).
G. of Pakistan (2019). Pakistan’s Implementation of 2030 Agenda for Sustainable Development Voluntry National Revie. Islamabad. Available at: https://sustainabledevelopment.un.org/content/documents/233812019_06_15_VNR_2019_Pakistan_latest_version.pdf.
Gwec Global Wind Energy Council (2017). Global Wind Report 2016. Brussels: Global Wind Energy Council (GWEC).
Harijan, K. (2008). Modeling and Analysis of the Potential Demand for Renewable Sources of Energy in Pakistan. Jamshoro: Mehran University of Engineering and Technology.
Harijan, K., Uqaili, M. A., Memon, M., and Mirza, U. K. (2011). Forecasting the Diffusion of Wind Power in Pakistan, Energy 36, 6068–6073. doi:10.1016/j.energy.2011.08.009
Hdip Ministry of Energy Government of Pakistan (2019). Pakistan Energy Year Book. Islamabad: Hydrocarbon Development Institute of Pakistan (HDIP).
Honda, Y., and Suzuki, K. (2000). Estimation of the Investment Thresholds of Large Japanese Manufacturers. Jpn. Econ. Rev 51, 473–491. doi:10.1111/1468-5876.00165
Hulio, Z. H. (2021). Assessment of Wind Characteristics and Wind Power Potential of Gharo, Pakistan. J. Renew. Energ. 2021, 1–17. doi:10.1155/2021/8960190
Ipcc, The Intergovernmental Panel on Climate Change. [Online]. Available: https://www.ipcc.ch/links/(Accessed Jun 23, 2020).
Iqbal, W., Yumei, H., Abbas, Q., Hafeez, M., Mohsin, M., Fatima, A., et al. (2019). Assessment of Wind Energy Potential for the Production of Renewable Hydrogen in Sindh Province of Pakistan. Processes 77 (4), 196. Page 196Apr. doi:10.3390/PR7040196
IRENA (2016). The Power to Change: Solar and Wind Cost Reduction Potential to 2025. Bonn: International Renewable Energy Agency.
Jha, A., and Saha, D. (2020). "Forecasting and Analysing the Characteristics of 3G and 4G mobile Broadband Diffusion in India: A Comparative Evaluation of Bass, Norton-Bass, Gompertz, and Logistic Growth Models". Technol. Forecast. Soc. Change 152, 119885. doi:10.1016/j.techfore.2019.119885
Khahro, S. F., Tabbassum, K., Soomro, A. M., Dong, L., and Liao, X. (2014). Evaluation of Wind Power Production Prospective and Weibull Parameter Estimation Methods for Babaurband, Sindh Pakistan. Energ. Convers. Manag. 78, 956–967. doi:10.1016/j.enconman.2013.06.062
Khalid Saeed, M., Salam, A., Rehman, A. U., and Abid Saeed, M. (2019). Comparison of Six Different Methods of Weibull Distribution for Wind Power Assessment: A Case Study for a Site in the Northern Region of Pakistan. Sustainable Energ. Tech. Assessments 36, 100541. doi:10.1016/j.seta.2019.100541
Khattak, M. A., Mukhtar, A., and Rafique, A. F. (2016). Akademia Baru Greener Energy: Evaluating Wind Energy Potential in Pakistan. J. Adv. Rev. Sci. Res. ISSN 23 (1), 2289
Li, L., Ye, F., Li, Y., and Chang, C.-T. (2019). How Will the Chinese Certified Emission Reduction Scheme Save Cost for the National Carbon Trading System? J. Environ. Manage. 244, 99–109. doi:10.1016/j.jenvman.2019.04.100
Lin, B., and Raza, M. Y. (2019). Analysis of Energy Related CO2 Emissions in Pakistan. J. Clean. Prod. 219, 981–993. doi:10.1016/j.jclepro.2019.02.112
Lund, P. (2006). Market Penetration Rates of New Energy Technologies, Energy Policy 34, 3317–3326. doi:10.1016/j.enpol.2005.07.002
Lund, P. (2006). Market Penetration Rates of New Energy Technologies. Energy Policy 34 (17), 3317–3326. doi:10.1016/j.enpol.2005.07.002
Melikoglu, M. (2013). Vision 2023: Forecasting Turkey's Natural Gas Demand between 2013 and 2030. Renew. Sustain. Energ. Rev. 22, 393–400. doi:10.1016/j.rser.2013.01.048
Mengal, A., Mirjat, N. H., Das Walasai, G., Khatri, S. A., Harijan, K., and Uqaili, M. A. (2019). Modeling of Future Electricity Generation and Emissions Assessment for Pakistan. Processes 7, 212. doi:10.3390/pr7040212
Mohsin, M., Zhang, J., Saidur, R., Sun, H., and Sait, S. M. (2019). Economic Assessment and Ranking of Wind Power Potential Using Fuzzy-TOPSIS Approach. Environ. Sci. Pollut. Res. 26 (22), 22494–22511. doi:10.1007/s11356-019-05564-6
Moré, J. J. (1978). “The Levenberg-Marquardt Algorithm: Implementation and Theory,” in Numerical Analysis (Springer), 105–116.
Nazari, M. A., Haj Assad, M. E., Haghighat, S., and Maleki, A. (2020). Applying TOPSIS Method for Wind Farm Site Selection in Iran. Adv. Sci. Eng. Technol. Int. Conf. ASET. Feb. 2020, 1–4. doi:10.1109/ASET48392.2020.9118223
Nepra-National Electric Power Regulatory Authority, (2018). State of Industry Report 2018. Islamabad: GOP-Government Of Pakistan.
Nrel Gis, (2020). RED-E. [Online]. Available: https://maps.nrel.gov/rede-pakistan/.
Purohit, P., and Michaelowa, A. (2007). CDM Potential of Wind Power Projects in India. Hamburg: HWWI Research Paper.
Purohit, P., and Michaelowa, A. (2007). Potential of Wind Power Projects under the Clean Development Mechanism in India. Carbon Balance Manage 2, 8. doi:10.1186/1750-0680-2-8
Raju, K., Madurai Elavarasan, R., and Mihet-Popa, L. (2020). An Assessment of Onshore and Offshore Wind Energy Potential in India Using Moth Flame Optimization. Energies 13, 1–41. doi:10.3390/en13123063
Saeed, M. A., Ahmed, Z., Hussain, S., and Zhang, W. (2021). Wind Resource Assessment and Economic Analysis for Wind Energy Development in Pakistan. Sustain. Energ. Tech. Assessments 44, 101068. doi:10.1016/J.SETA.2021.101068
Sajid, M. J. (2020). Inter-sectoral Carbon Ties and Final Demand in a High Climate Risk Country: The Case of Pakistan. J. Clean. Prod. 269, 122254. doi:10.1016/j.jclepro.2020.122254
Shaikh, F., and Ji, Q. (2016). Forecasting Natural Gas Demand in China: Logistic Modelling Analysis. Int. J. Electr. Power Energ. Syst. 77, 25–32. doi:10.1016/j.ijepes.2015.11.013
Shami, S. H., Ahmad, J., Zafar, R., Haris, M., and Bashir, S. (2016). Evaluating Wind Energy Potential in Pakistan's Three Provinces, with Proposal for Integration into National Power Grid. Renew. Sustain. Energ. Rev. 53, 408–421. doi:10.1016/j.rser.2015.08.052
Shoaib, M., Siddiqui, I., Rehman, S., Khan, S., and Alhems, L. M. (2019). Assessment of Wind Energy Potential Using Wind Energy Conversion System. J. Clean. Prod. 216, 346–360. doi:10.1016/j.jclepro.2019.01.128
Siemek, J., Nagy, S., and Rychlicki, S. (2003). Estimation of Natural-Gas Consumption in Poland Based on the Logistic-Curve Interpretation. Appl. Energ. doi:10.1016/S0306-2619(03)00013-8
Söderholm, P., and Klaassen, G. (2007). Wind Power in Europe: A Simultaneous Innovation-Diffusion Model. Environ. Resource Econ. 36, 163–190. doi:10.1007/s10640-006-9025-z
Teimourian, A., Bahrami, A., Teimourian, H., Vala, M., and Oraj Huseyniklioglu, A. (2020). Assessment of Wind Energy Potential in the southeastern Province of Iran. Energy Sourc. A: Recovery, Utilization, Environ. Effects 42, 329–343. doi:10.1080/15567036.2019.1587079
Umaid Ali, S., Khan, R., Khan, R., and Syed, A. M. (2017). Analysis of Wind Energy Potential and Optimum Wind Blade Design for Jamshoro Wind Corridor. Mehran Univ. Res. J. Eng. Technol. 36 (4), 781–788. doi:10.22581/MUET1982.1704.03
Wang, G. S., KaloiWang, M. H., Baloch, M., and Tahir, S. (2017). Wind Energy Potential at Badin and Pasni Costal Line of Pakistan. Ijred 6 (2), 103–110. doi:10.14710/ijred.6.2.103-110
Xu, J., Li, L., and Zheng, B. (2016). Wind Energy Generation Technological Paradigm Diffusion. Renew. Sustain. Energ. Rev. 59, 436–449. doi:10.1016/j.rser.2015.12.271
Xu, J., Li, L., and Zheng, B. (2016). Wind Energy Generation Technological Paradigm Diffusion. Renew. Sustain. Energ. Rev. 59, 436–449. doi:10.1016/J.RSER.2015.12.271
Yousuf, I., Ghumman, A. R., Hashmi, H. N., and Kamal, M. A. (2014). Carbon Emissions from Power Sector in Pakistan and Opportunities to Mitigate Those. Renew. Sustain. Energ. Rev. 34, 71–77. doi:10.1016/j.rser.2014.03.003
Zhang, C., Schmöcker, J.-D., Kuwahara, M., Nakamura, T., and Uno, N. (2020). A Diffusion Model for Estimating Adoption Patterns of a One-Way Carsharing System in its Initial Years. Transportation Res. A: Pol. Pract. 136, 135–150. doi:10.1016/j.tra.2020.03.027
Keywords: wind energy penetration, technical potential, Levenberg–Marquardt algorithm, certified emission reductions, Pakistan
Citation: Khatri SA, Harijan K, Uqaili MA, Shah SF, Mirjat NH and Kumar L (2022) A Logistic Modelling Analysis for Wind Energy Potential Assessment and Forecasting its Diffusion in Pakistan. Front. Energy Res. 10:860092. doi: 10.3389/fenrg.2022.860092
Received: 22 January 2022; Accepted: 18 March 2022;
Published: 05 May 2022.
Edited by:
Sorour Alotaibi, Kuwait University, KuwaitCopyright © 2022 Khatri, Harijan, Uqaili, Shah, Mirjat and Kumar. This is an open-access article distributed under the terms of the Creative Commons Attribution License (CC BY). The use, distribution or reproduction in other forums is permitted, provided the original author(s) and the copyright owner(s) are credited and that the original publication in this journal is cited, in accordance with accepted academic practice. No use, distribution or reproduction is permitted which does not comply with these terms.
*Correspondence: Khanji Harijan, a2hhbmppLmhhcmlqYW5AZmFjdWx0eS5tdWV0LmVkdS5waw==
Disclaimer: All claims expressed in this article are solely those of the authors and do not necessarily represent those of their affiliated organizations, or those of the publisher, the editors and the reviewers. Any product that may be evaluated in this article or claim that may be made by its manufacturer is not guaranteed or endorsed by the publisher.
Research integrity at Frontiers
Learn more about the work of our research integrity team to safeguard the quality of each article we publish.