 Yasmine Zakari
 François Vuille
 Michael Lehning
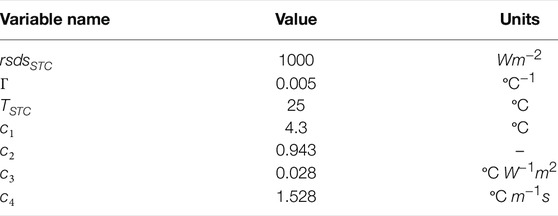

94% of researchers rate our articles as excellent or good
Learn more about the work of our research integrity team to safeguard the quality of each article we publish.
Find out more
ORIGINAL RESEARCH article
Front. Energy Res., 11 May 2022
Sec. Sustainable Energy Systems
Volume 10 - 2022 | https://doi.org/10.3389/fenrg.2022.859321
Solar and wind assets are climate-dependent and changes in climate will result in variations in their generation and intermittency. Developers of solar and wind parks in India have observed changes in climate conditions and variability in solar irradiation and wind profiles at the seasonal and year-to-year timescales. Future climate change perturbations, including monsoon shifts, could lead to lower-than-predicted wind and solar energy production and affect the economics of solar and wind assets. Regional climate models (RCMs) are the basis of climate impact assessments and the most trusted source of information to extract knowledge about future trends in climate variables. However, RCM projections are tainted with variability and uncertainty about the future trends. For India as a case study, we use the RCMs generated by the Coordinated Regional Climate Downscaling Experiment West Asia project (CORDEX WAS) to calculate individual wind, radiation, and temperature trends at selected sites; estimate wind and solar PV energy time series; and embed them in portfolio methods to test the impact of combining wind and solar assets on the variability of the total production and the uncertainty about the predicted production. We include a comparison of CORDEX RCMs with the ERA5 reanalysis dataset and conclude that all available RCMs reasonably simulate the main annual and seasonality features of wind speed, surface solar radiation, and temperature in India. The analysis demonstrates that the uncertainty about the portfolio return can be reduced by optimizing the combination of wind and solar assets in a producer portfolio, thus mitigating the economic impact of climate change. We find that the reduction obtained with a mixed portfolio ranges from 33 to 50% compared to a wind only portfolio, and from 30 to 96% compared to a solar only portfolio.
India is favored with abundance of wind and sunlight availability across most of its geography with wind-rich regions in the south and west (Sherman et al., 2021) and promising locations for solar energy in the south (Kumar, 2021), but even more so—largely untapped—in the mountains (Dujardin et al., 2021). Wind and solar energy offer benefits in mitigating greenhouse gas emissions and increasing energy security. Frequent and severe heatwaves, heavy rainfall events, and rising sea levels are among the foreseeable natural disasters mainly due to climate that India is already witnessing today (Krishnan et al., 2020). Global climate models (GCMs) within the Coupled Model Intercomparison Project phase 5 (CMIP5) and CMIP6 (latest simulations) predict an increase inmonsoon precipitation and variability in the future with climate change (Katzenberger et al., 2021; Mitra, 2021). In order to avoid these dramatic consequences predicted by climate models, the Government of India has publicized striving plans for renewable energy deployment to decarbonize its energy production (Sharma et al., 2012; Kapoor et al., 2014; Hairat and Ghosh, 2017; Mohanty et al., 2017; Rathore et al., 2018; Sharma, 2019). The aggressive renewable energy policies of India combined with its huge renewable resource potential favor fast growth in wind and solar power generation throughout the country. India aims at reaching a target of 450 gigawatts of renewable capacity by 2030 (International Energy Agency, 2021), which represents many opportunities for investors as wind and solar energies are expected to cover a substantial portion of India’s future demand for electricity (Lu et al., 2020). The decarbonization of the power sector in India faces numerous risks adding to the complexity of facing the threat of climate change. The assessment by Kumar et al. (2022) of recent wind policy development in India highlights that the slowing growth in wind energy development observed since the beginning of the global pandemic can hinder its renewable energy ambitions.
In addition to their intrinsic variability and seasonal disparity, wind and solar energy are also sensitive to climate. The variability of monsoon under future climate conditions is a crucial factor likely to impact wind energy production (Turner and Annamalai, 2012; Sherman et al., 2021). Pryor and Barthelmie (2011) and Solaun and Cerdá (2019) provide an exhaustive overview of climate change impacts on wind energy production. Gernaat et al. (2021) identify a decrease in wind energy at the global scale under the influence of future global warming. These studies conclude that climate change affects wind production via changes in daily and seasonal distribution of wind speed and temperature. These changes may be caused by large-scale circulation and seasonal patterns such as El Nino Southern Oscillation or local land-use changes, including urbanization and deforestation (Wu et al., 2018). India has experienced a depression in monsoon circulation and a delay in monsoon onset because of the Indian Ocean warming as a result of increased greenhouse gases and changes to the regional aerosol emissions (Roxy and Chaithra, 2018; Wang et al., 2021). During the last decades of the twentieth century, wind resources in India were affected by the stilling effect, a decrease in wind speeds, also reported at the global level (Zeng et al., 2018). This stilling, or reduction in wind power potential, is attributed to an increase in temperatures in the Indian Ocean (Gao et al., 2018). Sabeerali and Ajayamohan (2017) warn about the possibility of a shortening of the monsoon season in the future. This shortening could hinder wind energy production in the regions where most of the production relies on monsoonal winds. Hence, it is beneficial to examine the effects of changing climatic conditions on the current and future wind sites.
Climate change impacts the quantity of solar radiation reaching the surface of the planet driven by the change of radiation as a result of changes in the snow cover and cloudiness (IPCC, 2007). The factors that impact solar photovoltaic (PV) production and can be aggravated by climate change are surface temperatures, solar irradiation, wind speed, and changing concentrations of dirt, dust, snow, and atmospheric particles (Patt et al., 2013; Wild et al., 2015). Monsoon anomalies can provoke extreme weather events (Zhisheng et al., 2015) and are also likely to impact PV power output (Feron et al., 2021). Solar radiation has not remained constant over the past decades in India (Soni et al., 2012). Singh and Kumar (2016) describe the occurrence of the solar dimming phenomenon, which is the systematic reduction of solar radiation reaching the ground in the cities of Jodhpur, New Delhi, Nagpur, and Kolkata up to 2003, while solar brightening (increase of solar radiation reaching the ground) was observed in some other regions since 1990 driven by the efforts to reduce pollution. Project developers need to be wary of such phenomena even though reductions in the amount of solar radiation received do not necessarily imply decreases in solar energy production because the latter depends mostly on changing temperatures (Peters and Buonassisi, 2019).
The scientific community quantifies climate change impacts on wind and solar power generation in various regions. Solaun and Cerdá (2019) review most relevant studies that present quantitative results. As an example, regional assessments in Asia indicate that wind energy density throughout the twenty-first century is projected to decline in Taiwan, and slight wind variations are expected in China (Weber et al., 2018). Sherman et al. (2021) use East Asia CORDEX simulations to study changes in wind resource availability in India and China to assess projected changes under climate change scenarios and find an overall decline of two percent in the annual generation potential of India up to the year 2060. Sherman et al. (2021) do not include the projections for solar potential, which is another renewable energy source subject to regional climate changes and key to successful energy transition. In our previous study (SETA-D-21-03116), we demonstrate that wind projections from climate models indicate an increase in some parts of India, triggering more enthusiasm for wind development in the northwest of the country. Solar PV output is estimated to decrease in large parts of the world due to global warming and decreasing all-sky radiation over the coming decades. Positive trends in solar PV are expected in regions where the cloud cover decreases substantially or clear-sky radiation increases (Schlott et al., 2018).
RCMs are the most modern tool for projecting climate conditions in specific areas (Stefanidis et al., 2020). Estimates of future changes in the climate are expressed in terms of mean changes (Evin et al., 2021) or predictions of future trends in wind speeds, temperature, and radiation. These estimates can also be converted to impacts such as changes in energy production. Despite the engagement of the climate modeling community for RCM improvements (Randall and Taylor, 2007), the uncertainty of the trends predicted by climate models can be high. In our previous work (SETA-D-21-03116), we studied trends in wind alone for CORDEX WAS-22 projections in India under climate change scenarios and found that some of the trends were highly uncertain. The availability of a large number of climate projections enables to produce multimodel ensembles (MMEs) that can be exploited to assess mean changes in climate over different time periods and related uncertainties. The IPCC (2013) indicates that projections are considered to be robust when the magnitude of change is smaller than the associated uncertainty. Uncertainty assessments in regional climate projections range from methods based on simple agreement heuristics to characterize positive or negative trends in a climate variable from different RCMs and quantitative uncertainty estimates based on the median and intermodel range of a variable across a series of model projections to attaching probabilities to a group of scenarios on a regional scale (Intergovernmental Panel on Climate Change, 2014).
The sources of uncertainty in climate projections are scenario uncertainty, model diversity, and inherent natural variability. Their quantification in ensembles of climate projections supports the understanding of where targeting efforts reduce them (Evin et al., 2019). The methods to characterize the different sources of uncertainty associated with the projections of climate variables include advanced Bayesian analysis of variance (ANOVA) (Bichet et al., 2020) and QUALYPSO (Evin et al., 2021), which is another statistical approach to calculate the total uncertainty of projections. These methods are computationally expensive and time-consuming procedures. Therefore, although the partitioning of uncertainty sources increases the understanding of the future role of climate change in India, its study is beyond the scope of this article and will be the focus of our future research.
The perceived inaccuracy of climate models has so far limited their consideration in strategic planning. That being said, it suggests that to encourage their adoption, risk-averse decision-makers could benefit from planning tools that reduce uncertainty (Ando et al., 2018). Portfolio theory is one of these tools and diversifies investments between multiple assets (things in which one could invest) to reduce uncertainty in total future returns with minimized loss in the expected value of returns (Ando et al., 2018). Tantet et al. (2019) use mean–variance analysis in Italy to show the benefits of spatial diversification. Spatial diversification means that the variability may be partly mitigated by aggregating the production from different sources and sites at different places. Hu et al. (2019) used the same framework to optimize the geographical location of wind and solar portfolios in China and reduce the variability which limits the use of storage in the system. In this study, we suggest the adaptation of portfolio theory to use it as a tool to reduce the uncertainty of climate predictions when the impacts are converted to energy estimates. Solar and wind resources are often negatively correlated in space and time (Hu et al., 2019; Tantet et al., 2019). Combining the energy production from wind and solar sources reduces the variability in the power supply due to the balance between meteorological variables. Dujardin et al. (2021) demonstrate that skillfully complementing and coordinating renewable energies over large regions in Switzerland can smoothen intermittencies by reducing correlations among generators and consumers. It shows that optimizing the spatiotemporal variability of wind, solar, and hydropower energy reduces storage needs and fits the local demand. The southwestern monsoon and the annual solar cycle drive the variability in wind and solar energy in India. Peak wind resources occur during the monsoon season, precisely when the cloud cover affects solar PV production. Solar energy, on the other hand, peaks during the summer precisely when wind energy is at its lowest (Lolla et al., 2015). Hence, India can be a hub of green energy supply if it exploits geographical advantages in energy supply sources (Pachar et al., 2021). Climate change makes the Indian monsoon season more chaotic and impacts its predictability, which could be dramatic for resource planning and energy production scheduling (K and T, 2018; Jin et al., 2021). However, should the monsoon become stronger or weaker in the future and should its patterns shift, exploiting the correlation between wind and solar energy could serve to reduce the uncertainty on their respective future trends, given that the combined perspective has a lower error that the individual ones. Can we use the anti-correlation of solar and wind resources to reduce uncertainty in the estimation of future yield if the combined generation of solar and wind power is considered?
In order to answer this research question, we divide the analysis into two parts. In the first part, we analyze CORDEX simulations to understand future trends of the climate variables influencing solar and wind production under climate change scenario RCP 8.5. Then, we select regions where future wind and solar farms could be installed and use portfolio methods to exploit the negative correlation between wind and solar energy and assess its impact reducing the uncertainty climate simulation trends.
In this study, we used CORDEX WAS-22 regional downscaled experiments for all Coupled Model Inter-comparison Panel 5 (CMIP5) models available on the Earth System Grid Federation (ESGF). We focused on three climate variables from CORDEX, namely, near-surface wind speeds (sfcWind) at 10 m height, surface temperature (tas), and downward surface radiation (rsds) at the monthly resolution, and 0.22° (about 22 km) horizontal spacing. We defined the study area in India as 6.70°N to 35.5°N and 68.1°W to 97.3°W. CORDEX simulations are available for a historical period (1979–2005) and future projections starting from 2006 to the end of the century with representative concentration pathway (RCP) scenarios RCP 2.6, the lower emission scenario for CMIP5, and RCP 8.5, the scenario assuming a continued increase in greenhouse gases throughout the end of the century (Riahi et al., 2011). Three RCM families are available for CORDEX WAS-22: 1) the Abdus Salam International Center for Theoretical Physics (ICTP) RegCM system (ICTP-RegCM4-7 (Giorgi et al., 2012), noted RegCM4 hereafter); 2) COSMO-crCLIM-v1-1.v1 (COSMO (Sorland et al., 2021)); and 3) REMO2015.v1 (REMO (Jacob et al., 2012)). Table 1 summarizes RCM names, with their driving GCM parent, scenarios available, and acronyms of CORDEX simulations.
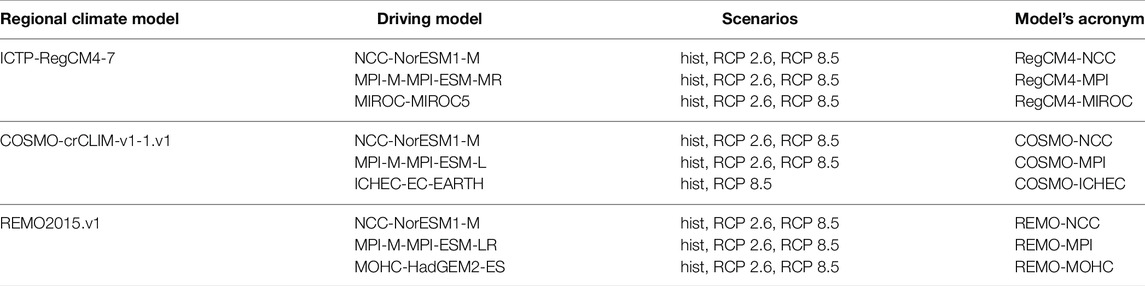
TABLE 1. Summary of the models used in this study.
As a necessary prerequisite for this work, we evaluate monthly CORDEX WAS-22 simulations for the three climate variables over the period 1981–2005 with comparison to the ERA5 reanalysis dataset (Sabater, 2019). We examine how well they reproduce the spatial distribution of annual and seasonal means during specified time periods (denoted climatology) and trends at each grid point and the spatial averages.
We analyze the temporal patterns of wind speed at three existing wind sites and radiation and temperature at four solar sites for ERA5 and the individual CORDEX WAS-22 models. Table 2 outlines the name, location, and total capacity in megawatt (MW) of the sites considered in this study. They are selected because they all belong to the CLP Group and are used as a benchmark of a real-life portfolio whose structure will be the model of the portfolios simulated later on in India. On the selected sites, we evaluate the standardized monthly anomalies derived during a 25-year period extending from 1981 to the end of 2005 to examine the seasonal variations.
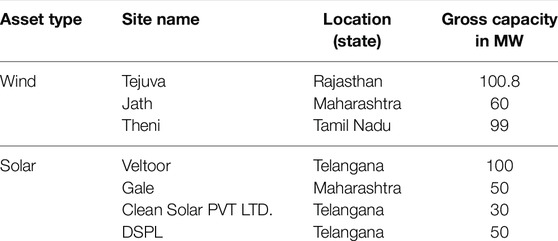
TABLE 2. Summary of the characteristics for the CLP sites used in this study.
One way to use RCM projections is to assess the magnitude and degree of consistency in the simulations in terms of changes in 1) climate variables or 2) impacts when the wind speed or solar radiation and temperature are converted to energy estimates (Intergovernmental Panel on Climate Change, 2014). These changes can be expressed in linear trends of annual, seasonal, or monthly mean quantities between certain time periods. For the evaluation of future changes, we analyze annual and seasonal climatology and trends in surface wind speeds, temperature, and radiation from CORDEX WAS-22 models in the Indian subcontinent for RCP 2.6 and RCP 8.5 scenarios during two subperiods; from 2025 to 2055 and from 2065 to 2095. We focus the discussion in the main text on simulations with RCP 8.5 to identify the largest bounds of changes in wind, radiation, and temperatures in the models. The length of the two subperiods simulates the economic lifetime of wind and solar assets. When the seasonality is considered, we refer to winter as the months from December to February, pre-monsoon as the months from March to May, monsoon as the months from June to September (noted JJAS), and the post-monsoon (months of October and November) seasons. We use linear regression and the Theil–Sen (Theil, 1950; Sen, 1968) nonparametric method to analyze trend magnitudes, which are tested for statistical significance using the Mann–Kendall test (Mann, 1945; Kendall, 1948). To illustrate the spread of model projections, we take the most extreme and the median trend values of all considered models at every grid point. Thus, we evaluate the smallest trends; strongest negative or smallest positive trends, the largest trends; strongest positive or smallest negative trends, and the median trends. After analyzing the whole study domain, we divide it into five subregions described in Figure 1 to summarize the regional trends. This step is motivated by the need to identify regions where wind and solar monsoon trends are anti-correlated as this is a binding condition in our work. Once these regions are identified, we focus on two of them for this analysis. In each region, we select three locations for wind assets and four others for solar assets. For the application of portfolio methods, we produce energy time series for wind and solar PV at selected locations according to the method discussed in Section 2.4.
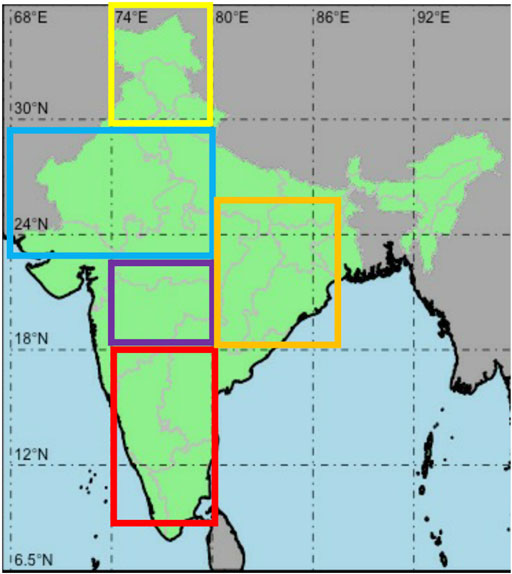
FIGURE 1. Map of the study area and illustration of the subdomains represented by boxes: North (yellow), northwest (blue), central west (purple), East (orange), and South (orange) that are utilized for analysis.
After identifying the regions where wind and solar are anti-correlated during the monsoon season, we pick the locations for the wind and solar sites. Hereafter, we lay out the method used to estimate the returns of the wind and solar PV assets, which then serve as an input in the portfolio analysis explained in Section 2.5. We determine the energy production for each wind and solar asset using CORDEX data and express this return in the form of capacity factors and PV potential as actual production estimates depend on local weather and installations. For wind assets, the capacity factor CFwind is defined as the fraction of the potential production of wind power at the wind site and the maximum possible energy (P rated, times the amount of time energy was produced, t):
At the three wind farm locations considered, we assume 30 Suzlon 111 wind turbines installed at a hub height of 90 m, with a turbine diameter equal to 111.9 m and a rated power of 2.1 MW. To project surface wind speed to hub height, we extrapolate wind speed data v1 at 10 m height to the 90 m hub height using the power law (Archer and Jacobson, 2005) to obtain v2:
where the friction coefficient α is equal to
For solar sites, in order to make a first-order estimate and translate solar radiation and temperature into potential changes in PV generation, we use the methods presented by Jerez et al. (2015) and Crook et al. (2011) to calculate PVpot, which is defined as the fraction of the power output under standard conditions that a PV module may have according to Eq. 3:
PVpot is unit-less, rsds is the surface downward radiation at each time from ERA5, rsdsSTC is radiation under standard conditions which is equal to 1000Wm−2, and PR is the performance ratio calculated from Eq. 4:
where TSTC is equal to 25°C, γ = 0.005°C−1 assuming the behavior of monocrystalline silicon solar panels, and Tcell is the temperature of the PV cell calculated with Eq. 5:
sfcWind is surface wind speed, c1, c2, c3 and c4 values are listed in Table 3, along with the other variables and constants and their units.
See Supplementary Figure S1 for an illustration of PV potential (PVpot) and on-shore wind capacity factors (CFwind) in the Indian sub-continent from ERA5 data and the period extending from 1981 to 2006. In Section 2.5, we show how CFwind and PVpot estimated from CORDEX data are used in the portfolio analysis framework to investigate the impact of combining wind and solar assets on the uncertainty of portfolio returns.
Portfolio analysis supports the decision-making subject to the tradeoff between the expected return and the volatility of this return. The framework enables the assignment of weights to assets included in a portfolio such that the total return is maximized and the volatility of this return is minimized. Decision makers can evaluate the performance of each optimal portfolio formed by a combination of assets. The optimal solutions of the trade-off in the portfolio analysis are graphically represented on an efficient frontier, which is a plot of optimal returns and their volatility. In the following section, we explain how it is adapted to calculate the uncertainty on returns calculated from climate models. First of all, we use a set of wind and solar sites as an input to the bi-objective function. We consider that these candidates are part of a portfolio whose structure mimics the existing portfolio discussed earlier, with three wind farms and four solar PV assets. The sites selected sit on locations where wind and radiation trends are anti-correlated during the monsoon season. We solve the bi-optimization problem three times for each set of locations in a way that we have 1) only wind sites, 2) only solar sites, and 3) wind and solar sites combined as an input. By doing so, we can compare the efficient frontiers obtained from the standalone perspective with wind-only or solar-only portfolios and the mixed portfolios. The examination of the three efficient frontiers obtained enables us to highlight the effects of the combination of wind and solar energy in the portfolio and its impact on the volatility of the return, as opposed to the nonmixed portfolios. The analysis is repeated for each individual RCM model for a certain RCP scenario. Finally, by doing so, we can measure the spread between the curves of the efficient frontiers for each one of the portfolio types and examine how the combination of asset types affects this spread.
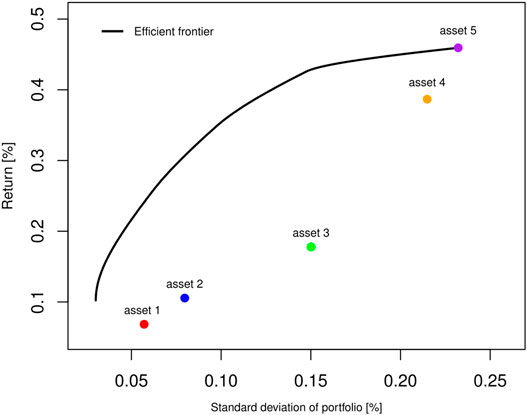
FIGURE 2. Illustration of efficient frontiers of five assets.
Formally, the mean–variance analysis consists of a bi-optimization problem Eqs 6, 7, where μk is the average production of wind or solar power in each location k, and the mean portfolio return μp (approximated by its total capacity factor) is maximized while its variance
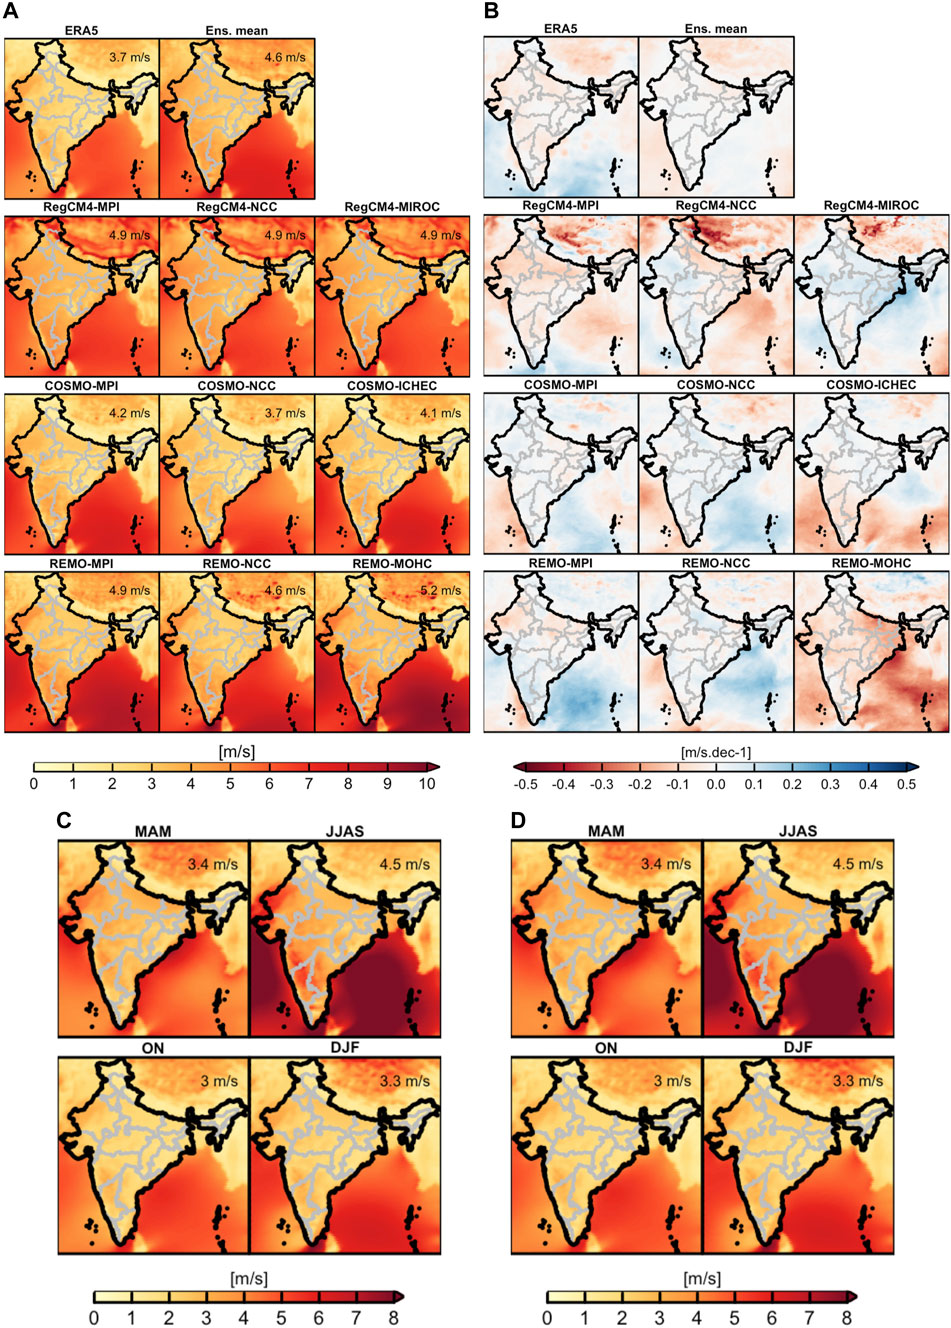
FIGURE 3. Surface wind speeds: comparison of the annual climatology (A) and trends (B) of ERA5 and CORDEX WAS-22 (first row) and seasonal climatology (C, D) in the two data sources (second row).
Hence, we calculate the average production at each location k, namely, the mean μwind that is approximated by CFwind in the case of wind sites and by PVpot in the case of solar sites. In Eqs 6, 7, wk is the weight of each asset in the portfolio. For the minimization of the portfolio variance
We simulate returns for five assets to illustrate the concept of the efficient frontier in Figure 2. The five points represent the mean return and standard deviation for each one of the five individual assets. The resolution of the bi-optimization problem described in Eqs. 6, 7 enable finding the combination of assets where returns are maximized for a given level of volatility or minimized volatility for a given level of return. The set of these optimal solutions constitutes the efficient frontier. On this graph, the higher a point is to the left the better an asset is because the expected return is higher and the related volatility is lower.
The results of the comparison between CORDEX WAS-22 models and ERA5 are presented in Figure 3 for sfcWind, Figure 4 for tas, and Figure 5 for rsds.
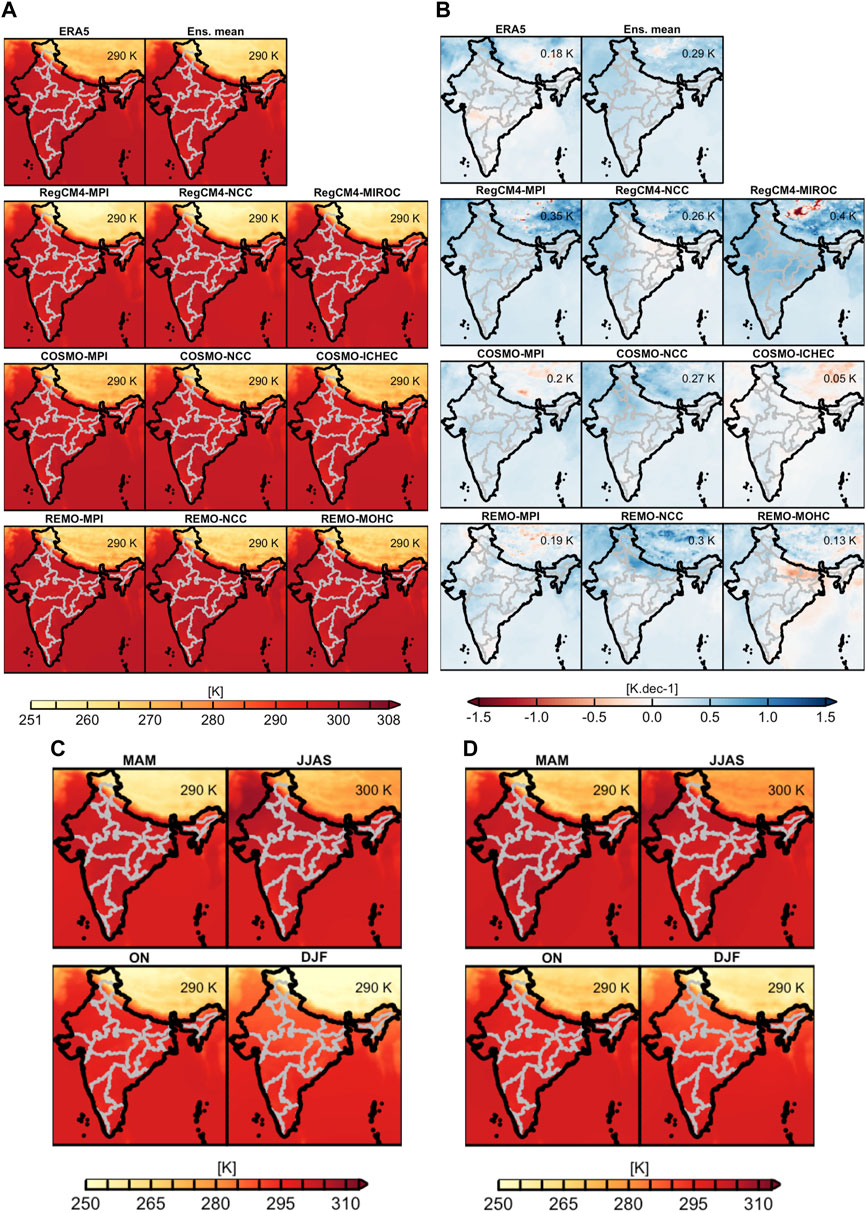
FIGURE 4. Surface temperature: comparison of the annual climatology (A) and trends (B) of ERA5 and CORDEX WAS-22 (first row) and seasonal climatology (C, D) in the two data sources (second row).
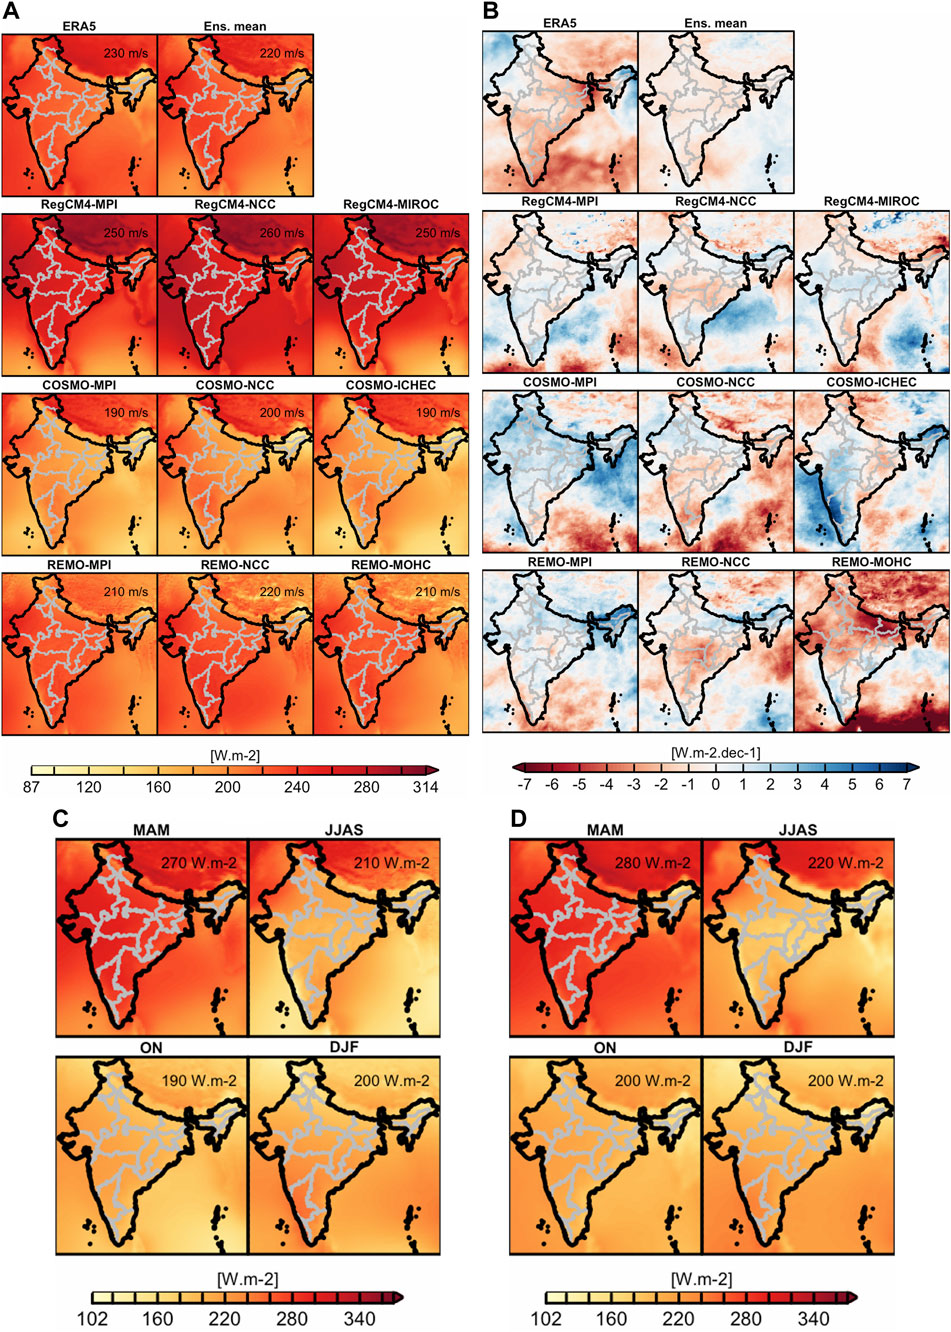
FIGURE 5. Surface shortwave downward radiation: comparison of the annual climatology (A) and trends (B) of ERA5 and CORDEX WAS-22 (first row) and seasonal climatology (C) and (D) in the two data sources (second row).
Regarding the annual climatology of wind speeds, the results in Figure 3A demonstrate that the geographical pattern of CORDEX WAS-22 models resembles the one found for ERA5, although differences exist in the south of Tibet. For the annual trends of surface winds, the comparison in Figure 3B shows that not all individual climate models reproduce the pattern of ERA5. In general, we find that the ensemble mean for wind speed, noted sfcWindhist (first row and second column in Figure 3C satisfactorily captures wind speed annual trends, and shows similarities in the pattern of the monsoonal trend (Figure 3D). This result is in general a key finding because it increases confidence in the ability of CORDEX models in reproducing the monsoon pattern, which is a majorly impacting climatological feature on wind energy in India.
We include a similar assessment for temperature and solar radiation as they are used to estimate solar energy time series. We find a strong resemblance in the spatial pattern of annual temperature climatology between ERA5 and CORDEX WAS-22 individual models displayed in Figure 4A. Discrepancies in the annual climatology for temperature are found in mountainous areas toward the Himalayas in northern India because the resolution of climate models cannot capture the complexity of local spatial variability. There is also a good agreement in the annual temperature trends (Figure 4B), and all datasets exhibit trends with a positive slope. According to the results for wind speeds, we find large similarities in the seasonal temperature climatology between ERA5 (Figure 4C) and the historical ensemble (Figure 4D).
We see in Figure 5A that differences exist in the spatial pattern of the annual climatology for radiation, while ERA5 data and the ensemble mean outline a good agreement with only a slight difference in the spatial average (230 Wm−2 for ERA5 and 220 Wm−2 for the ensemble mean). We notice a high variability between ERA5 and the individual models for the annual radiation trends in Figure 5B. Similar to the annual pattern, we find a significant similarity in the seasonal climatology for radiation between ERA5 (Figure 5C) and the historical ensemble (Figure 5D).
In summary, we conclude that CORDEX WAS-22 models for the three climate variables reproduce ERA5 data with a reasonable degree of fidelity, and the resemblance in the spatial distribution is stronger at the annual level than at the seasonal level. Section 3.3 includes an evaluation of the temporal variability at existing wind and solar sites.
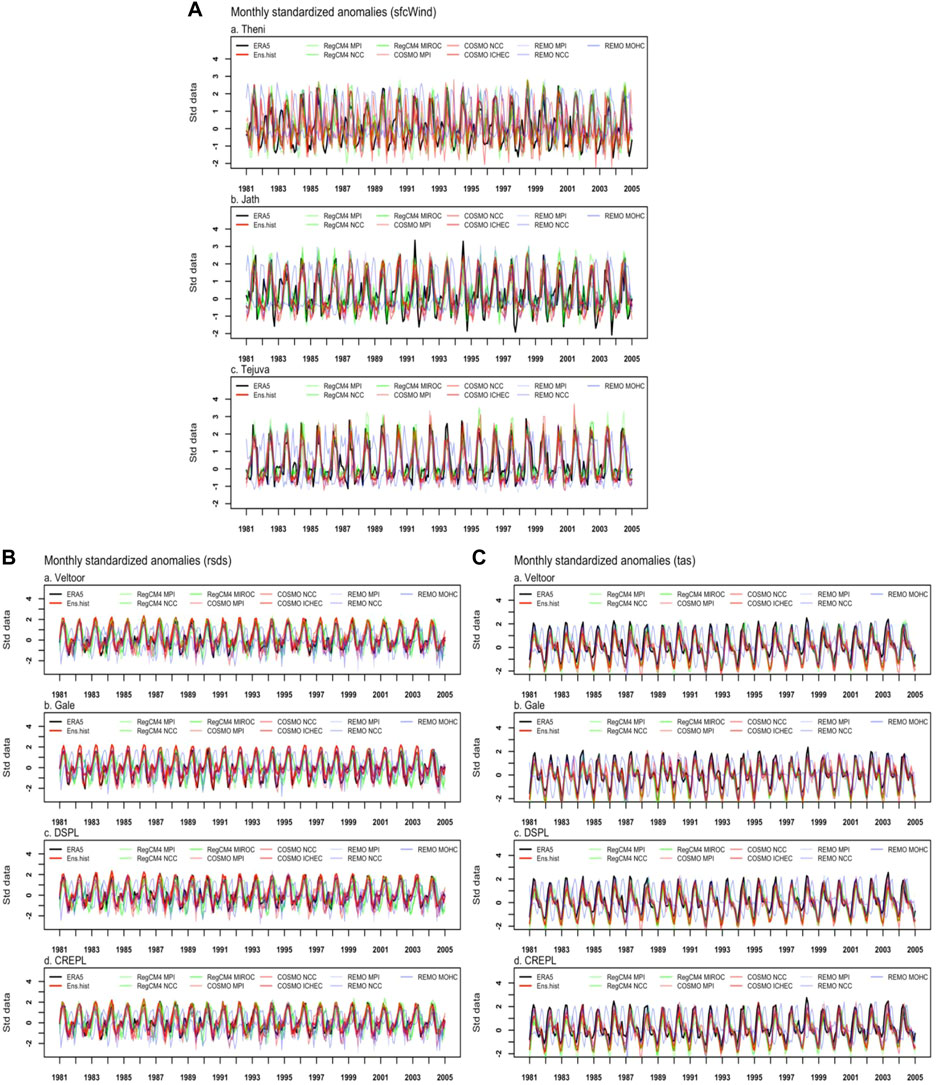
FIGURE 6. Monthly standardized anomalies for wind speeds (A), surface downward radiation (B), and surface temperature (C) extracted from ERA5 and CORDEX WAS-22 in the Indian subcontinent for the period between 1981 and the end of 2005.
Figure 6A outlines the temporal variability of standardized wind speed at three existing wind-farm sites and compares CORDEX models with ERA5 (black line). In the three sites, the peak in wind speeds reflected by ERA5 coincides with the monsoon season. However, REMO models represented in purple shades outline a peak delayed and occurring later during the year. The delay in the monsoon peak for wind speeds from REMO models is apparent while looking at the plots of the seasonality component. COSMO and RegCM4 models show good correspondence in the seasonal component of the individual models with ERA5. We see that there are differences in the individual models and that in some instances, the individual models are not able to reproduce the peak in wind speed during monsoon.
At the four solar sites, we observe that the peak in radiation (Figure 6B) reported by ERA5 (black line) occurs between March and May. The time of occurrence of the peak for RegCM4 and COSMO models coincides well with that of ERA5. REMO models (lines in the purple shade) fail to reproduce that as the peak of these purple lines occurs later around the monsoon season. This delay in peak radiation for REMO models also appears when we analyze the seasonality component for radiation. In Veltoor, the correspondence in the trends between ERA5 and RegCM4 models is the highest which could indicate that not all available models are equally suitable for a particular location. The differences between the RCMs can be partially explained by the fact that COSMO, for example, has difficulties over domains with a climate substantially different from that of Europe where it has been developed (Sørland et al., 2021). On the other hand, IITM-RegCM4 over South Asia was developed at an Indian institute.
For temperature (Figure 6C), the peak that occurs in June or July according to ERA5 data is accurately reported by RegCM4 models (green) and COSMO ones, while REMO models persistently show delay with a peak occurring only after the monsoon season and toward the end of the year.
The evaluation of the temporal variability between the individual models in wind and solar locations highlights one of the problems when evaluating climate change; these differences between the ERA5 data and CORDEX models can be attributed to differences in the parametrization of the models and shows that uncertainty of climate predictions may still be large. Now that we highlighted some differences in the models, we study the trends for future projections before testing how the combination of wind and solar energy can reduce the variability in the trends.
In this section, we describe the geographical distribution of long-term annual and seasonal climatology and trends for surface wind speed, temperature, and radiation in India under the RCP 8.5 scenario. The results for the annual climatology for the three climate variables are presented in Figure 7.
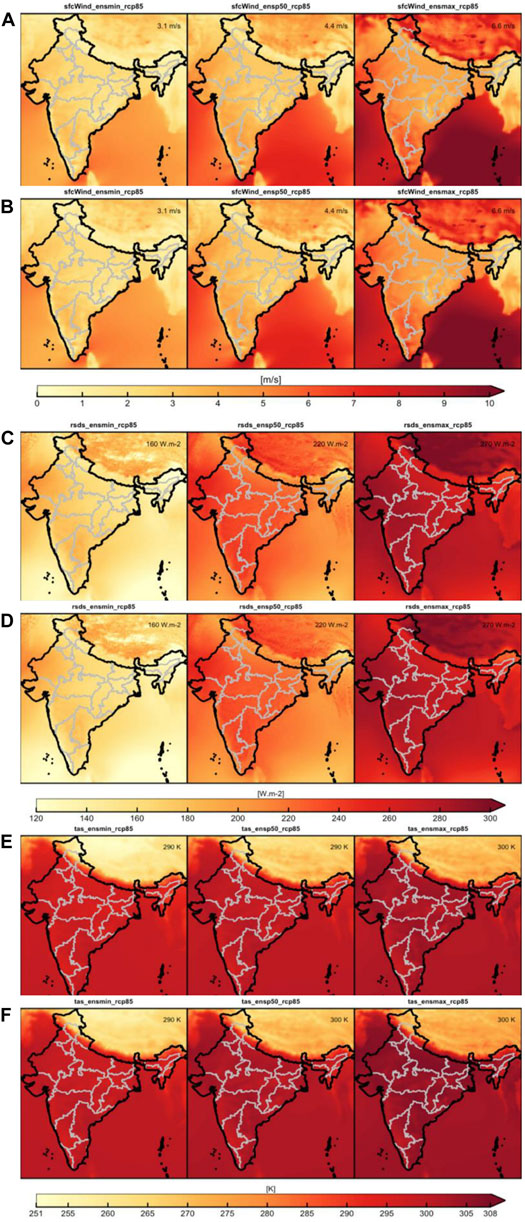
FIGURE 7. Distribution of the annual climatology under the RCP 8.5 scenario: annual climatology for wind speed for the period between 2025 and 2055 (A) and 2065 and 2095 (B), radiation between 2025 and 2055 (C) and 2065 and 2095 (D), and temperature between 2025 and 2055 (E) and 2065 and 2095 (F), (first row in each panel) and between 2065 and 2095 (second row of each panel).
The evaluation of the climatology between the two periods (2025–2055) and (2065–2095) in Figures 7A,B shows that the median value of the annual wind speed increases by 2.6%. Looking at the seasonal climatology for surface wind in Figure 8, we observe that the minimum seasonal values shown in Figure 8A increase for monsoon and winter winds during the first time period, while pre-monsoon and maximum monsoon wind speeds increased in the later part of the century in Figure 8F. Regarding the seasonal trends during the first period (Figures 8G, H, I), we find a positive wind speed trend during the pre-monsoon in the northwest and some southern areas during the monsoon and winter seasons. We also find some increase in the northeast for winter wind speeds from the maximum ensemble. During the second period extending from 2065 to 2095 (Figures 8J, K, L ), we find a positive trend in the northwest and southeastern coast for pre-monsoon wind speeds. We can also report on some positive trends for monsoon wind speeds in areas located in the northwest and northeast. Looking at the maximum ensemble, we find a positive trend in the north and northeast, indicating an increase in extreme wind speeds.
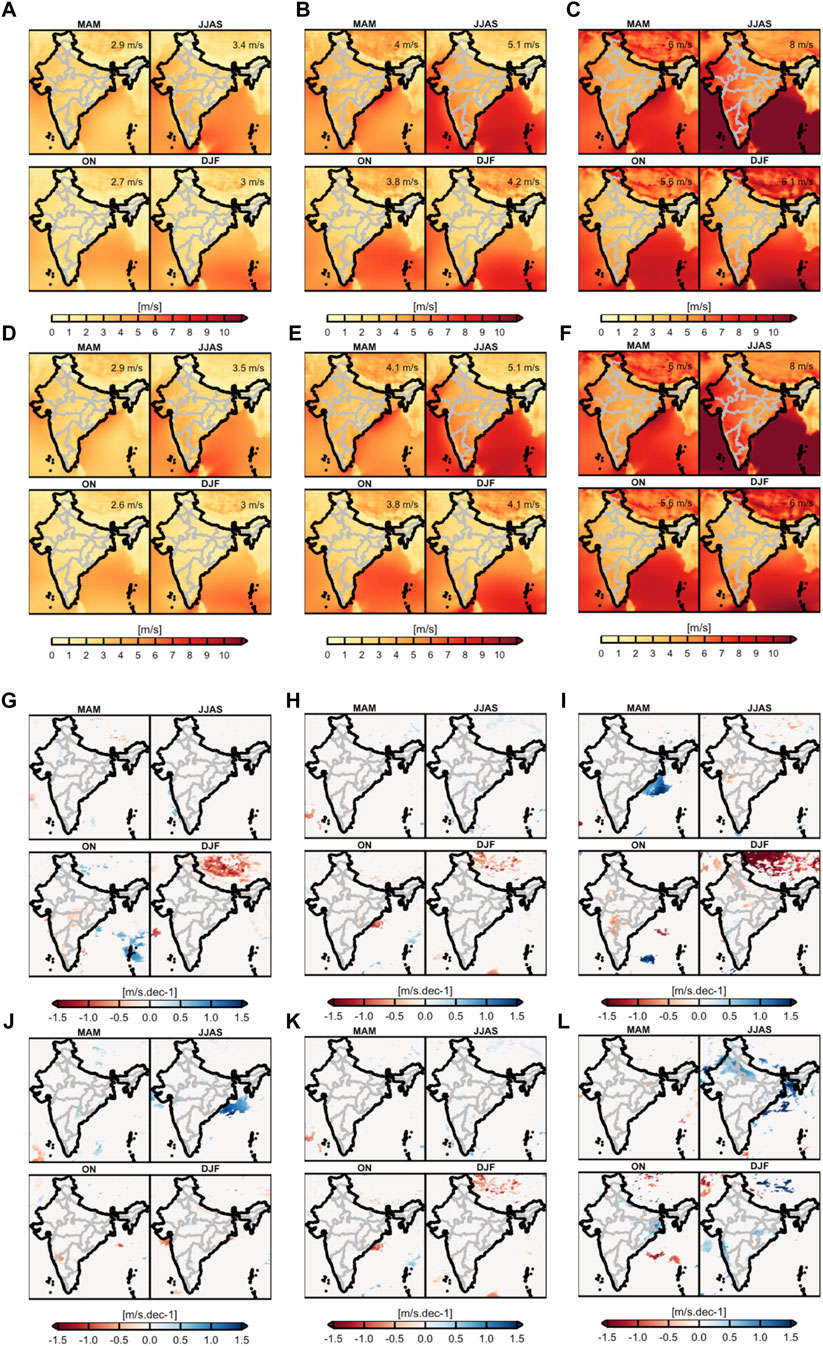
FIGURE 8. Surface wind speed RCP 8.5 scenario: smallest (A), median (B), and largest (C) ensemble seasonal climatology for the period between 2025 and 2055, and analogously (D–F) for the period between 2065 and 2095. (G–I) are the smallest, median, and largest ensembles during the 2025-2055 period, respectively, and (J–L) are the smallest, median, and largest ensembles from 2065 to 2095. White areas indicate that at these grid points, trends are statistically nonsignificant at the level 0.05.
The spatial distribution of the annual climatology for the downward surface radiation is presented in Figure 9. The highest values are found in the north of India toward the Himalayas and in the northwestern and southwestern parts of India. The annual and seasonal mean climatology remains the same between the first and second periods. Looking at the median ensemble for the first period (Figures 9A–C), we see no significant change in the pre/post-monsoon climatology. During the monsoon season (Figures 9G–I), the northwest and northeast regions near the coast have significant negative trends. During the second period, the results show a positive trend in the north of India during the monsoon that would involve an increase in PV output in the region (Figures 9J–L).
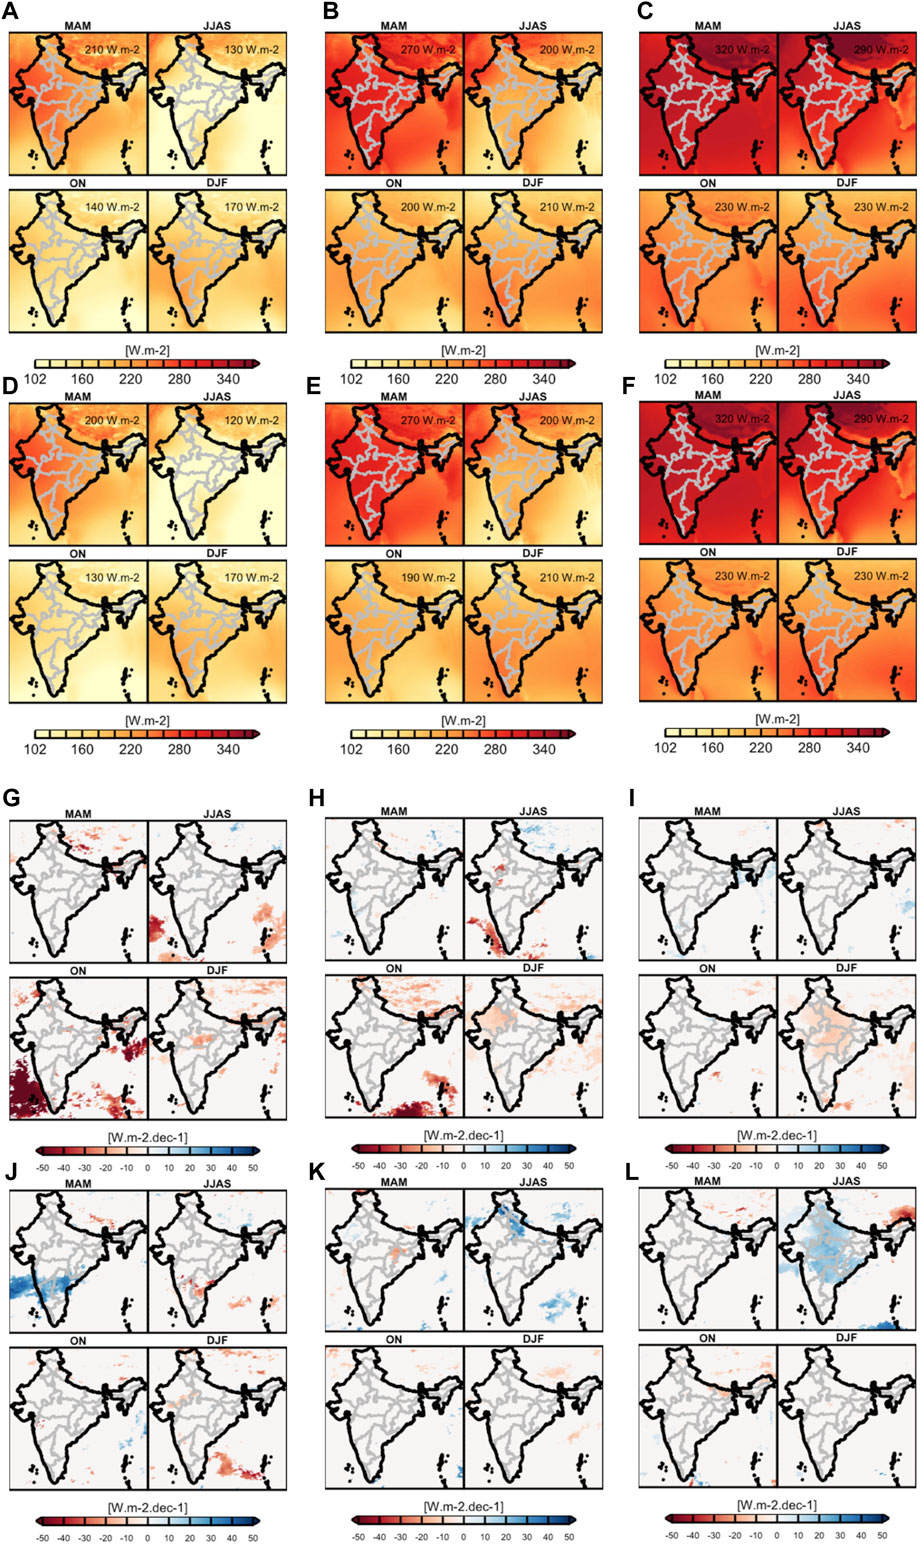
FIGURE 9. Surface downward shortwave radiation RCP 8.5 scenario: smallest (A), median (B), and largest (C) ensemble seasonal climatology for the period between 2025 and 2055, and analogously (D–F) for the period between 2065 and 2095. (G–I) are the smallest, median, and largest ensembles during the 2025-2055 period, respectively, and (J–L) are the smallest, median, and largest ensembles from 2065 to 2095, respectively. White areas indicate that at these grid points, trends are statistically nonsignificant at the level 0.05.
For temperature, we find a higher climatology and positive trend toward the end of the century and extreme temperatures increasing during the monsoon in the whole of India except the South. Assuming that there will be no changes in future solar radiation, these trends would imply decreasing power output for solar PV as solar panel decrease in efficiency with increasing temperatures (Dubey et al., 2013).
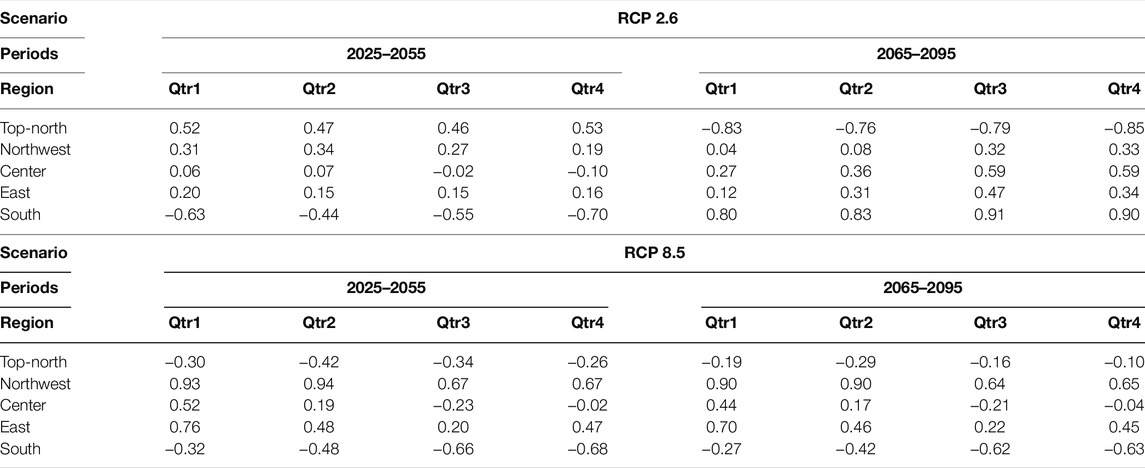
TABLE 4. Spatially averaged seasonal correlation coefficients between rsds and sfcWind for the five subdomains analyzed for the two RCP scenarios and time periods defined in each quarter of the year (noted Qtr).
Prior to the portfolio analysis, we investigate the seasonal correlation between surface downward radiation and wind speed in the subregions defined earlier in Table 4. This table shows that the two regions where the anti-correlation in wind and radiation is strongly distinguishable and consistent for the two RCP scenarios are the South from 2025 to 2055 and the North from 2065 to 2095. Hence, we select two sets of wind and solar assets in these two regions as candidates for the application of the portfolio analysis.
We apply the portfolio framework in two sets of wind and solar assets in the South and the North where the two solar radiation and wind speed variables are anti-correlated. The characteristics of the two sets are summarized in Table 5. We analyze how the combination of wind and solar energy impacts the uncertainty of prediction on energy returns.
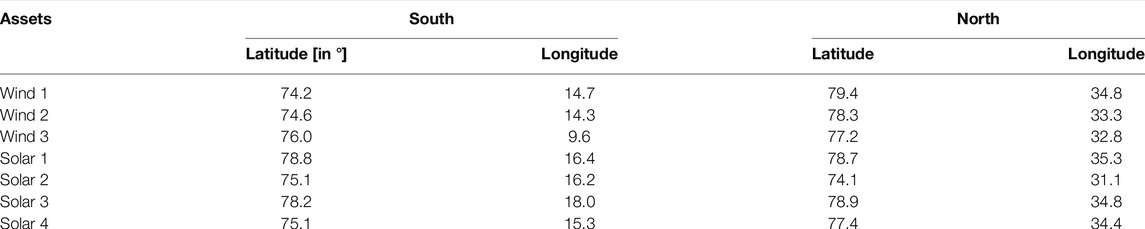
TABLE 5. Latitude and longitude of the assets in the South and North.
For the analysis of the results, we evaluate how the spread of the efficient frontiers associated with the mixed portfolios differs from the one found for wind- and solar-only portfolios. The results are presented in Figure 10, where the first row depicts the results for the set located in the South from 2025 to 2055 and the second row depicts the ones for the set located in the North for the second time-period.
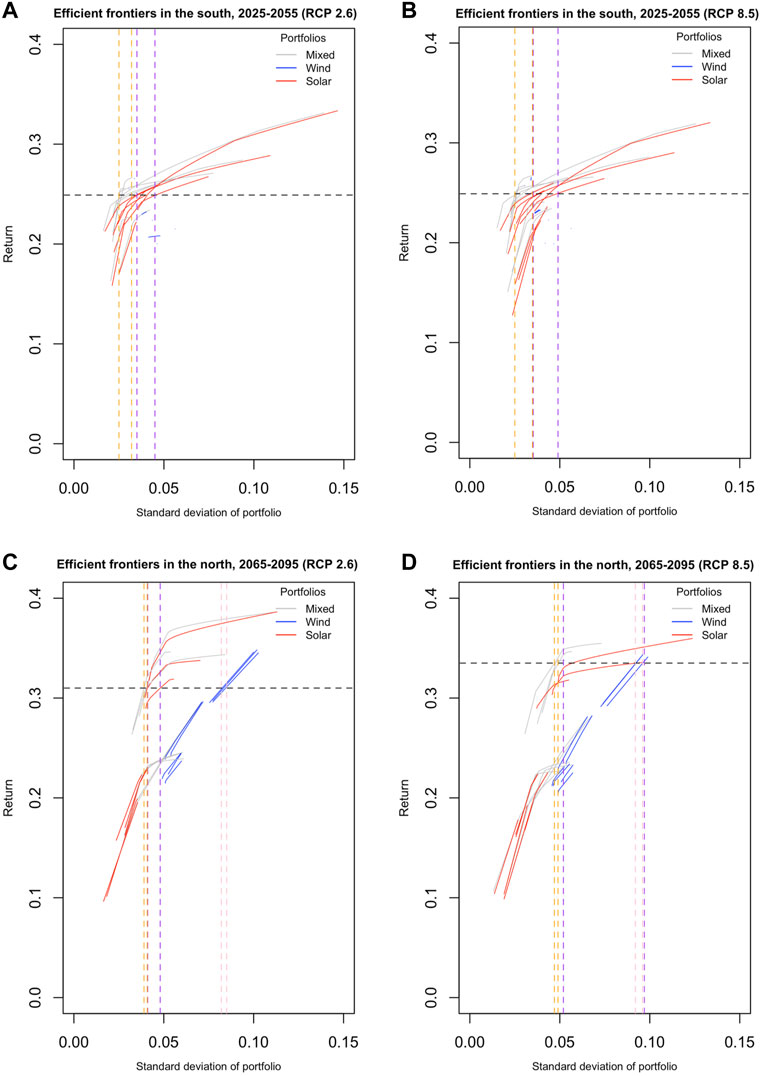
FIGURE 10. Efficient frontiers from the CORDEX WAS models in the portfolio set 1 located in the South for the period between 2025 and 2055 under RCP 2.6 scenario (A) and RCP 8.5 scenario (B). (C,D) are the efficient frontiers obtained for portfolio set 2 in the North for the period between 2065 and 2095 for RCP 2.6and RCP 8.5, respectively. On each graph, the black horizontal dashed line represents the level of portfolio return examined, and vertical dashed lines represent thespread of its associated standard deviation for mixed (orange lines), wind-only (pink lines), and solar-only (purple lines) portfolios.
In the southern region, under RCP 2.6 and during the first time-period, the evaluation of the efficient frontiers obtained for the set of asset in Figure 10A shows that for a return level of 0.25, the standard deviation of the portfolio for solar-only portfolios ranges between 0.035 and 0.045. The efficient frontier of wind-only portfolios has only one optimal solution for the level of return, and the standard deviation converges to a single value of 0.032. Different weight values of the three wind assets currently evaluated cannot improve the optimal return and thus its attached standard deviation. The standard portfolio for mixed portfolios ranges from 0.025 to 0.032. The mixed portfolio reduces the spread of the standard deviation of the portfolio for this return level by 30% compared to the solar-only type. In the same region and time period, under RCP 8.5, Figure 10B shows that for the same return level of 0.25, the reduction of the uncertainty range for the mixed portfolio compared to the solar-only type is also valid as the standard deviation of the portfolio for solar-only varies from 0.035 to 0.049, while it ranges between 0.025 and 0.035 for the mixed type, which also corresponds to a reduction of 30%. In the North, where the seasonal anti-correlation between wind and solar radiation variables extends throughout the year under RCP 2.6 and between 2065 and 2095, Figure 10C highlights that for a return level of 0.31, the spread of the standard deviation of solar-only portfolios ranges from 0.041 to 0.48, from 0.082 to 0.085 for the wind-only type, and from 0.039 to 0.041 for the mixed portfolio. Hence, the reduction obtained with the mixed portfolio reaches a level of 71.4% compared to the solar-only and 33.3% compared to the wind-only type. For this same set, under RCP 8.5, we find that for a return level of 0.34 (Figure 10D), the spread of the standard deviation for solar-only portfolios ranges from 0.052 to 0.097, for wind-only portfolios is between 0.092 and 0.096, and for the mixed portfolios is between 0.047 and 0.490. This entails that the range obtained with the mixed portfolio for the return level evaluated leads to reduction of the uncertainty on the standard deviation by 96% compared to the solar-only portfolio type and 50% compared to the wind-only one. The benefits of the portfolio method are demonstrated in the two regions presented considering the reduction of the spread in the efficient frontiers for a certain return value when the portfolios are mixed compared to the portfolios of solar-only type in the first case and both wind and solar for the second case. We highlight that we also find cases where the reduction of the spread for the mixed portfolios does not hold. Yet, we consistently find that mixed portfolios offer a great advantage in reaching higher return levels for low- to-medium-risk portfolios (efficient frontiers on the left), and this constitutes a desired advantage for investors. The results also indicate that the reduction in the uncertainty is more substantial for the solar-only portfolios than the wind-only ones. The variability at the monthly time-scales is higher for wind than solar portfolios. We investigate the impact of time resolution on the findings and redo the analysis in the same regions with daily data for CORDEX WAS-22 data under both RCP scenarios. We evaluate the differences in the spread of the mixed portfolio compared to the single portfolio types from daily data for the same return levels defined for monthly data. The results are included in Figure 11.
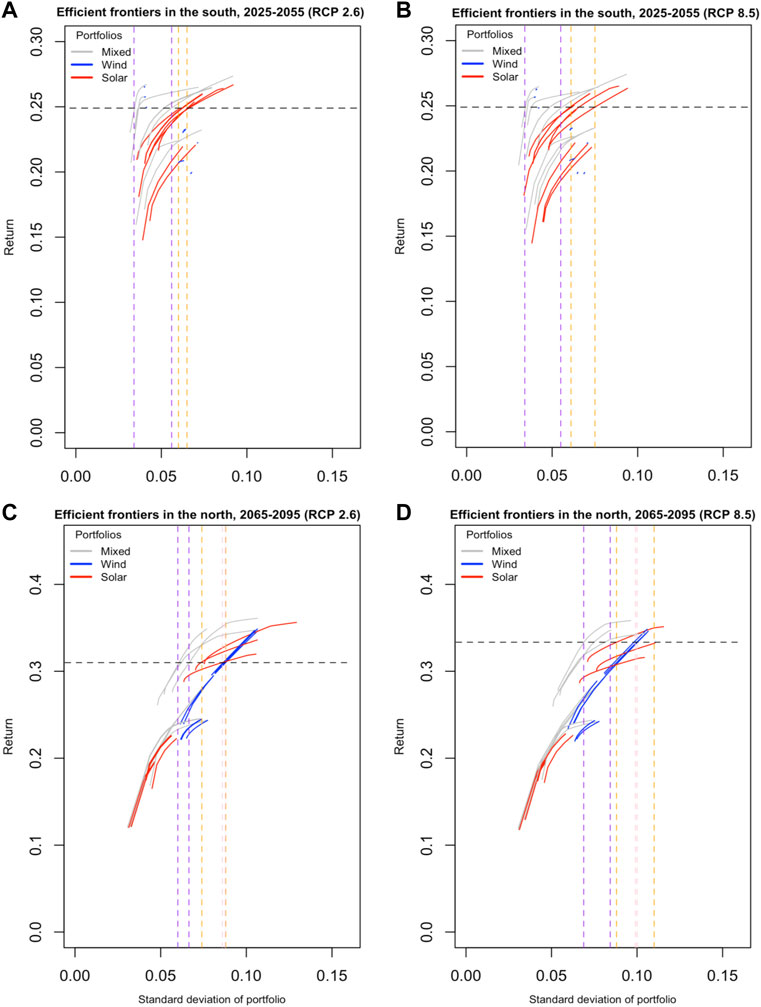
FIGURE 11. Efficient frontiers from CORDEX WAS models at the daily time resolution in the portfolio set 1 located in the South for the period between 2025 and 2055 under RCP 2.6 scenario (A) and RCP 8.5 scenario (B). (C, D) are the efficient frontiers obtained for portfolio set 2 in the North for the period between 2065 and 2095 for RCP 2.6 and RCP 8.5, respectively. On each graph, the black horizontal dashed line represents the level of portfolio return examined, and vertical dashed lines represent the spread of its associated standard deviation for mixed (orange lines), wind-only (pink lines), and solar-only (purple lines) portfolios.
In the South, with daily data, the reduction in the spread of the uncertainty for the mixed portfolio compared to the solar-only type is effective for return levels below 0.22. The efficient frontiers for wind portfolios from daily data have the same characteristics with a single optimal solution. In the North, with daily data, we find that mixed portfolios have a lower uncertainty spread than solar ones for high return levels (above 0.30). The conclusions found at the monthly resolution remain valid with daily data.
Seasonal monsoons play a crucial role in determining the local climate in India and are also impacted by climate change. Recognizing the uncertainty in climate models, the underlying idea in this study is to highlight that if climate models wrongly predict a future modification in a weather pattern such as monsoon, then the potential loss in one parameter, for example, solar radiation can be compensated by a potential increase in another one, wind, since these two variables are often anti-correlated. To exemplify this idea, we first compare surface wind speed, temperature, and solar radiation variables from CORDEX WAS-22 data with ERA5 to assess their performance in reproducing climatological characteristics in an historical period. The examination of the standardized anomalies for wind speed and solar radiation in different locations illustrates variability between climate models but shows in general a good performance. We then determine the annual and seasonal climatology and trends of these climate variables during two periods in the future, namely, 2025 to 2055 and 2065 to 2095 and calculate the seasonal trends in five subregions of the Indian territory in order to identify regions where the trends between radiation and wind are anti-correlated during the monsoon. Finally, we construct solar assets in selected locations to test if the portfolio methods reduce the uncertainty of the projections. The research outcomes infer that this method does not necessarily influence the level of the total return obtained, intending not the energy output expressed in terms of a capacity factor, but the uncertainty of this estimated return. Hence, we show that by accounting for the correlation between wind and solar energy in two different Indian regions, the application of the portfolio framework highlights not only the diversification potential, which is a known benefit, but also enables reducing uncertainty estimates compared to a single variable, wind-only, or solar-only assessment. The analyses and conclusion on any upward or downward trend in wind and solar energy output are from the energy resource perspective. Whether these available resources can be fully converted into energy output would be subjected to other technical, commercial, and operational factors in the lifetime of the asset (e.g., component or system degradation reduces the output over time).
This research is carried out in a climate change assessment perspective in an effort to push forward the inclusion of climate models in future discount cash flow models of investors that engage in the energy transition with a rapid shift to clean energy. We develop an analysis that is simple and reproducible in any other region where wind and solar trends are anti-correlated. The exercise can be carried out in existing or planned wind and solar assets without a limitation on a specific portfolio structure. Therefore, future analysis should explore other regions in South Asia heavily influenced by monsoon interactions, which can be good candidates for further case studies.
We acknowledge that one major limitation of this study is the use of raw climate data to estimate portfolio returns instead of bias-corrected datasets. However, we want to point out that the portfolio method could be applied to current data from climate models and for current local data. The comparison between the three pairs (CORDEX, reanalysis, and local data) would then allow to estimate more local effects since it is known that the climate change signal, that is, the difference between the current and future climate portfolio will often be preserved during downscaling (Michel et al., 2021). Furthermore, the use of bias correction techniques with local data would strongly be limited in our case because we do not have access to good data that we can use to compare the corrected dataset and validate the results. As an illustration, wind speed measurements in India from the Integrated Surface Database (ISD) of the National Center for Environmental Information (NCEI) of the National Oceanic and Atmospheric Administration (NOAA) (Smith et al., 2011) present gaps, and the available stations are not necessarily close enough to the locations studied. The gap in the availability of solar data in India because of the unavailability of ground monitoring stations is discussed in the literature (Kumar, 2021).
The first practical implication of our research for investors in India resides in the fact that there are locations where the risk is decreased when combining two asset types and other locations where the combination appears less effective. This information may be useful in picking sites for development of wind and solar renewable assets. We also see the value of our study to portfolio managers interested in investigating future investment possibilities in regions with no long-term track of wind and solar measurements. Ziegler et al. (2018); Kumar et al. (2022) recommend the extension of the lifetime for existing wind farms in order to increase investment values. Therefore, further applications of portfolio methods with climate models can also tackle the threats to wind development linked to aging installations in the context of re-powering decisions to increase efficiency.
Publicly available datasets were analyzed in this study. CORDEX data can be found here: https://esgf-node.llnl.gov/projects/esgf-llnl/. ERA5 data used in this study may be accessed and freely downloaded at: https://cds.climate.copernicus.eu/cdsapp#!/dataset/reanalysis-era5-single-levels?tab=form (Last accessed on 8 April 2022).
YZ collected the data, performed the analysis, and wrote the manuscript with support from ML. ML and FV provided critical feedback and helped shape the manuscript. All authors contributed to the interpretation of the results.
This research was supported by CLP Group.
The authors declare that the research was conducted in the absence of any commercial or financial relationships that could be construed as a potential conflict of interest.
All claims expressed in this article are solely those of the authors and do not necessarily represent those of their affiliated organizations, or those of the publisher, the editors, and the reviewers. Any product that may be evaluated in this article, or claim that may be made by its manufacturer, is not guaranteed or endorsed by the publisher.
This work has also contributed to the general aims of the SWEET-EDGE project.
The Supplementary Material for this article can be found online at: https://www.frontiersin.org/articles/10.3389/fenrg.2022.859321/full#supplementary-material
Ando, A. W., Fraterrigo, J., Guntenspergen, G., Howlader, A., Mallory, M., Olker, J. H., et al. (2018). When Portfolio Theory Can Help Environmental Investment Planning to Reduce Climate Risk to Future Environmental Outcomes—And when it Cannot. Conservation Lett. 11, e12596. doi:10.1111/conl.12596 eprint Available from: https://conbio.onlinelibrary.wiley.com/doi/pdf/10.1111/conl.12596
Archer, C. L., and Jacobson, M. Z. (2005). Evaluation of Global Wind Power. J. Geophys. Res. 110, D12110. doi:10.1029/2004JD005462
Bichet, A., Diedhiou, A., Hingray, B., Evin, G., Touré, N. D. E., Browne, K. N. A., et al. (2020). Assessing Uncertainties in the Regional Projections of Precipitation in CORDEX-AFRICA. Climatic Change 162, 583–601. doi:10.1007/s10584-020-02833-z
Crook, J. A., Jones, L. A., Forster, P. M., and Crook, R. (2011). Climate Change Impacts on Future Photovoltaic and Concentrated Solar Power Energy Output. Energy Environ. Sci. 4, 3101–3109. doi:10.1039/C1EE01495A
Dubey, S., Sarvaiya, J. N., and Seshadri, B. (2013). Temperature Dependent Photovoltaic (PV) Efficiency and its Effect on PV Production in the World - A Review. Energ. Proced. 33, 311–321. doi:10.1016/j.egypro.2013.05.072
Dujardin, J., Kahl, A., and Lehning, M. (2021). Synergistic Optimization of Renewable Energy Installations through Evolution Strategy. Environ. Res. Lett. 16, 064016. doi:10.1088/1748-9326/abfc75
Evin, G., Hingray, B., Blanchet, J., Eckert, N., Morin, S., and Verfaillie, D. (2019). Partitioning Uncertainty Components of an Incomplete Ensemble of Climate Projections Using Data Augmentation. J. Clim. 32, 2423–2440. doi:10.1175/JCLI-D-18-0606.1
Evin, G., Somot, S., and Hingray, B. (2021). Balanced Estimate and Uncertainty Assessment of European Climate Change Using the Large Euro-Cordex Regional Climate Model Ensemble. Earth Syst. Dyn. Discuss. 2021, 1–40. doi:10.5194/esd-2021-8
Feron, S., Cordero, R. R., Damiani, A., and Jackson, R. B. (2021). Climate Change Extremes and Photovoltaic Power Output. Nat. Sustain. 4, 270–276. doi:10.1038/s41893-020-00643-w
Gao, M., Ding, Y., Song, S., Lu, X., Chen, X., and McElroy, M. B. (2018). Secular Decrease of Wind Power Potential in India Associated with Warming in the Indian Ocean. Sci. Adv. 4, eaat5256. doi:10.1126/sciadv.aat5256Publisher: American Association for the Advancement of Science _eprint Available from: https://advances.sciencemag.org/content/4/12/eaat5256.full.pdf
Gernaat, D. E. H. J., de Boer, H. S., Daioglou, V., Yalew, S. G., Müller, C., and van Vuuren, D. P. (2021). Climate Change Impacts on Renewable Energy Supply. Nat. Clim. Chang. 11, 119–125. doi:10.1038/s41558-020-00949-9
Giorgi, F., Coppola, E., Solmon, F., Mariotti, L., Sylla, M., Bi, X., et al. (2012). Regcm4: Model Description and Preliminary Tests over Multiple Cordex Domains. Clim. Res. 52, 7–29. doi:10.3354/cr01018
Hairat, M. K., and Ghosh, S. (2017). 100 GW Solar Power in India by 2022 - A Critical Review. Renew. Sust. Energ. Rev. 73, 1041–1050. doi:10.1016/j.rser.2017.02.012
Hu, J., Harmsen, R., Crijns-Graus, W., and Worrell, E. (2019). Geographical Optimization of Variable Renewable Energy Capacity in China Using Modern Portfolio Theory. Appl. Energ. 253, 113614. doi:10.1016/j.apenergy.2019.113614
Intergovernmental Panel on Climate Change (2014). Climate Change 2014 Mitigation of Climate Change: Working Group III Contribution to the Fifth Assessment Report of the Intergovernmental Panel on Climate Change. Cambridge: Cambridge University Press. doi:10.1017/CBO9781107415416
IPCC (2013). Annex I: Atlas of Global and Regional Climate Projections. Cambridge, United Kingdom and New York, NY, USA: Cambridge University Press. book section AI. 1311–1394. doi:10.1017/CBO9781107415324.029
IPCC (2007). “Climate Change 2007: The Physical Science Basis,” Contribution of Working Group I to the Fourth Assessment Report of the Intergovernmental Panel on Climate Change. Editor S. Solomon, D. Qin, M. Manning, Z. Chen, M. Marquis, K. B. Averytet al. Cambridge, United Kingdom and New York, NY, USA: Cambridge University Press, 996.
Jacob, D., Elizalde, A., Haensler, A., Hagemann, S., Kumar, P., Podzun, R., et al. (2012). Assessing the Transferability of the Regional Climate Model Remo to Different Coordinated Regional Climate Downscaling experiment (Cordex) Regions. Atmosphere 3, 181–199. doi:10.3390/atmos3010181
Jerez, S., Tobin, I., Vautard, R., Montávez, J. P., López-Romero, J. M., Thais, F., et al. (2015). The Impact of Climate Change on Photovoltaic Power Generation in Europe. Nat. Commun. 6, 10014. doi:10.1038/ncomms10014
Jin, Q., Wei, J., Lau, W. K. M., Pu, B., and Wang, C. (2021). Interactions of Asian mineral Dust with Indian Summer Monsoon: Recent Advances and Challenges. Earth-Science Rev. 215, 103562. doi:10.1016/j.earscirev.2021.103562
Kapoor, K., Pandey, K. K., Jain, A. K., and Nandan, A. (2014). Evolution of Solar Energy in India: A Review. Renew. Sust. Energ. Rev. 40, 475–487. doi:10.1016/j.rser.2014.07.118
Katzenberger, A., Schewe, J., Pongratz, J., and Levermann, A. (2021). Robust Increase of Indian Monsoon Rainfall and its Variability under Future Warming in CMIP6 Models. Earth Syst. Dynam. 12, 367–386. doi:10.5194/esd-12-367-2021
R. Krishnan, J. Sanjay, C. Gnanaseelan, M. Mujumdar, A. Kulkarni, and S. Chakraborty (Editors) (2020). Assessment of Climate Change over the Indian Region: A Report of the Ministry of Earth Sciences (MoES), Government of India (Singapore: Springer Singapore). doi:10.1007/978-981-15-4327-2
Kumar, A., Pal, D., Kar, S. K., Mishra, S. K., and Bansal, R. (2022). An Overview of Wind Energy Development and Policy Initiatives in India. Clean. Techn Environ. Pol., 1–22. doi:10.1007/s10098-021-02248-z
Kumar, D. (2021). Spatial Variability Analysis of the Solar Energy Resources for Future Urban Energy Applications Using Meteosat Satellite-Derived Datasets. Remote Sensing Appl. Soc. Environ. 22, 100481. doi:10.1016/j.rsase.2021.100481
Lolla, S., Roy, S. B., and Chowdhury, S. (2015). Wind and Solar Energy Resources in India. Energ. Proced. 76, 187–192. doi:10.1016/j.egypro.2015.07.895
Lu, T., Sherman, P., Chen, X., Chen, S., Lu, X., and McElroy, M. (2020). India's Potential for Integrating Solar and on- and Offshore Wind Power into its Energy System. Nat. Commun. 11, 4750. doi:10.1038/s41467-020-18318-7
Mann, H. B. (1945). Nonparametric Tests against Trend. Econometrica 13, 245–259. doi:10.2307/1907187
Michel, A., Sharma, V., Lehning, M., and Huwald, H. (2021). Climate Change Scenarios at Hourly Time-step over Switzerland from an Enhanced Temporal Downscaling Approach. Intl J. Climatology 41, 3503–3522. doi:10.1002/joc.7032
Mitra, A. (2021). A Comparative Study on the Skill of CMIP6 Models to Preserve Daily Spatial Patterns of Monsoon Rainfall over India. Front. Clim. 3, 37. doi:10.3389/fclim.2021.654763
Mohanty, S., Patra, P. K., Sahoo, S. S., and Mohanty, A. (2017). Forecasting of Solar Energy with Application for a Growing Economy like India: Survey and Implication. Renew. Sust. Energ. Rev. 78, 539–553. doi:10.1016/j.rser.2017.04.107
Pachar, S., Singh, R., and Wahid, M. A. (2021). Implication of Renewable Energy in Sustainable Development in India: Future Strategy. IOP Conf. Ser. Mater. Sci. Eng. 1149, 012020. doi:10.1088/1757-899x/1149/1/012020
Patt, A., Pfenninger, S., and Lilliestam, J. (2013). Vulnerability of Solar Energy Infrastructure and Output to Climate Change. Climatic Change 121, 93–102. doi:10.1007/s10584-013-0887-0
Peters, I. M., and Buonassisi, T. (2019). “The Impact of Global Warming on Silicon PV Energy Yield in 2100,” in Proceeding of the 2019 IEEE 46th Photovoltaic Specialists Conference (PVSC), Chicago, IL, USA, June 2019 (IEEE), 3179–3181. doi:10.1109/PVSC40753.2019.8980515
Pryor, S. C., and Barthelmie, R. J. (2011). Assessing Climate Change Impacts on the Near-Term Stability of the Wind Energy Resource over the United States. Proc. Natl. Acad. Sci. U.S.A. 108, 8167–8171. doi:10.1073/pnas.1019388108Publisher: National Academy of Sciences _eprint Available from: https://www.pnas.org/content/108/20/8167.full.pdf
Rathore, P. K. S., Rathore, S., Pratap Singh, R., and Agnihotri, S. (2018). Solar Power Utility Sector in india: Challenges and Opportunities. Renew. Sust. Energ. Rev. 81, 2703–2713. doi:10.1016/j.rser.2017.06.077
Riahi, K., Rao, S., Krey, V., Cho, C., Chirkov, V., Fischer, G., et al. (2011). RCP 8.5-A Scenario of Comparatively High Greenhouse Gas Emissions. Climatic change 109, 33–57. doi:10.1007/s10584-011-0149-y
Roxy, K., and Chaithra, T. (2018). “Impacts of Climate Change on the Indian Summer Monsoon,” in Climate Change and Water Resources in India (New Delhi: Ministry of Environment, Forest and Climate Change (MoEF&CC), Government of India).
Sabater, M. J. (2019). Copernicus Climate Change Service (C3S) Climate Data Store (CDS). doi:10.24381/cds.e2161bacEra5-land Hourly Data from 1981 to Present
Sabeerali, C. T., and Ajayamohan, R. S. (2017). On the Shortening of Indian Summer Monsoon Season in a Warming Scenario. Clim. Dyn. 50, 1609–1624. doi:10.1007/s00382-017-3709-7
Schlott, M., Kies, A., Brown, T., Schramm, S., and Greiner, M. (2018). The Impact of Climate Change on a Cost-Optimal Highly Renewable European Electricity Network. Appl. Energ. 230, 1645–1659. ArXiv: 1805.11673. doi:10.1016/j.apenergy.2018.09.084
Sen, P. K. (1968). Estimates of the Regression Coefficient Based on Kendall's Tau. J. Am. Stat. Assoc. 63, 1379–1389. doi:10.1080/01621459.1968.10480934
Sharma, A. (2019). “Assessing the Labor Impact of Clean Energy Transitions in India,”. AGU Fall Meeting Abstracts, 2019, GC31O–1281.
Sharma, N. K., Tiwari, P. K., and Sood, Y. R. (2012). Solar Energy in India: Strategies, Policies, Perspectives and Future Potential. Renew. Sust. Energ. Rev. 16, 933–941. doi:10.1016/j.rser.2011.09.014
Sherman, P., Song, S., Chen, X., and McElroy, M. (2021). Projected Changes in Wind Power Potential over China and India in High Resolution Climate Models. Environ. Res. Lett. 16, 034057. doi:10.1088/1748-9326/abe57c
Singh, J., and Kumar, M. (2016). Solar Radiation over Four Cities of India: Trend Analysis Using Mann-Kendall Test. Int. J. Renew. Energ. Res. 6.
Smith, A., Lott, N., and Vose, R. (2011). The Integrated Surface Database: Recent Developments and Partnerships. Bull. Am. Meteorol. Soc. 92, 704–708. doi:10.1175/2011BAMS3015.1
Solaun, K., and Cerdá, E. (2019). Climate Change Impacts on Renewable Energy Generation. A Review of Quantitative Projections. Renew. Sust. Energ. Rev. 116, 109415. doi:10.1016/j.rser.2019.109415
Soni, V. K., Pandithurai, G., and Pai, D. S. (2012). Evaluation of Long-Term Changes of Solar Radiation in india. Int. J. Climatol. 32, 540–551. doi:10.1002/joc.2294
Sørland, S. L., Brogli, R., Pothapakula, P. K., Russo, E., Van de Walle, J., Ahrens, B., et al. (2021). COSMO-CLM Regional Climate Simulations in the CORDEXframework: A Review. doi:10.5194/gmd-2020-443
Stefanidis, S., Dafis, S., and Stathis, D. (2020). Evaluation of Regional Climate Models (Rcms) Performance in Simulating Seasonal Precipitation over Mountainous central Pindus (greece). Water 12, 2750. doi:10.3390/w12102750
Tantet, A., Stéfanon, M., Drobinski, P., Badosa, J., Concettini, S., Cretì, A., et al. (2019). e4clim 1.0: The Energy for a Climate Integrated Model: Description and Application to Italy. Energies 12, 4299. doi:10.3390/en12224299
Theil, H. (1950). A Rank Invariant Method of Linear and Polynomial Regression Analysis, i, ii, iii. Proceedings. Series A. Mathematical Sciences 53, 386–392, 521–525, 1397–1412.
Turner, A. G., and Annamalai, H. (2012). Climate Change and the South Asian Summer Monsoon. Nat. Clim Change 2, 587–595. doi:10.1038/nclimate1495
Wang, B., Biasutti, M., Byrne, M. P., Castro, C., Chang, C.-P., Cook, K., et al. (2021). Monsoons Climate Change Assessment. Bull. Am. Meteorol. Soc. 102, E1–E19. doi:10.1175/BAMS-D-19-0335.1
Weber, J., Wohland, J., Reyers, M., Moemken, J., Hoppe, C., Pinto, J. G., et al. (2018). Impact of Climate Change on Backup Energy and Storage Needs in Wind-Dominated Power Systems in Europe. PLOS ONE 13, e0201457. doi:10.1371/journal.pone.0201457
Wild, M., Folini, D., Henschel, F., Fischer, N., and Müller, B. (2015). Projections of Long-Term Changes in Solar Radiation Based on CMIP5 Climate Models and Their Influence on Energy Yields of Photovoltaic Systems. Solar Energy 116, 12–24. doi:10.1016/j.solener.2015.03.039
Wu, J., Zha, J., Zhao, D., and Yang, Q. (2018). Changes in Terrestrial Near-Surface Wind Speed and Their Possible Causes: an Overview. Clim. Dyn. 51, 2039–2078. doi:10.1007/s00382-017-3997-y
Zeng, Z., Piao, S., Li, L. Z. X., Ciais, P., Li, Y., Cai, X., et al. (2018). Global Terrestrial Stilling: Does Earth's Greening Play a Role? Environ. Res. Lett. 13, 124013. doi:10.1088/1748-9326/aaea84
Zhisheng, A., Guoxiong, W., Jianping, L., Youbin, S., Yimin, L., Weijian, Z., et al. (2015). Global Monsoon Dynamics and Climate Change. Annu. Rev. Earth Planet. Sci. 43, 29–77. doi:10.1146/annurev-earth-060313-054623
Keywords: CORDEX, climate change, wind energy, solar PV, India, uncertainty, portfolio analysis
Citation: Zakari Y, Vuille F and Lehning M (2022) Climate Change Impact Assessment for Future Wind and Solar Energy Installations in India. Front. Energy Res. 10:859321. doi: 10.3389/fenrg.2022.859321
Received: 21 January 2022; Accepted: 03 March 2022;
Published: 11 May 2022.
Edited by:
Adrian Ilinca, Université du Québec à Rimouski, CanadaReviewed by:
Nallapaneni Manoj Kumar, University of Hong Kong, Hong Kong SAR, ChinaCopyright © 2022 Zakari, Vuille and Lehning. This is an open-access article distributed under the terms of the Creative Commons Attribution License (CC BY). The use, distribution or reproduction in other forums is permitted, provided the original author(s) and the copyright owner(s) are credited and that the original publication in this journal is cited, in accordance with accepted academic practice. No use, distribution or reproduction is permitted which does not comply with these terms.
*Correspondence: Yasmine Zakari, eWFzbWluZS56YWthcmlAZXBmbC5jaA==
Disclaimer: All claims expressed in this article are solely those of the authors and do not necessarily represent those of their affiliated organizations, or those of the publisher, the editors and the reviewers. Any product that may be evaluated in this article or claim that may be made by its manufacturer is not guaranteed or endorsed by the publisher.
Research integrity at Frontiers
Learn more about the work of our research integrity team to safeguard the quality of each article we publish.