 Yongtao Guo
 Yue Xiang
- College of Electrical Engineering, Sichuan University, Chengdu, China
With the rapid promotion of renewable energy technologies and the trend to a low-carbon society, the positive impacts of an integrated energy system that realizes various forms of energy-utilizing improvement and carbon reduction have fully emerged. Hydrogen with a decarbonized characteristic being integrated into the integrated energy system has become a viable option to offset the intermittency of renewables and decline the fossil fuel usage. An optimal planning model of a wind–photovoltaic–hydrogen storage-integrated energy system with the objective of total economic and environmental cost minimization by considering various energy technology investments is proposed. Case studies are developed to compare the economic and environmental benefits of different energy investment scenarios, especially hydrogen applications. The cost–benefit analysis was carried out to prove that hydrogen investment is not a cost-competitive option but can alleviate the burden of carbon emissions somehow. Finally, sensitivity analysis of key parameters of sale capacity, carbon tax, and renewable penetration level was performed to indicate the rational investment for a wind–photovoltaic–hydrogen storage-integrated energy system.
1 Introduction
In recent years, from facing the reality of shortage in fossil energy resources and severe pollution in the natural environment, it is urgently needed to introduce an entirely new mode of energy consumption for utilization improvements and carbon reductions. Establishing an efficient, environment-friendly, and sustainable energy system has become a common consensus all over the world (Wang et al., 2019a). The integrated energy system (IES), coupling many forms of energy sources such as electricity, heat, and cold by implementing energy conversion technologies for solar, wind, natural gas, and other resources (Yu et al., 2016; Zhang et al., 2019), considered to be a promising structure for future energy systems, is now showing its explicit superiority in efficient utilization of energy and carbon reduction, as well as the economic cost (Khalilpour and Vassallo, 2016). It is proved that with coordinated planning and a reasonable design for an IES, the purposes of energy utilization improvements and carbon and energy waste reductions can be fully achieved (Wang et al., 2019b), while saving a considerable amount on planning costs (Karmellos and Mavrotas, 2019).
Research on the operation and planning of integrated energy systems has become a very popular trend. It is noticed that an integrated energy system usually involves the components of combined heat and power (CHP), a gas boiler (GB), a battery energy storage system (BESS), and a power inverter (INV). Moreover, there are often a wind turbine (WT) and photovoltaic (PV) cell being taken into account owing to the need to integrate renewable energy generation methods (Zhao et al., 2021). With such different types of components to meet the demand of electric and heating loads for residential, commercial, or industrial consumption, the main focus of an IES is to determine the optimal capacity of each energy device to make it economical and reveal typical energy management patterns. A planning model that can identify the optimal configurations and sizes of different technologies in an IES such as WT, PV, GB, and CHP by the minimizing total annual cost is included in the Reference section (Weber and Shah, 2011). Similarly, an optimal model based on MILP for optimal locations, configurations, and structure for an IES design aiming to minimize the total annual cost is cited in the Reference section. (Yang et al., 2015). In Ref. (Ma et al., 2018), an optimal planning model of an IES is proposed with its performance reaching the same as optimal configuration and energy management strategy models with the least annual cost. In Ref. (Xiang et al., 2020), a generic planning model is proposed to optimize the capacity allocation of an IES from an economical and environmental viewpoints.. In the integrated energy system planning, the uncertainties associated with the supply and demand factors are also regarded as important factors. In Ref. (Nazari and Keypour, 2019), the demand response and environmental uncertainty were taken into account to better allocate the energy storage for a micro-grid, and its economic value was evaluated. An uncertainty model of demand response is established for electricity–gas-integrated energy system planning by extracting the adjustable characteristics of different energy load in Ref. (Zeng et al., 2019). In Ref. (Liu et al., 2020; Liu et al., 2022), two effective expansion planning methods for transmission and active distribution networks were proposed, where the uncertainties associated with supply (PV and WT generation) and demand (electric load) factors were fully analyzed and discussed so that a better economic efficiency and reliability can be achieved.
The above research studies tended to put effort in sizing the capacity and analyzing how different forms of energy sources can work coordinately, while the economic factor was simply shown in the form of total annual cost. However, when it comes to considering all costs of a product with a long lifespan and/or with relatively high operating costs, assessing the economic benefits throughout the system’s lifetime is a more precise key factor to the whole project as it tells when the money will be paid back during the limited project lifetime after investing in IES projects. Thus, a cost–benefit analysis is required urgently to figure out how cash is specifically spent or earned during the whole period of an IES project. The effective solution is to calculate the total net present cost (NPC) and each year’s net present value (NPV) by introducing the capital recovery factor (CRF) and discounted factor. The life cycle cost–benefit analysis for optimal configuration of an IES within the whole project is facilitated in relative studies (Mudasser et al., 2015; Ramli et al., 2015; Xiang et al., 2021) where the total costs and revenues can be learned in detail, including the capital cost, operation and maintenance (O&M) cost, replacement cost, and electricity purchase from the utility grid, along with the income from power sale to the utility grid and salvage value at the end of the devices’ lifespan. In addition, the discounted payback period of IES projects can also be discovered. The impacts from these parameters are usually regarded to be more essential and valuable for practical IES planning projects.
However, investors tend to pay much attention to the practical cost-effectiveness of IES projects rather than to the government’s emphasis on comprehensive benefits between cost and environment (although an IES have been proved to operate with high energy efficiency, there remains a lot of environmental pollution problems). For further decarbonization of IES, hydrogen is regarded as one of the most promising alternative energy carriers for real-life applications, which has been widely used as an important industrial feedstock for decades. Besides, electric vehicles fueled by hydrogen could provide a low-carbon mobility option with even superior experience compared to conventional vehicles (Lin et al., 2021). The explicit advantages are not only that hydrogen itself is extremely clean and carbon free but also reachable and available from the electrolysis of water by using excess renewable energy generation, realizing both carbon reduction and energy utilization improvement. Hydrogen generated from water electrolysis powered by renewable electricity can be called as “green hydrogen” (IEA, 2017). More specifically, hydrogen can be produced through a hydrogen energy system (HES) mainly comprising an electrolyzing set up, hydrogen storage tank (HST), and fuel cell generation unit (FC). The effort has been made to investigate the cost and benefit of integrating hydrogen into an IES in real-life applications. In Ref. (Rad et al., 2020), a cost-effective analysis for a hybrid PV, WT, biogas generation, and HES energy systems was performed for a real case in a rural area in Iran, which indicates that although adding the HES would increase the whole cost, less pollution would occur. In Ref. Glenk and Reichelstein et al. (2019), the economics of utilizing excess renewable energy generation for hydrogen production was investigated, showing that hydrogen from renewable generation is already cost competitive in niche applications and keeps its way becoming more competitive with industrial energy supply within a decade in Germany and Texas. In Zhao et al. (2019), the life cycle cost analysis was conducted from a demonstration project including WT, PV, and green hydrogen located on the island of Orkney in the United Kingdom. Comparisons have been made to prove that using hydrogen helps reduce carbon emissions evidently, but the cost remains still higher than fossil fuel supply.
The aforementioned research studies all rise actual cases as examples to carry out a cost–benefit analysis of hydrogen energy application, which indicates more convincingly that there is a broad and promising prospect of hydrogen energy application in integrated energy system planning. However, the main barrier of hydrogen integration into the energy system is the cost reduction that is necessary, even considering environmental benefits. Therefore, it is of great necessity to make a detailed comparative cost–benefit analysis of hydrogen energy investment in integrated energy system planning.
Based on the above consideration, the low-carbon strategic planning of a wind–photovoltaic–hydrogen storage-integrated energy system as well as the cost–benefit effect is analyzed in this article. The main contributions of the article are as follows:
(1) An optimal planning model of wind–photovoltaic–hydrogen storage-integrated energy system, involving the capital and operation characteristics of PV, WT, BESS, CHP, and hydrogen energy systems, is proposed for fully analyzing the cost and benefit from the life cycle perspective.
(2) Different investment scenarios are studied and compared attempting to accommodate excess renewable energy generation and provide a carbon-free energy carrier. The wind–photovoltaic–storage-integrated energy system plus hydrogen integration would stimulate more renewables investment as the carbon reduction is realized but has not been considered as a cost-competitive one.
(3) Sensitivity analysis is conducted to reveal the different parameters ranging from sale capacity to grid, carbon tax prices, and renewable penetration level on the whole integrated energy system optimal planning, providing multi-scale perspectives for wind–photovoltaic–hydrogen storage-integrated energy system investment.
The remainders of the article are organized as follows. Section 2 describes the main structure of the integrated energy system with hydrogen integration, and its key components are mathematically modeled in detail. In Section 3, the optimization planning method for an integrated energy system with hydrogen and various renewable investments is proposed. The case studies are illustrated in Section 4, in which the results and discussions are also conducted. Conclusions are drawn in Section 5.
2 Structure of the Wind–Photovoltaic–Hydrogen Storage-Integrated Energy System
Figure 1 illustrates the structure of the IES coupled with the hydrogen energy system. The IES is equipped with both renewable and conventional technologies, including locally distributed photovoltaic (PV) system, wind turbine (WT), battery energy storage system (BESS), combined heating and power supply unit (CHP), and gas boiler (GB). Besides, it is assumed that the IES is always an external power grid connected to guarantee an adequate energy supply. Meanwhile, the excess electricity generated from renewables can be sold to the external grid for some profits. All the electrical demand is satisfied by the external power grid, PV, WT, BESS, and CHP electricity supply while the heating demand is met by heat generation from CHP and GB.
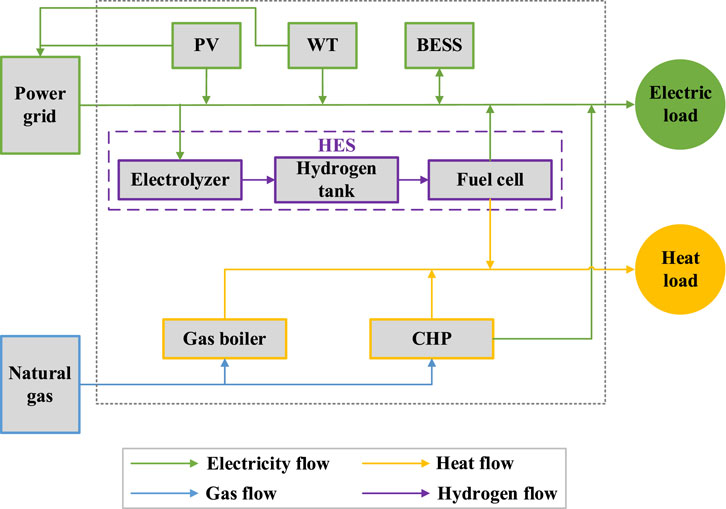
FIGURE 1. Brief structure of the wind–photovoltaic–hydrogen storage-integrated energy system.
The role of hydrogen integration is achieved by three related components: electrolyzer, hydrogen storage tank, and fuel cell. The electrolyzer and fuel cell realizes the conversion of electricity to hydrogen and hydrogen to electricity, respectively. In addition, during the hydrogen converting to the electricity process of fuel cell there will be a certain amount of heat production, which can be delivered to meet the heat demand. The hydrogen storage tank is used to compress and store the produced hydrogen.
2.1 Component Modeling
2.1.1 Solar Photovoltaic
The PV generation is determined by solar irradiance and cell temperature at standard test conditions (STC), which is expressed as
where
2.1.2 Wind Turbine
The power output of WT is related to wind speed and its rated capacity, which can be formulated as
where
2.1.3 Battery Energy Storage System
The modeling of battery energy storage system based on the state of charge (SOC) can be formulated as
where
2.1.4 Combined Heating and Power Unit
The CHP generates electricity by consuming natural gas, and at the same time, the accompanying heat can be recovered for heat load supply. The natural gas consumption of CHP is considered as a function of its electricity output, which is expressed as
where
The CHP heat production is determined by electrical generation and can be formulated as
where
2.1.5 Gas Boiler
The gas boiler in this article is used to ensure that the heat supply insufficiency never occurs. Similarly, natural gas consumption is needed for heat production of gas boilers, which can be expressed as
where
2.1.6 Hydrogen Energy System
Hydrogen energy system (HES) mainly consists of three essential components (electrolyzer, hydrogen storage tank, and fuel cell) and realizing carbon-free electricity generation. The electrolyzer is for hydrogen and oxygen production by electrolyzing the water, and the fuel cell generates electricity by consuming hydrogen as the original fuel. The energy converting process that happened in these two components can be modeled as
where
However, the hydrogen storage tank is acquired for hydrogen storage if there is hydrogen surplus. The hydrogen storage tank is formulated in
where
3 Optimal Planning Model of the Wind–Photovoltaic–Hydrogen Storage-Integrated Energy System
3.1 Objective Function
The optimal planning model is formulated as Eqs 11–14 to minimize the total annualized net present cost (NPC) of the project, in which the investment cost and total annual operation cost are involved.
where
3.2 Constraints
Since the investment and operation are both considered, the constraints should cover the whole investment consideration plus each time interval during the optimization. Above all, the planning capacity of devices is limited by the geographical reality and other factors expressed as
where
The electricity output of each energy source of PV, WT, CHP, electrolyzer, and fuel cell should stay at a certain output range for concerning the safety, reliability, and their internal performance, as formulated in
where
There are two kinds of storage being used during the optimization, and a similar change and discharge constraints should be taken into account, as shown in
where
The grid purchase and sale capacity constraint is formulated in Eq. 19. Notice that the electricity purchase and sale at the same time is not allowed in the modeling of this article.
The energy balance can be formulated in
where the electricity demand
4 Case Study
In this study, an integrated energy system for industrial purposes is proposed, assuming that the area is endowed with rich resources of wind, solar, and gas. In addition, the electric load and heat load data of the area are accessible. The optimal planning model of wind–photovoltaic–hydrogen storage-integrated energy system proposed in this article is used for capacity planning, aiming at a trade-off between minimum annual cost and maximum carbon reduction.
4.1 Case Description
There are groups of required input parameters including annual solar irradiance, wind speed, annual electric load, and heat load, as shown in Figures 2–5. These data are all with a time slot of 1 h. In addition, the technical parameters of candidate energy devices are listed in Table 1. The energy prices in each time period are shown in Table 2. The project lifetime, discount rate, and carbon tax are set to 25 years, 6%, and 50$/ton, respectively.
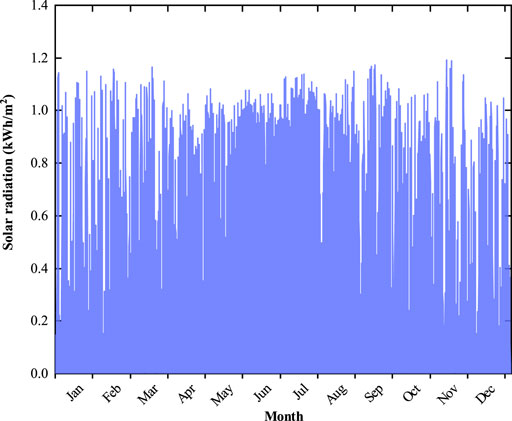
FIGURE 2. Annual solar radiation.
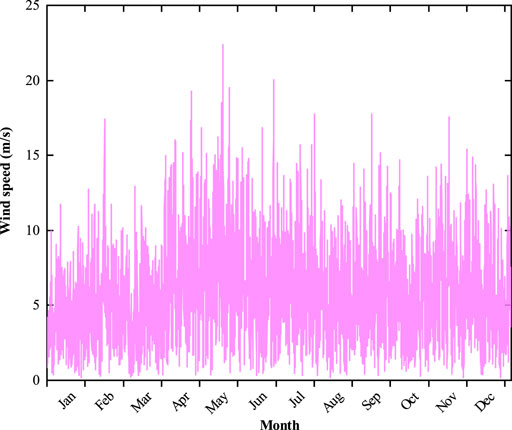
FIGURE 3. Annual wind speed.

FIGURE 4. Annual electrical load.
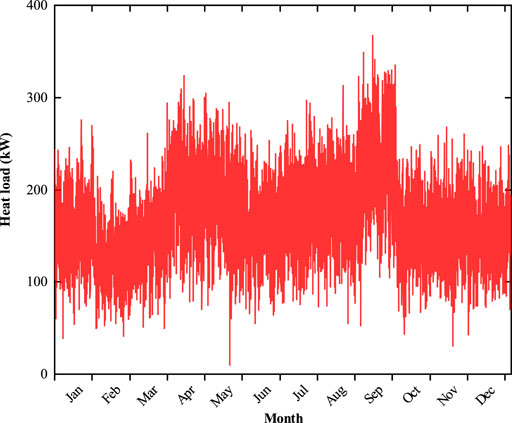
FIGURE 5. Annual heat load.
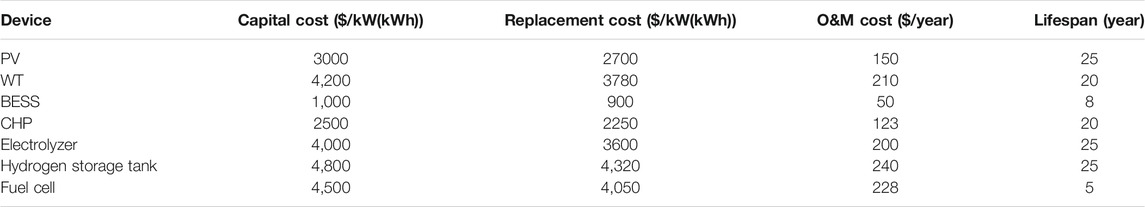
TABLE 1. Techno-economic parameters of energy devices.
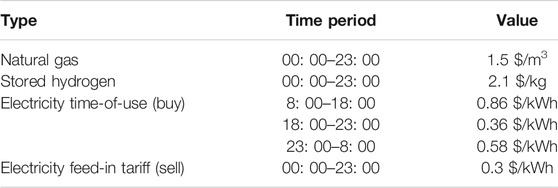
TABLE 2. Energy prices values.
Four cases are developed for comparison by considering different forms of energy sources subjected to various factors such as geographical resource endowment, actual area, and available technology of the integrated energy systems.
Scenario #1 (base scenario): considering investing CHP as the coupling unit of electricity and heat generation. Thus, the whole electric demand is catered by utility grid supply and CHP electricity generation whereas the heat demand is supplied by the CHP heat generation and gas boiler.
Scenario #2: assuming the area is endowed rich resources of solar energy but lack resources of wind energy. The electric load is supplied by PV, BESS, CHP, and the utility grid, and the CHP and gas boiler are the two heat demand suppliers.
Scenario #3: on the basis of scenario #2, assuming that there is enough land for facility construction and abundant resources endowed of wind energy in this IES area, and WT has been added as a new electricity supplier. The rest structure remains the same as Scenario #2.
Scenario #4: based on Scenario #3, hydrogen production and storage are considered in the integrated energy system. Similarly, the electric load is supplied by PV, WT, BESS, CHP, and utility grid. At the same time, the hydrogen fuel cell can generate part of the electricity. The heat load is supplied by CHP and the gas boiler.
4.2 Optimal Planning Results
The final optimal planning results of wind–photovoltaic–hydrogen storage in each scenario are shown in Table 3. The more specific cost breakdown is depicted in Figure 6. It can be observed that with the integration of different resources, the total cost and emissions significantly decreased. The result comparison between scenarios #2 and #3 indicates that though the higher initial investment cost occurred with the WT installation, the annualized total cost still dropped. This is because WT integration alleviates the dependence on grid purchases with a relatively high price during the operation (the proportion of grid operation in O&M cost dropped from 61.21 to 54.01% from the pie chart in Figure 6) and relieves the pressure of CHP electricity generation (less fuel purchase cost). In addition, the total carbon emission reduced about 560 tons due to new clean power supplier integration (i.e., WT). Scenarios #3 and #4 are attempted to compare what effects can be brought from the hydrogen energy system. Results show that the total investment capacity of PV and WT increased, and the corresponding BESS capacity increased. It can be conducted that integrating the hydrogen for carbon-free electricity supply and storage into an IES would stimulate more renewable energy investment and such variability of solar and wind power would be endured by adding a new hydrogen storage and conventional BESS capacity. Consequently, the annualized total cost would rise while total emission reduces.
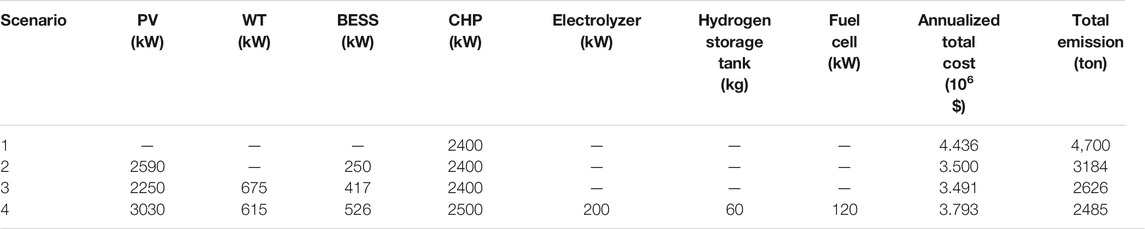
TABLE 3. Optimal planning results of wind–photovoltaic–hydrogen storage in different scenarios.
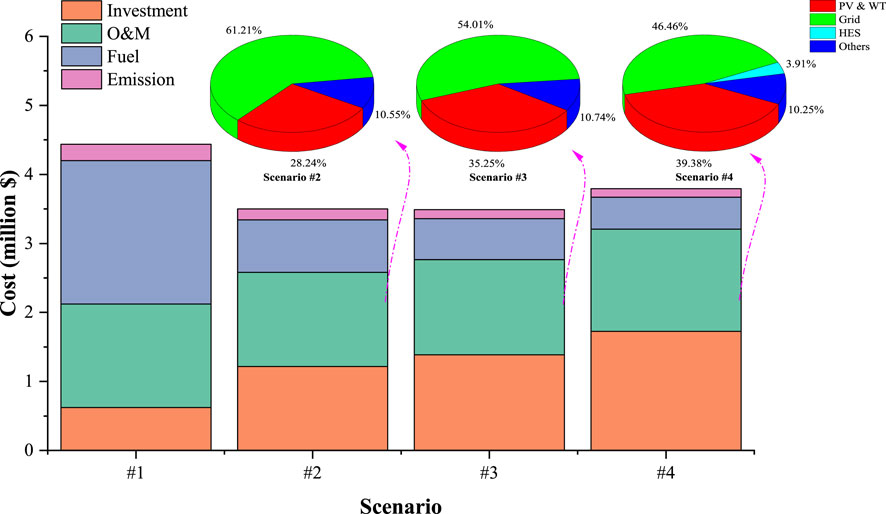
FIGURE 6. Cost breakdown of each investment scenario.
Despite the fact that hydrogen integration would lead to more carbon reductions, it is not cost competitive from the corresponding optimal result. From Figure 6, it can be learned what exact contribution hydrogen can bring. As seen, the total cost consists of investment, O&M cost of energy devices, fuel cost, and carbon emission cost. From the comparison between scenarios #3 and #4 in O&M cost, it is found that PV and WT operation cost increases from 35.25 to 39.38% of the total operation fee, which indicates that with the HES integration the more renewable generation would be adopted and contribute to much carbon reduction. Inevitably, the initial investment cost together with the O&M cost would increase. From the sole perspective of scenario #4, noticing that the hydrogen power generation and storage cost only occupies less than 4%, implying that the HES could not take over the role as the main carbon-free electricity supplier or electrical energy storage in the whole system. This explains why the HES is not expected to invest on a large scale at present.
Figure 7 shows the carbon emission in each scenario. Carbon emissions in this IES are mainly generated by the grid and gas-fired devices (i.e., CHP and GB). As seen, scenario #1 held the most emission due to the lack of carbon-free technologies. From scenarios #2 to #4, the total carbon emission gradually decreased. Compared to scenario #2, the carbon emission reduced in total in scenario #3 because of the WT investment, which makes grid supply dependence weaker and CHP electricity generation drop more. Thus, the corresponding carbon emissions are reduced from 1,390 and 1,794– to 1,136 tons and 1,490 tons, respectively. The same trend can also be observed from the comparison of scenario #3 and #4. When investing in HES in scenario #4, the total carbon emission would be further reduced owing to its stimulation to PV and WT investment. As depicted, though the carbon emissions from CHP and GB generation are barely unchanged, the emission from the grid reduced by 132 tons, resulting in the total carbon emission reduction, eventually in scenario #4.
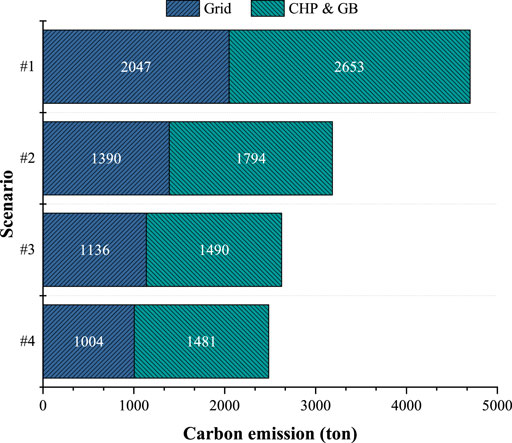
FIGURE 7. Carbon emissions of each scenario.
Main conclusions that can be drawn from the above results are as follows. Knowing the fact that the integration of HES can certainly reduce carbon emissions, the carbon reduction effect does not depend on hydrogen power generation via the fuel cell itself but also on HES’s positive impact on promoting more renewable energy generation investment. In other words, integrating an HES can be considered as a great motivation to invest more PV panels and WTs; hence, the carbon reduction is realized.
4.3 Life Cycle Cost–Benefit Analysis
To specifically learn about the economy during the whole project lifetime of each scenario, the life cycle–based cost–benefit analysis is carried out in this section. The cash flows based on the net present value (NPV) of each 4 scenarios are shown in Figure 8. It is observed that in the initial stage (year 0), the investment cost from scenario #1 to scenario #4 increased due to more energy devices being decided to install. Though it takes much initial investment cost in scenarios #2, #3, and #4, the situation reversed after the year 0. The operation costs in each year of scenarios #2, #3, and #4 are all lower than those in scenario #1. From the sight of the cumulative cash flow shown in Figure 9, it can be learned that breakeven points occurred in year 8, 9, and 11 for scenarios #2, #3, and #4 compared to scenario #1, which indicates that the investment in scenarios #2, #3 and #4 are starting to become cost competitive from then on.
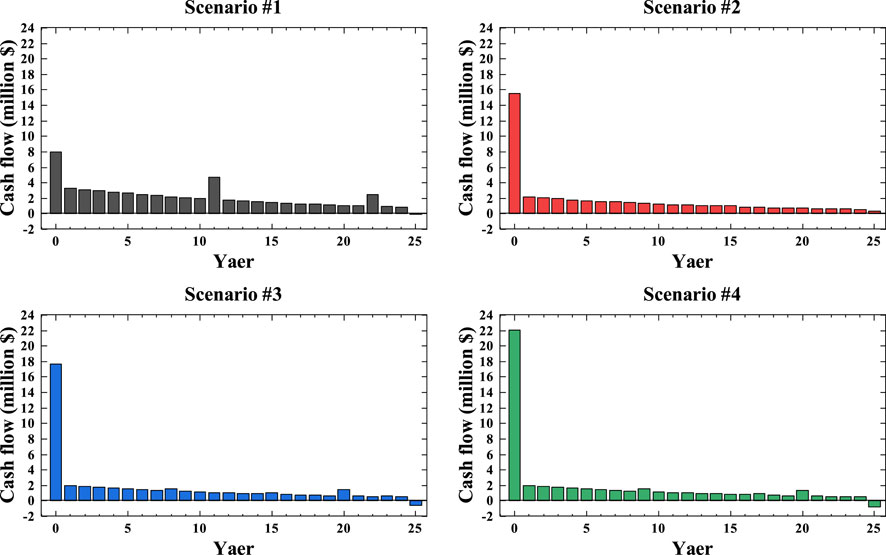
FIGURE 8. Cash flow of each scenario.
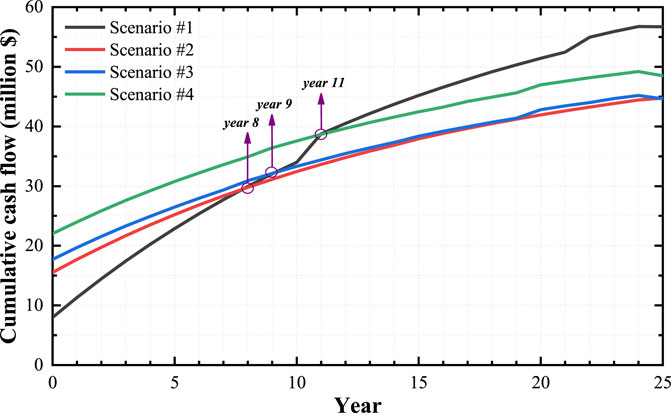
FIGURE 9. Cumulative cash flow of scenarios #1–#4.
There is no doubt that more types of new energy device integration do help achieve some economical goals in IES investment from the final cost–benefit analysis results. However, the ideal investment capacity is not easy to find. The three breakeven points in Figure 9 have proved that the high initial investment cost would certainly delay the final payback years. The cumulative cash flow curve in scenario #4 is always seated above than that in scenarios #2 and #3 and with no trend to drop, informing that whether trying to invest in numerous new decarburization technologies to pursue the environmental benefits would face the dilemma of the poor economy of the overall project lifetime.
4.4 Sensitivity Analysis of Key Parameters
4.4.1 Sale Capacity
As presented in the life cycle cost–benefit analysis previously, the initial investment was so high that the payback period would be delayed to a certain extent. The total revenues of the project directly come from the excess renewable energy generation sold back to the main grid without considering the subsidies. Therefore, the sale capacity of the main grid would be a vital factor to the whole benefits of the project and to the payback periods. It is a common sense that the higher the sale capacity limits are set, the more revenues it will obtain. Taking scenario #2 as an example, from the sensitivity analysis results in Figure 10 it tells that a higher sale capacity limit is not always a better choice for shifting payback points to earlier years, this is mainly because high sale capacity limits stimulate more PV and WT investment but such revenues obtained from them could not satisfactorily cover the expensive initial investment cost. However, from the perspective of the overall project lifetime, the cost advantages of high sale capacity limits appear in the middle and late stages. If a quick payback period is not pursued, the higher sale capacity limits would be the better option.
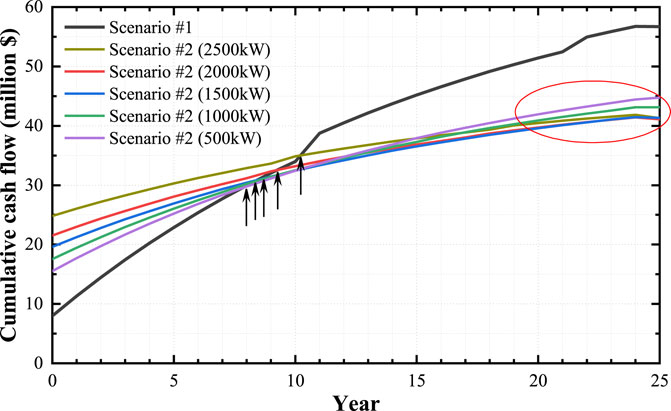
FIGURE 10. Cumulative cash flow of scenarios #1 and #2 with different sale capacity limits.
From the aforementioned results, the introduction of HES in scenario #4 cannot be regarded as a cost-competitive option, at least not at the early stage. It was conducted that the scenario with a high initial investment cost has no advantages in the early stage, but it will bring positive effects to the whole project at certain moments in the later stage. However, compared with scenario #3 in Figure 11, scenario #4 shows no cost advantage during the whole project lifetime under the high or low sale capacity limits, whether in the early or late stages. The initial investment cost is not the only key factor that affects the investment return period. Another key factor lies in determining whether the annual cash flow can be successfully reversed into a negative value (that is, the revenues exceed the expenses), which gives the whole cumulative cash flow curve a downward trend. If this premise cannot be met, no matter how long the project lifetime is, this investment will not be cost competitive.
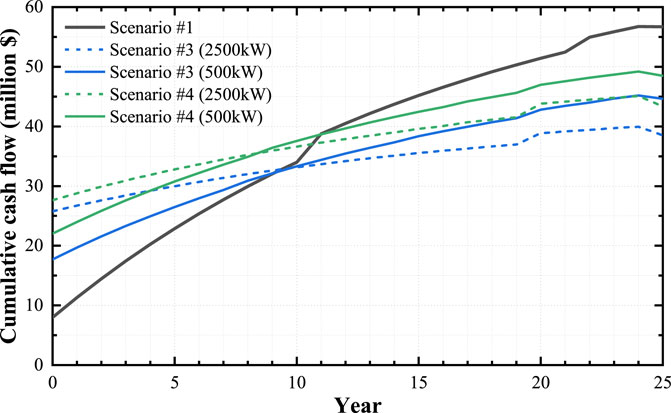
FIGURE 11. Cumulative cash flow of scenarios #3 and #4 with higher and lower sale capacity limits.
4.4.2 Carbon Tax
The higher carbon tax would stimulate more renewable energy source integration, and more renewables promote generating more decarbonized hydrogen, which may have a doubled positive effect on carbon reduction. The economy and the environmental benefits of scenarios #3 and #4 are depicted under different carbon taxes ($/ton) in Figure 12 and Figure 13. The results are not really as expected as assumed. In this case, hydrogen investment and high carbon tax guidance will not always show advantages in carbon reduction. It is seen that carbon emission under different carbon taxes without hydrogen investment in scenario #3 is approximately decreasing in a linear trend. Anyway, the trend of carbon emissions in scenario #4 is unstable. In the range of 30–50 $/ton of the low carbon tax, hydrogen integration can bring more environmental benefits to the whole project, but at the tax rate of 60$/ton, hydrogen investment made the carbon emission increase conversely. The same phenomenon happened at the tax prices of 90$/ton, 60$/ton, and 110$/ton. The cumulative cash flow shown in Figure 13 reveals that regardless of a high or low carbon tax price, the hydrogen investment in scenario #4 is not able to be a cost-competitive one. However, it is not easy to find the turning point of carbon tax prices that will clearly exhibit the superiority of hydrogen investment that supports its economical or environmental benefits. Thus, it makes hydrogen investment not a preferred option at present.
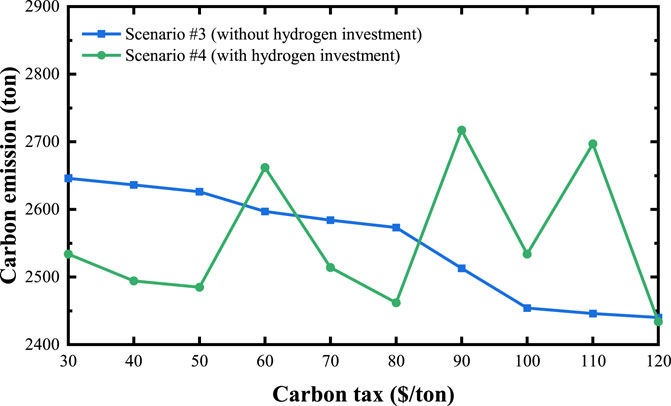
FIGURE 12. Carbon emission of scenarios #3 and #4 under different carbon taxes.

FIGURE 13. Cumulative cash flow of scenarios #3 and #4 with different carbon taxes.
4.4.3 Renewable Penetration Level
The aforementioned sale capacity and carbon tax sensitivity analysis have demonstrated that hydrogen integration into wind–photovoltaic–storage-integrated energy system is considered neither to be cost competitive nor always low carbon. In fact, it should not be ignored that power-to-hydrogen (P2H) could play a vital role in improving higher penetration of renewables and facilitating the transition to a deeply decarbonized energy system, apart from the deployment of a conventional battery energy storage, pumped hydro, and so forth (Larscheid et al., 2018). How could the hydrogen energy system give full play to its advantages in improving renewables accommodation and reducing carbon emissions? Can hydrogen actually replace the conventional storage options? In this section, the sensitivity analysis of hydrogen storage and conventional BESS comparison under different penetration level of renewables was performed. In the analysis, several groups of appropriate capacity of PV panels and WTs based on the previous optimal planning results are preset for different combinations of two different planning scenarios, and then, the optimization is performed with the limited search space of PV panel and WT capacity to learn how the optimal planning results would be under the hydrogen and BESS storages. Due to the system security and electric and heat load supply concerns, the CHP capacity was fixed in two scenarios, so the range of renewable penetration will be about 45–66%. It can be learned from Figure 14 that compared to the conventional BESS as the storage, hydrogen energy as a carrier of storage would reduce the renewable curtailment when renewable penetration increases. Meanwhile, the carbon emission in hydrogen energy–based planning scenario is lower than that with conventional BESS–based planning. Nevertheless, the total annualized cost of hydrogen energy storage planning still remains high, which may be the major obstacle to its large-scale promotion.
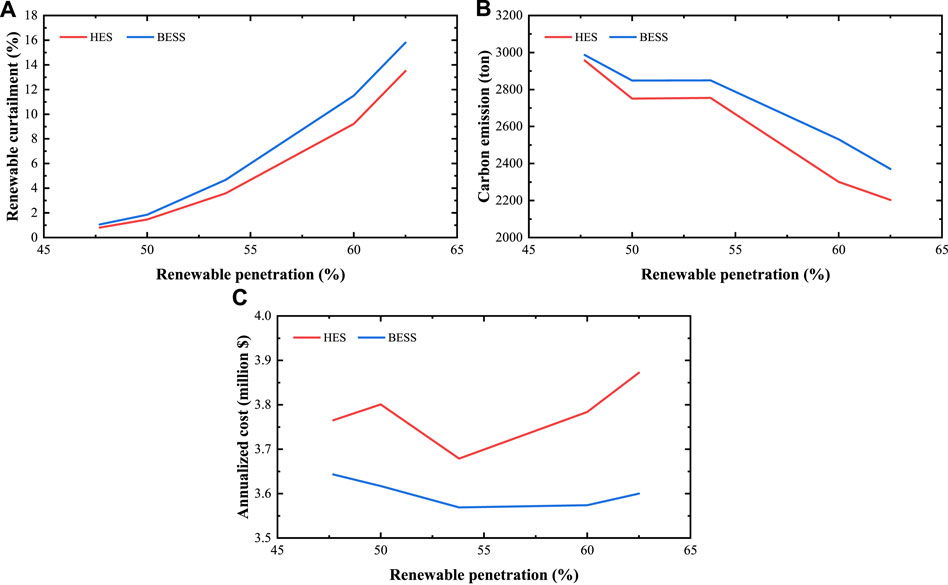
FIGURE 14. Renewable curtailment (A), carbon emission (B), and annualized total cost (C) of hydrogen storage and BESS planning scenarios with different renewable penetrations.
5 Conclusion
This article has developed a low-carbon strategic planning model of the wind–photovoltaic–hydrogen storage-integrated energy system, taking into account the investment, operation, and carbon emission costs. Cost–benefit analysis was conducted to compare the planning scenarios with different energy supply options from a life cycle perspective. Sensitivity analysis is carried out to demonstrate the impacts of sale capacity, carbon tax, and renewable energy penetration level to the optimal planning of the wind–photovoltaic–hydrogen storage-integrated energy system. The key findings are summarized as follows:
(1) Though more renewables integration fosters higher investment cost of the corresponding energy technologies in wind–photovoltaic–hydrogen storage-integrated energy system planning, the operation cost decomposition shows that the dependency on grid electricity purchase with a relatively high price is relieved and enables the whole economy to show superiority. Also, with more integration of renewables, the carbon emission eventually drops.
(2) Hydrogen integration can certainly reduce carbon emissions; the reduction results do not depend on hydrogen power generation itself but on hydrogen’s positive impact on promoting more renewable generation investment. That is to say, integrating hydrogen somehow stimulates more PV panel and WT investment so the carbon reduction is achieved.
(3) Sensitivity analysis reveals that, in wind–photovoltaic–hydrogen storage-integrated energy system planning, a high initial investment cost would certainly delay the final payback year, which holds expansive hydrogen integration from working its best to be cost competitive no matter what the sale capacity, carbon tax, or renewable energy penetration level. However, when considering hydrogen as a form of storage compared with the conventional BESS, it would show its superiority in renewable energy accommodation and carbon reduction with renewable penetration increasing.
Data Availability Statement
The original contributions presented in the study are included in the article/supplementary material, further inquiries can be directed to the corresponding author.
Author Contributions
YG: writing–original draft preparation and software. YX: conceptualization, supervision, and funding acquisition.
Funding
This work was supported by the National Natural Science Foundation of China (U2166211).
Conflict of Interest
The authors declare that the research was conducted in the absence of any commercial or financial relationships that could be construed as a potential conflict of interest.
Publisher’s Note
All claims expressed in this article are solely those of the authors and do not necessarily represent those of their affiliated organizations, or those of the publisher, the editors, and the reviewers. Any product that may be evaluated in this article, or claim that may be made by its manufacturer, is not guaranteed or endorsed by the publisher.
References
Glenk, G., and Reichelstein, S. (2019). Economics of Converting Renewable Power to Hydrogen. Nat. Energ. 4, 216–222. doi:10.1038/s41560-019-0326-1
Karmellos, M., and Mavrotas, G. (2019). Multi-Objective Optimization and Comparison Framework for the Design of Distributed Energy Systems. Energ. Convers. Manage. 180, 473–495. doi:10.1016/j.enconman.2018.10.083
Khalilpour, K. R., and Vassallo, A. (2016). A Generic Framework for Distributed Multi-Generation and Multi-Storage Energy Systems. Energy 114, 798–813. doi:10.1016/j.energy.2016.08.029
Larscheid, P., Lück, L., and Moser, A. (2018). Potential of New Business Models for Grid Integrated Water Electrolysis. Renew. Energ. 125, 599–608. doi:10.1016/j.renene.2018.02.074
Lin, H., Wu, Q., Chen, X., Yang, X., Guo, X., Lv, J., et al. (2021). Economic and Technological Feasibility of Using Power-To-Hydrogen Technology under Higher Wind Penetration in China. Renew. Energ. 173, 569–580. doi:10.1016/j.renene.2021.04.015
Liu, J., Tang, Z., Zeng, P. P., Li, Y., and Wu, Q. (2022). Distributed Adaptive Expansion Approach for Transmission and Distribution Networks Incorporating Source-Contingency-Load Uncertainties. Int. J. Electr. Power Energ. Syst. 136, 107711. doi:10.1016/j.ijepes.2021.107711
Liu, J., Zeng, P. P., Xing, H., Li, Y., and Wu, Q. (2020). Hierarchical Duality-Based Planning of Transmission Networks Coordinating Active Distribution Network Operation. Energy 213, 118488. doi:10.1016/j.energy.2020.118488
Ma, T., Wu, J., Hao, L., Lee, W.-J., Yan, H., and Li, D. (2018). The Optimal Structure Planning and Energy Management Strategies of Smart Multi Energy Systems. Energy 160, 122–141. doi:10.1016/j.energy.2018.06.198
Mudasser, M., Yiridoe, E. K., and Corscadden, K. (2015). Cost-Benefit Analysis of Grid-Connected Wind-Biogas Hybrid Energy Production, by Turbine Capacity and Site. Renew. Energ. 80, 573–582. doi:10.1016/j.renene.2015.02.055
Nazari, A., and Keypour, R. (2019). A Two-Stage Stochastic Model for Energy Storage Planning in a Microgrid Incorporating Bilateral Contracts and Demand Response Program. J. Energ. Stor 21, 281–294. doi:10.1016/j.est.2018.12.002
Rad, M. A. V., Ghasempour, R., Rahdan, P., and Mousavi, S. (2020). Techno-Economic Analysis of a Hybrid Power System Based on the Cost-Effective Hydrogen Production Method for Rural Electrification, a Case Study in Iran. Energy 190, 116421. doi:10.1016/j.energy.2019.116421
Ramli, M. A. M., Hiendro, A., and Twaha, S. (2015). Economic Analysis of PV/diesel Hybrid System with Flywheel Energy Storage. Renew. Energ. 78, 398–405. doi:10.1016/j.renene.2015.01.026
Wang, Y., Li, R., Dong, H., Ma, Y., Yang, J., Zhang, F., et al. (2019). Capacity Planning and Optimization of Business Park-Level Integrated Energy System Based on Investment Constraints. Energy 189, 116345. doi:10.1016/j.energy.2019.116345
Wang, Y., Wang, Y., Huang, Y., Yu, H., Du, R., Zhang, F., et al. (2019). Optimal Scheduling of the Regional Integrated Energy System Considering Economy and Environment. IEEE Trans. Sustain. Energ. 10, 1939–1949. doi:10.1109/tste.2018.2876498
Weber, C., and Shah, N. (2011). Optimisation Based Design of a District Energy System for an Eco-Town in the United Kingdom. Energy 36, 1292–1308. doi:10.1016/j.energy.2010.11.014
Xiang, Y., Cai, H., Gu, C., and Shen, X. (2020). Cost-Benefit Analysis of Integrated Energy System Planning Considering Demand Response. Energy 192, 116632. doi:10.1016/j.energy.2019.116632
Xiang, Y., Cai, H., Liu, J., and Zhang, X. (2021). Techno-Economic Design of Energy Systems for Airport Electrification: A Hydrogen-Solar-Storage Integrated Microgrid Solution. Appl. Energ. 283, 116374. doi:10.1016/j.apenergy.2020.116374
Yang, Y., Zhang, S., and Xiao, Y. (2015). An MILP (Mixed Integer Linear Programming) Model for Optimal Design of District-Scale Distributed Energy Resource Systems. Energy 90, 1901–1915. doi:10.1016/j.energy.2015.07.013
Yu, X. D., Xu, X. D., Chen, S. I., Wu, J., and Jia, H. (2016). A Brief Review to Integrated Energy System and Energy Internet. Trans. China Electrotech Soc. 31 (1), 1–13. doi:10.19595/j.cnki.1000-6753.tces.2016.01.002
Zeng, B., Hu, Q., Liu, Y., Liu, W. X., et al. (2020). Dynamic Probabilistic Energy Flow Calculation for Interconnected Electricity-gas System Considering Complex Uncertainties of Demand Response. Proc. of the CSEE 40 (4), 1161–1171+1408. doi:10.13334/j.0258-8013.pcsee.181903
Zhang, Y., Campana, P. E., Lundblad, A., Zheng, W., and Yan, J. (2019). Planning and Operation of an Integrated Energy System in a Swedish Building. Energ. Convers. Manage. 199, 111920. doi:10.1016/j.enconman.2019.111920
Zhao, G., Nielsen, E. R., Troncoso, E., Hyde, K., Romeo, J. S., and Diderich, M. (2019). Life Cycle Cost Analysis: A Case Study of Hydrogen Energy Application on the Orkney Islands. Int. J. Hydrogen Energ. 44 (19), 9517–9528. doi:10.1016/j.ijhydene.2018.08.015
Keywords: integrated energy system, wind–photovoltaic–hydrogen storage, optimal planning, cost–benefit analysis, sensitivity analysis
Citation: Guo Y and Xiang Y (2022) Low-Carbon Strategic Planning of Integrated Energy Systems. Front. Energy Res. 10:858119. doi: 10.3389/fenrg.2022.858119
Received: 19 January 2022; Accepted: 14 February 2022;
Published: 10 March 2022.
Edited by:
Shenxi Zhang, Shanghai Jiao Tong University, ChinaReviewed by:
Jia Liu, Hangzhou Dianzi University, ChinaFeifei Bai, The University of Queensland, Australia
Copyright © 2022 Guo and Xiang. This is an open-access article distributed under the terms of the Creative Commons Attribution License (CC BY). The use, distribution or reproduction in other forums is permitted, provided the original author(s) and the copyright owner(s) are credited and that the original publication in this journal is cited, in accordance with accepted academic practice. No use, distribution or reproduction is permitted which does not comply with these terms.
*Correspondence: Yue Xiang, eGlhbmdAc2N1LmVkdS5jbg==