 Chaoyong Zhu1
 Bo Chen
- 1State Grid Yingda International Holdings Co.,LTD, Beijing, China
- 2State Grid Yingda Carbon Asset Management (ShangHai) LTD., Shanghai, China
- 3Central University of Finance and Economics, Beijing, China
Local governments are the main actors in achieving carbon peaking and carbon neutrality goals. The existing carbon management system is mainly for the country, industry or enterprise, and there is no carbon management design method for local governments. Therefore, from the perspective of local governments, a regional carbon management approach based on carbon-electricity intensity and carbon efficiency is proposed. First, based on electricity consumption data, combined with regional industry energy statistics, a carbon-electricity intensity indicator is established to estimate the carbon emissions of enterprises, and then different carbon emission reduction strategies are constructed using carbon efficiency indicator. This study proposes two types of emission reduction strategies, marginal opt-out and collective action, and conducts scenario simulation analysis using a case study from a city in southeastern China. The baseline scenario shows that although the marginal opt-out strategy has the lowest economic cost, the emission reduction rate is also lower, while the collective action strategy can achieve the emission reduction target faster, but only at a higher economic cost. This approach is suitable for the construction of the initial carbon management system in areas dominated by electricity consumption, taking into account the two dimensions of economy and environment, and can be applied to various decision-making scenarios, which is beneficial for local governments to quickly start the carbon management system.
Introduction
Since the signing of the Paris Agreement, with the further deterioration of the climate issue, major global emitters, including China, are actively building national-level carbon emission management systems. In September 2020, the Chinese government announced that it would take strong policies and measures, and strive to peak CO2 emissions by 2030 and achieve carbon neutrality by 2060 (Zhou and Hu, 2021). In July 2021, China’s carbon trading market was officially launched, including 2,162 key emission units in the power generation industry, covering an annual greenhouse gas emission of about 4.5 billion tons of carbon dioxide, making it the world’s largest carbon market. The implementation of carbon neutrality goals and carbon trading markets has brought enormous opportunities and challenges to the transformation of the energy system (Xie, et al., 2021), and also brought many uncertainties to the development of local economies. Local governments urgently need to build effective carbon management systems.
Carbon management is a broad-based method toward reducing climate change by the reduction of carbon emissions into the atmosphere, which have scientifically been proven to contribute to the process of global warming. China’s carbon emissions are closely related to the level of economic development (Ahmad, et al., 2020). Due to the regional heterogeneity caused by the existence of the EKC law (Ahmad, et al., 2019), it is necessary for local governments to establish a localized carbon management system to tackle the climate crisis. However, the influencing factors of carbon emissions in China are very complex, such as energy structure (Yan Li et al., 2021), forest area (Chandio et al., 2020), trade opening (Menghan Li et al., 2021), digital technology (Wang et al., 2021), health expenditure (Ahmad, et al., 2021) et al. These factors pose a huge challenge for local governments to establish a regional carbon management system. There are few studies on the carbon management system of SMEs, and the existing experience is about large-scale and small-scale emission reduction projects, such as programmatic CDM (Hinostroza, et al., 2007; Michaelowa and Sippel, 2022). Existing carbon management tools are mainly applied in national, industrial and enterprise level (Tang and Tang, 2019; Mahmoudian, et al., 2021). PAS 2050, ISO 14064, ISO 14067 and other product and organizational level carbon management standards are very mature, and some scholars have also proposed certain industry-oriented carbon management tools (Zhang et al., 2020; Bareha et al., 2021). However, the existing carbon management approaches have many limitations for local governments. On the one hand, the carbon management tools at the national and industry levels are relatively granular, which makes it difficult to reflect the heterogeneity between localities. For example, China’s power grid baseline emission factors are only updated according to seven regions, and cannot distinguish between cities or counties. On the other hand, carbon management at the organizational level requires the collection of detailed process data, which is costly and inefficient for large-scale application. The common defect of the above two methods is that the carbon emission data update cycle is long with a hysteresis.
Local governments are the key implementers of carbon peaking and carbon neutrality strategies, but they are faced with complex carbon management needs. First of all, the average annual emission of enterprises in the first batch of national carbon trading markets in China is about 2.08 million t/CO2. Although the emission entities to be managed by local governments are very important for local economic development, they are difficult to meet the entry requirements of the carbon trading market in terms of emission quantity. This means that a large number of companies are not yet able to apply market mechanisms for carbon management, hence a localized carbon management instrument is needed. Secondly, a lot of local small and medium-sized emission entities are scattered in different industries, with unclear business boundaries and uncertain operating conditions, which make it difficult to collect data and report their carbon emissions in a short period of time. Thus, a more efficient and flexible carbon management system needs to be developed. Thirdly, the agenda for carbon emission reduction of local governments is extremely urgent, and it is necessary to initiate carbon management system as soon as possible. Meanwhile, when designing local carbon management strategies, they are confronted with numerous tradeoffs, such as the balance between economic development and carbon emission reduction, data quality and efficiency (Campbell-Árvai et al., 2019), therefore a learning-by-doing strategy should be used to develop a local carbon management system.
This report proposes a regional carbon management tool based on carbon-electricity intensity (CEI) and carbon efficiency (CEF) analysis from the perspective of local governments. Specifically, a carbon-electricity intensity indicator is established based on electricity consumption data combined with regional industry energy statistics to estimate enterprise carbon emissions, and then different carbon emission reduction strategies are constructed using the carbon efficiency indicator. Moreover, this report compares the performance of different strategies using a case study in a city in southeastern China. The marginal contributions of this study are: Firstly, to the best of our knowledge, this is the first report on carbon management issues from a local government perspective. Current research on regional carbon management generally focuses on specific industries or sectors, and lacks research from the angle of local governments; secondly, the proposed carbon-electricity intensity index comprehensively considers the quality and efficiency of carbon emission data of enterprises, which is conducive to the rapid start of the carbon management system by local governments; finally, the carbon management strategy formed based on carbon efficiency takes into account the two dimensions of economy and environment, which can be applied to various decision-making scenarios. The results of this study are especially suitable for the construction of the initial carbon management system in electricity consumption-led regions, and have good reproducibility and application potential.
Methods
This study takes a district of a city in the southeast coast of China as the research subject (referred to as Region A). The industrial structure of Region A is relatively complex and scattered, among which there are 72 key emission enterprises, which are distributed in agricultural product processing, rubber and plastic products, electrical machinery and equipment manufacturing, ICT manufacturing, non-ferrous metal processing, chemical manufacturing, metal and other sectors. These companies make important contributions to local economic development, but because of their small emissions, they are unlikely to be included in the carbon trading market in the short term. This report refers to such enterprises as “Non-trading entities (NTEs)”. The energy structure of NTE is dominated by electricity (for example, accounting for more than 80%), and other auxiliary energy sources include coal, diesel, gasoline, natural gas, etc. A comprehensive carbon emission monitoring and reporting system has not been established locally. In addition to the relatively reliable power data, other energy data are statistically missing or inaccurate, making it impossible to compile a detailed enterprise-level GHG inventory. However, the government of Region A is facing political pressure to achieve carbon peaking and carbon neutrality, and hope to formulate a carbon management system that takes into account both economic and environmental goals as soon as possible, including carbon emission measurement and reporting, carbon emission reduction goals and strategy setting, etc. This is also a typical demand faced by many local governments. This study translates the above carbon management issues into the following hypotheses:
For Non-trading entities (NTEs), local governments need to establish an effective carbon management system under the premise of considering cost constraints, including three sub-goals: measuring and reporting corporate carbon emissions; determining emission reduction targets; and formulating emission reduction strategies.
Aiming at the above three sub-goals, this report proposes four models to build a local government carbon management system: a carbon-electricity intensity model, a carbon emission calculation model, a carbon efficiency model, and a total emission reduction rate model. The specific steps are as follows (see Figure 1):
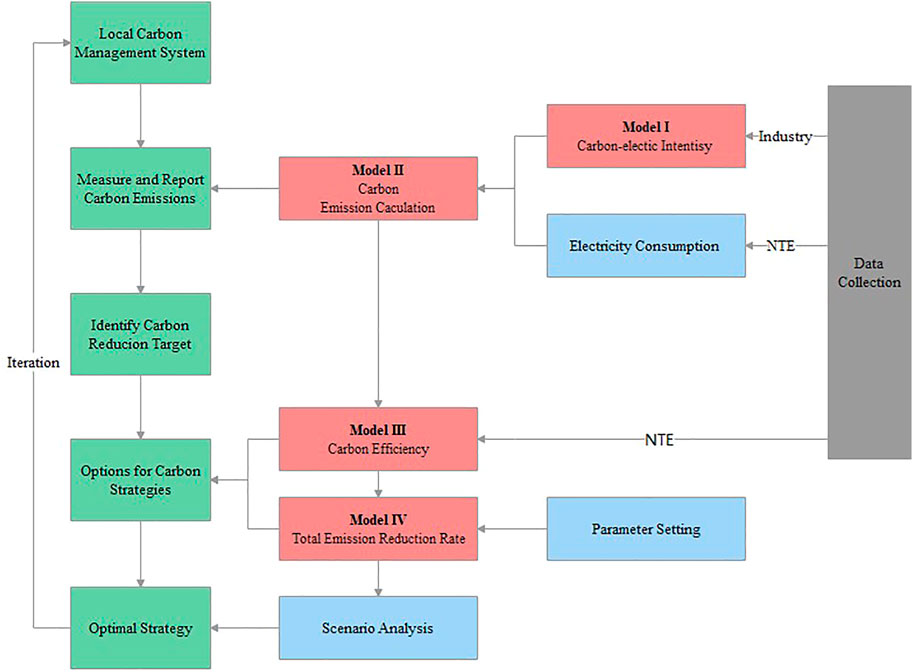
FIGURE 1. The process of establishing a regional carbon management system.
S1. Collect basic data: Collect the statistical data of carbon emissions in Region A, and obtain two types of data: the first type is the annual energy consumption statistics by industry; the second type is the electricity consumption data and operation data of NTEs, and other energy consumption data has missing and inaccurate issues.
S2. Calculation of carbon emissions: Assuming that the energy consumption structure of NTEs is relatively stable, calculate the annual carbon-electricity intensity (CEI) of the industry according to Model I, and then use CEI and annual electricity consumption data to calculate the annual carbon emissions of NTEs according to Model II.
S3. Calculate carbon efficiency: Calculate the carbon efficiency of NTEs according to Model III, and then sort from low to high.
S4. Baseline scenario analysis: policymakers use the marginal method to gradually remove NTEs with the lowest carbon efficiency from the market, calculate the averaged carbon reduction cost after each action, and use Model IV to calculate the corresponding total emission reduction rate to form an emission reduction strategy curve (averaged carbon reduction cost vs. total reduction rate).
S5. Collective action scenario analysis: All NTEs bear the responsibility for emission reduction, but NTEs with high carbon efficiency have relatively small emission reduction targets. For simplicity, a proportional decline method is used to set emission reduction targets. Referring to step S4, recalculate the averaged carbon reduction cost and the total emission reduction rate to form a new emission reduction strategy curve.
S6. Compare the above two carbon emission reduction strategies and determine the optimal carbon management strategy. If not satisfied, go back to S5 to adjust the emission reduction targets for optimization.
Model I- Carbon-Electricity Intensity
This report proposes a carbon-electricity intensity model to indirectly estimate carbon emissions from NTEs. According to the “Guidelines for Compilation of Provincial Greenhouse Gas Inventories” issued by the Chinese government in 2010, the emission factor method is used to calculate carbon emissions, in which activity data includes electricity and other energy consumption of enterprises, and the emission factors are officially released. Assuming that the energy consumption of an enterprise is dominated by electricity and supplemented by other energy sources, without major process improvements, the proportion of electricity consumption in the energy consumption structure remains stable and can be set to
To further define the CEI:
It can be seen that CEI can be regarded as a stable indicator when the energy consumption structure is stable. This indicator can be used to measure the heterogeneity of carbon emissions between different industries. Since many small and medium-sized enterprises lack the option of voluntary emission reduction, they generally achieve emission reduction by optimizing the energy structure of the region, such as increasing the proportion of clean energy. CEI can describe the above changes concisely and is easy to calculate.
Model II-Carbon Emission Calculation
Carbon electricity intensity is used to estimate a company’s carbon emissions. The specific method is as follows: First, obtain regional A 2015–2019 energy data (including natural gas, gasoline, diesel, fuel oil, liquefied petroleum gas, electricity consumption, heat consumption, etc.) by industry by collecting statistical yearbooks. Calculate the annual emissions of each industry according to the relevant energy carbon emission factors, and then obtain the CEI of the industry over the years. A linear regression model is then built to predict the carbon electricity intensity of the industry for the next year (2020). According to the electricity consumption of the enterprise, the annual carbon emission of a certain enterprise in that year can be calculated. The calculation process is as follows:
Where,
Model III- Carbon Efficiency
Due to technical differences, differences in management capabilities, differences in business scale and other reasons, there is heterogeneity in the carbon emission reduction costs of enterprises (Kılıç and Kuzey, 2019; Nasih et al., 2019). In theory, the marginal emission reduction cost curve should be used to determine the priority of emission reduction. However, it is difficult to obtain data related to marginal emission reduction costs at the enterprise level, and it is not feasible in terms of cost. Therefore, this report uses carbon efficiency to measure and prioritize the carbon emissions performance of NTEs. The carbon efficiency indicators for individual companies are defined as follows:
Here,
Further, it is assumed that the rational choice of the local government is to continuously clear the output value with the lowest marginal carbon efficiency, that is, those enterprises with low output value per unit of carbon emission. With the continuous implementation of opt-out actions, the averaged carbon reduction cost of the accumulated liquidation value can be calculated:
Where, m is the quantity of NTEs opt-out.
Model IV - Total Emission Reduction Rate
Assuming that there are N companies in total, rank the companies according to carbon efficiency from low to high. The carbon efficiency of the ith enterprise is
The combination of Averaged carbon removal cost
Results
Take the 72 companies in Region A as the scope of carbon management. The total output value is 8,030.26 million yuan, the average output value is 111.53 million yuan (minimum = 120,000 yuan, maximum = 1,997.81 million yuan). CEI was calculated using Model I with a maximum value of 0.839, a minimum value of 0.7034, and an average value of 0.707. The narrow fluctuation range of CEI is due to the fact that the main emission source of these enterprises is electricity, and the proportion of other energy consumption is relatively low. Then, Model II was used to calculate the carbon emission of the enterprise. The total emission was 209,773 tons of CO2, and the average carbon emission was 2,913.5 tons of CO2 (minimum = 7 tons of CO2, maximum = 45,405 tons of CO2). In terms of carbon emissions, these companies are small and medium-sized emission entities and are unlikely to be included in the carbon trading market.
CEF was calculated using Model III, the average carbon efficiency was 123.07 yuan/tonCO2(minimum = 8.51 yuan/tonCO2, maximum = 382.81 yuan/tonCO2). Figure 2 shows the distribution of CEFs sorted from low to high, and it can be seen that the carbon efficiency has a nonlinear increase trend. Figure 3 shows the relationship between CEF and emission reduction potential, where the horizontal axis represents emission reduction potential, and the vertical axis represents carbon efficiency. The emission reduction potential is assumed to be carbon neutral, i.e. equivalent to corporate emissions. The blue line is the reference line that policymakers can adjust to assess the economic cost of setting different emission reduction targets. For example, when the reference line is at 150 yuan/ton of CO2, the cumulative emission reduction below the blue line is 76,195 tons, which means that if the emission reduction of 76,195 tons is to be achieved, the economic cost to be paid is 11.42925 million yuan.
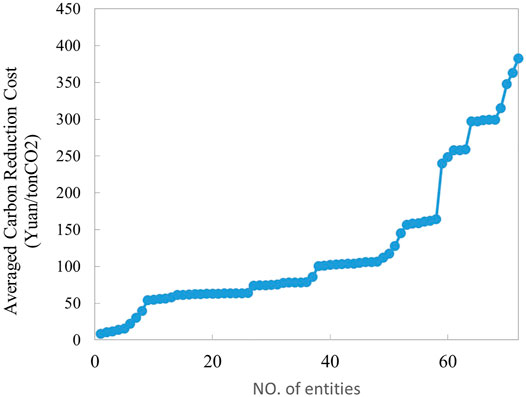
FIGURE 2. Averaged carbon reduction cost. Data source: Local Statistical Yearbook and Bureau of Statistics.
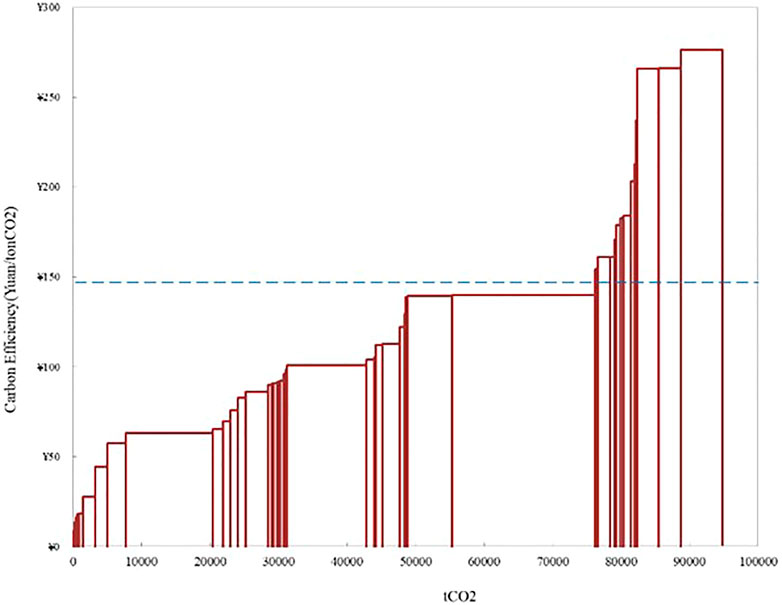
FIGURE 3. Relationship between emission reduction potential and CEI. Data source: Local Statistical Yearbook and Bureau of Statistics.
Model IV is further adopted to construct different emission reduction strategies. We define three emission reduction scenarios:
1) Baseline Scenario: adopt the marginal opt-out strategy, that is, continuously eliminate the production capacity with lower carbon efficiency, for example, force the enterprises with the lowest carbon efficiency to withdraw from the market by shutting down.
2) Collective Action Scenario (CAS-1 & CAS-2): Different from the baseline scenario, all companies need to set emission reduction targets, but in order to encourage carbon-efficient companies, the emission reduction targets are linked to carbon efficiency. The higher the carbon efficiency, the lower the corresponding emission reduction target, thus incentivizing more carbon-efficient companies. In order to simplify, this study adopts the proportional scheme, that is, the corporate emission reduction coefficient
Figure 4 shows trends for the three emission reduction scenarios. It demonstrates that the baseline scenario is the most conservative emission reduction strategy, but it is also the cheapest economically, and can maximize the incentives for enterprises with high carbon efficiency. Under scenarios CAS-1 and CAS-2, all companies are required to undertake emission reduction targets, but CAS-1 is more moderate and CAS-2 is more severe. Judging from the slope of the curve, the greater the carbon-efficiency company’s responsibility for emission reduction, the better the overall emission reduction efficiency, but the higher the economic cost.
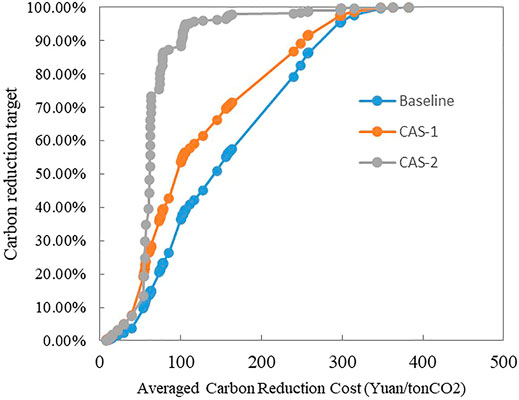
FIGURE 4. Relationship between total emission reduction rate and averaged carbon reduction cost. Data source: Local Statistical Yearbook and Bureau of Statistics.
Discussion
This study proposes a carbon management design scheme for small and medium-sized emission entities by constructing carbon-electricity intensity and carbon efficiency indicators, which has strong application potential for local governments to quickly establish regional carbon management systems. Existing studies often focus on carbon emission management at the national, provincial and other large-scale levels, or corporate management at the micro-level, while the method proposed in this study is applicable to medium-scale regional carbon management, filling the gaps in existing research. Compiling corporate GHG inventories using traditional methods is often costly, inefficient, and updated infrequently. The CEI indicator proposed in this report is a low-cost solution that combines microscopic electricity consumption data and macroscopic statistical data to more accurately estimate the carbon emissions of electricity-driven enterprises. This approach can be further developed to establish a real-time carbon emission analysis system using power data, and provides a good foundation for the further application of digital technologies such as big data and artificial intelligence. In practical applications, combined with traditional greenhouse gas inventory data, the accuracy of regional carbon emission analysis and prediction can be further improved.
Unlike most existing carbon management studies that emphasize the performance of environmental benefits, this study recognizes that economic rationality is still the primary principle of local government decision-making, and comprehensively considers the two dimensions of environmental efficiency and economic efficiency as the core indicator of carbon management. As the main executors of emission reduction targets, local governments tend to make decisions based on economic rationality. The economic cost of emission reduction is the most critical decision-making basis. Traditional methods to measure the economic efficiency of corporate carbon emissions generally use carbon intensity, emphasizing the environmental cost of economic activities, while CEF pays attention to the economic value of environmental resources. Although the above two are paired, the latter is more conducive to the design of economic decision-making tools. Therefore, this study uses carbon efficiency rather than carbon intensity for the analysis of emission reduction strategies. The distribution of averaged carbon reduction cost shows a nonlinear upward trend, and the growth rate is getting faster and faster, which shows that with the increase of carbon emission reduction, the average cost is also rising nonlinearly, which is in line with common sense. The relationship between emission reduction potential and averaged carbon reduction cost has intuitive decision-making value for setting emission reduction targets.
Furthermore, this study proposes two types of emission reduction strategies, marginal opt-out and collective action, and conducts scenario simulation analysis. In the early stage of emission reduction, the emission reduction effects of different strategies are almost the same, but as the emission reduction target increases, the difference between the two strategies is rapidly magnified. The baseline scenario shows that although the marginal opt-out strategy has the lowest economic cost, the emission reduction rate is also lower, while the collective action strategy can achieve the emission reduction target faster, but only at a higher economic cost. On the one hand, this evidence proves that in the absence of significant technological progress, there is indeed a contradiction that is difficult to reconcile between emission reduction and economic development. For electricity-dependent enterprises, the most effective way is to optimize the regional power supply structure or increase the use of electricity. On the other hand, it also provides an effective scenario analysis tool for local governments to choose the optimal emission reduction strategy. For example, policymakers can control the emission reduction rate by adjusting the distribution of emission reduction coefficients every year. Scenario analysis can also be used to support local governments in formulating climate fiscal policies, such as compensating for shocks to small and medium-sized enterprises, or incentivizing carbon-efficient businesses, based on estimates of financial subsidy funds that can be estimated through economic cost analysis. The effectiveness of the marginal opt-out strategy explains the rationality of the Chinese government’s long-standing policy of eliminating outdated production capacity, which has not been adequately valued in previous studies. The collective action strategy provides a benchmark template for developing more complex carbon management strategies.
This study provides an effective tool for jump-starting the development of a regional carbon management system. The limitation of the study is that the CEI model is more suitable for electricity-dominated industries, while for industries with more complex emission activities, the CEI calculation may have larger errors. For such enterprises, it is still necessary to collect their detailed energy data, or conduct data uncertainty analysis and add it to the model. The government’s tolerance for accuracy is also an important factor. For the initial carbon management system, we suggest that errors of 10% or higher are permissible, and a certain amount of redundancy can be given when setting goals. Due to the limitation of sample data, this study did not further conduct scenario simulations by industry, and the emission reduction strategy did not distinguish the heterogeneity of industries. If a large amount of relevant data of enterprises can be obtained, it is possible to conduct more accurate scenario analysis and enrich emission reduction strategies.
Conclusion
This study proposes a carbon management system design scheme based on carbon-electricity intensity and carbon efficiency, which has reference value for local governments to quickly establish carbon management capabilities in their regions. The proposed marginal opt-out and collective action strategies can be flexibly set according to local government preferences, leading to the development of more complex and diverse carbon reduction strategies (Yunus et al., 2020).
Data Availability Statement
The raw data supporting the conclusions of this article will be made available by the authors, without undue reservation.
Author Contributions
ZC and GP are responsible for the writing of the research paper, ZY is responsible for the research and data analysis, and CB is responsible for the model design.
Funding
This research is funded by Science and Technology Foundation of SGCC (SGYD0000HLJS2100179).
Conflict of Interest
Authors ZC and GP were employed by State Grid Yingda International Holdings Co.,LTD. ZY was employed by State Grid Yingda Carbon Asset Management (ShangHai) LTD.
The remaining author declares that the research was conducted in the absence of any commercial or financial relationships that could be construed as a potential conflict of interest.
Publisher’s Note
All claims expressed in this article are solely those of the authors and do not necessarily represent those of their affiliated organizations, or those of the publisher, the editors, and the reviewers. Any product that may be evaluated in this article, or claim that may be made by its manufacturer, is not guaranteed or endorsed by the publisher.
References
Ahmad, M., Zhao, Z.-Y., Irfan, M., and Mukeshimana, M. C. (2019). Empirics on Influencing Mechanisms Among Energy, Finance, Trade, Environment, and Economic Growth: a Heterogeneous Dynamic Panel Data Analysis of China. Environ. Sci. Pollut. Res. 26 (14), 14148–14170. doi:10.1007/s11356-019-04673-6
Ahmad, M., Jabeen, G., Hayat, M. K., Khan, R. E. A., and Qamar, S. (2020). Revealing Heterogeneous Causal Links Among Financial Development, Construction Industry, Energy Use, and Environmental Quality across Development Levels. Environ. Sci. Pollut. Res. 27 (5), 4976–4996. doi:10.1007/s11356-019-07299-w
Ahmad, M., Akram, W., Ikram, M., Shah, A. A., Rehman, A., Chandio, A. A., et al. (2021). Estimating Dynamic Interactive Linkages Among Urban Agglomeration, Economic Performance, Carbon Emissions, and Health Expenditures across Developmental Disparities. Sustainable Prod. Consumption 26, 239–255. doi:10.1016/j.spc.2020.10.006
Bareha, Y., Affes, R., Moinard, V., Buffet, J., and Girault, R. (2021). A Simple Mass Balance Tool to Predict Carbon and Nitrogen Fluxes in Anaerobic Digestion Systems. Waste Manag. 135, 47–59. doi:10.1016/j.wasman.2021.08.020
Campbell-Árvai, V., Bessette, D., Kenney, L., and Árvai, J. (2019). Improving Decision Making for Carbon Management Initiatives. Int. J. Risk Assess. Manag. 22 (3-4), 342–358. doi:10.1504/ijram.2019.103338
Chandio, A. A., Akram, W., Ahmad, F., and Ahmad, M. (2020). Dynamic Relationship Among Agriculture-Energy-Forestry and Carbon Dioxide (CO2) Emissions: Empirical Evidence from China. Environ. Sci. Pollut. Res. 27 (27), 34078–34089. doi:10.1007/s11356-020-09560-z
Hinostroza, M., Cheng, C. C., Zhu, X., Fenhann, J., Figueres, C., and Avendano, F. (2007). Potentials and Barriers for End-Use Energy Efficiency under Programmatic CDM.
Kılıç, M., and Kuzey, C. (2019). The Effect of Corporate Governance on Carbon Emission Disclosures: Evidence from Turkey. Int. J. Clim. Change Strateg. Manag. 11, 35–53. doi:10.1108/ijccsm-07-2017-0144
Mahmoudian, F., Lu, J., Yu, D., Nazari, J. A., and Herremans, I. M. (2021). Inter-and Intra-organizational Stakeholder Arrangements in Carbon Management Accounting. Br. Account. Rev. 53 (1), 100933. doi:10.1016/j.bar.2020.100933
Menghan Li, M., Ahmad, M., Fareed, Z., Hassan, T., and Kirikkaleli, D. (2021). Role of Trade Openness, export Diversification, and Renewable Electricity Output in Realizing Carbon Neutrality Dream of China. J. Environ. Manage. 297, 113419. doi:10.1016/j.jenvman.2021.113419
Michaelowa, A., and Sippel, M. (2022). “How Can Global Carbon Markets Promote Low-Carbon Cities in Developing Countries? Lessons Learnt from the Clean Development Mechanism,” in Planning Climate Smart and Wise Cities (Cham: Springer), 291–315. doi:10.1007/978-3-030-80165-6_8
Nasih, M., Harymawan, I., Paramitasari, Y. I., and Handayani, A. (2019). Carbon Emissions, Firm Size, and Corporate Governance Structure: Evidence from the Mining and Agricultural Industries in Indonesia. Sustainability 11 (9), 2483. doi:10.3390/su11092483
Tang, Q., and Tang, L. M. (2019). Toward a Distributed Carbon Ledger for Carbon Emissions Trading and Accounting for Corporate Carbon Management. J. Emerging Tech. Account. 16 (1), 37–46. doi:10.2308/jeta-52409
Wang, J., Wang, W., Ran, Q., Irfan, M., Ren, S., Yang, X., et al. (2021). Analysis of the Mechanism of the Impact of Internet Development on green Economic Growth: Evidence from 269 Prefecture Cities in China. Environ. Sci. Pollut. Res. 29, 1–15. doi:10.1007/s11356-021-16381-1
Xie, L., Singh, C., Mitter, S. K., Dahleh, M. A., and Oren, S. S. (2021). Toward Carbon-Neutral Electricity and Mobility: Is the Grid Infrastructure Ready. Joule 5 (8), 1908–1913. doi:10.1016/j.joule.2021.06.011
Yan Li, Y., Yang, X., Ran, Q., Wu, H., Irfan, M., and Ahmad, M. (2021). Energy Structure, Digital Economy, and Carbon Emissions: Evidence from China. Environ. Sci. Pollut. Res. 28 (45), 64606–64629. doi:10.1007/s11356-021-15304-4
Yunus, S., Elijido-Ten, E. O., and Abhayawansa, S. (2020). Impact of Stakeholder Pressure on the Adoption of Carbon Management Strategies: Evidence from Australia. Sustainability Account. Manag. Pol. J. 11, 1189–1212. doi:10.1108/sampj-04-2019-0135
Zhang, C., Song, K., Wang, H., and Randhir, T. O. (2020). Carbon Budget Management in the Civil Aviation Industry Using an Interactive Control Perspective. Int. J. Sust. Transportation 15 (1), 30–39. doi:10.1080/15568318.2019.1679923
Keywords: carbon management, local government, electricity, strategy, climate change
Citation: Zhu C, Gao P, Zhang Y and Chen B (2022) An Approach to Quickly Establish Regional Carbon Management System. Front. Energy Res. 10:857136. doi: 10.3389/fenrg.2022.857136
Received: 18 January 2022; Accepted: 16 February 2022;
Published: 10 March 2022.
Edited by:
Shiwei Yu, China University of Geosciences Wuhan, ChinaReviewed by:
Munir Ahmad, Zhejiang University, ChinaLongxi Li, China University of Geosciences Wuhan, China
Copyright © 2022 Zhu, Gao, Zhang and Chen. This is an open-access article distributed under the terms of the Creative Commons Attribution License (CC BY). The use, distribution or reproduction in other forums is permitted, provided the original author(s) and the copyright owner(s) are credited and that the original publication in this journal is cited, in accordance with accepted academic practice. No use, distribution or reproduction is permitted which does not comply with these terms.
*Correspondence: Bo Chen, YmNoZW5AY3VmZS5lZHUuY24=