
95% of researchers rate our articles as excellent or good
Learn more about the work of our research integrity team to safeguard the quality of each article we publish.
Find out more
ORIGINAL RESEARCH article
Front. Energy Res. , 14 April 2022
Sec. Advanced Clean Fuel Technologies
Volume 10 - 2022 | https://doi.org/10.3389/fenrg.2022.857077
This article is part of the Research Topic Advanced Technologies in Flow Dynamics and Combustion in Propulsion and Power View all 25 articles
Peak combustion pressures (PCP) are increased in heavy-duty diesel engines to obtain higher thermal efficiency. Fuel injection strategy has been a major measure to improve the combustion and emissions of diesel engines. But most existing work of multi-injection strategies was not limited by PCP or was conducted under lower PCP (∼15 MPa). In this study, an experimental study is conducted to further improve the understanding of injection strategies on engine performance under a relative higher peak combustion pressure at 20 MPa. The four tested injection strategies are single main injection, pilot-main injection, main-post injection, and pilot-main-post injection. The effects of PCP on brake thermal efficiency (BTE) and other engine performances are also investigated under the same NOx emissions conditions. Results indicate that more advanced injection timing can obtain higher BTE, while the injection pressure has less effects on BTE as it is higher than 120 MPa. For double-injection, the smaller interval on pilot-main or main-post and the less pilot or post mass improves BTE and emissions. The PCPs are linearly correlated to the BTE, peak average temperature, and peak pressure rise rate (PRR), and the increment of BTE, peak average temperature, and peak PRR are about 0.3%, 30 K, and 0.1 MPa/CA for every 1 MPa increase in PCP, respectively. This also means that the improvement on BTE by the increase of PCP imparts greater thermal and mechanical loads on engine materials and components. At 20 MPa PCP, based on the optimized injection strategies, the BTE of all four strategies is about 42.8%, and the peak PRR of all four strategies is about 0.8 MPa/CA. At a given NOx emission of 17.4 g/kWh and approximate 20 MPa PCP, all four injection strategies have minor effects on distribution of fuel energy and emissions. Therefore, it can be concluded that the injection strategies have fewer effects on BTE and emissions at the higher peak combustion pressure of 20 MPa; the main purpose of injection strategies is to reduce the peak PRR or reach the potentially required temperature for aftertreatment devices.
Major global markets have greenhouse gas (GHG) and criteria pollutant regulations in place (Jin et al., 2021). Because of stricter regulations for heavy-duty (HD) commercial vehicles, the first European HD GHG targets will require a fleet averaged reduction in CO2 of 30% by 2030 as compared to a 2019 baseline (Joshi, 2021). In the meantime, the discussions have already started in Europe on the next level of regulations beyond Euro 6 emissions (Joshi, 2019). Since the internal combustion engine will continue to be the predominant drive source for heavy long-distance transport in the foreseeable future, increasing the engine efficiency and reducing exhaust emissions will make a significant contribution to achieving the above targets (Horvath et al., 2020).
Fuel injection strategy has been a major measure to improve the performance and emissions of diesel engines (Mohan et al., 2013). Roh et al. (2015) investigated the effects of pilot injection on combustion and emissions on a diesel engine. They revealed that the highest pressure and NOx emissions of pilot injection are significantly decreased when compared to the single injection cases. The main reason for the decreased pressure and NOx emissions was caused by the shorter ignition delay. Li et al. (2015) presented the effect of multiple injections on particulate matter and reported that the amount of particulate matter decreases with the decrease in the diffusion combustion zone when pilot injection is applied. Lee et al. (2015) revealed the application of multiple injection and EGR to a diesel engine powered by JP-8 fuel. Results showed PM and NOx emissions could be reduced by half when using JP-8 without decreasing the thermal efficiency. Horibe et al. (2018) applied multiple injection to decrease cooling loss under the condition of high injection pressure, and varied the number of injection stages and the split ratio. Therefore, thermal efficiency was improved owing to the combined split-main injection, increased injection pressure, and advanced injection timing. Park et al. (2018) revealed that, when the injection pressure was increased without changing the injection timing in split injection, brake specific fuel consumption (BSFC) deteriorated due to the increase of dwell duration. The increased injection interval led to deterioration of BSFC, the increase of HC and NOx emissions, and the significant reduction of soot and CO emissions. In addition, the fixed injection interval with a retardation of injection timing improved the BSFC, increased soot emissions, and decreased the NOx, HC, and CO emissions. Based on the above analysis, injection timing around top dead center (TDC) and a short injection interval, with not too high injection pressure, improve the BSFC and emission characteristics in split-injection diesel combustion. Osada et al. (2012) improved the thermal efficiency by using closed post injection. The timing of the post injection was advanced as far as possible, and the amount of post injection was set approximately at 20% of the main injection amount. Horibe et al. (2012) also found that advanced post injection slightly improved thermal efficiency. Martin et al. (2016) studied optimization strategy of post injections to decrease soot emissions from a light-duty diesel engine. Results identified two distinct regimes of post injection strategies that decreased soot emissions. For the long-dwell regime, the post mass was the critical factor in achieving soot reduction, whereas in the close-coupled regime, the post interval was the critical factor.
Engine manufacturers applied one of the measures, which was injection strategies, to meet the US Department of Energy (DOE) goal of demonstrating 55% brake thermal efficiency (BTE) on a HD engine. Zukouski et al. (2015) carried out an expanded range of start of injections with rail pressure sweep at each start of injection, and revealed the highest BTE within an optimal 50% of the mass fraction burned window. O'Connor et al. (2017) evaluated a number of single and multiple injection strategies varying injection timing and injection quantity, focusing on the combustion and injection strategy optimization, coupling 3-D computational fluid dynamics with 1-D engine modeling. Results indicated a maximum BTE up to 54.2% at brake specific NOx of 8 g/kWh, with selected engine operating conditions at brake torque 1550 Nm and engine speed 900 rpm. Kocher (2017) reported that, by adjusting the fuel injection rate to obtain a 2 CA earlier peak heat release rate, the closed-cycle efficiency improved about 0.3%.
It is found that most existing work which applied multiple injection strategies was not limited by the peak combustion pressure (PCP). The injection strategy is related to the PCP, and increasing PCP has enabled increased diesel engine BTE (Megel et al., 2011; Koeberlein, 2014). If the peak combustion pressure at the beginning of expansion is increased, this adds positive area to the p-V diagram which more than offsets a slight increase in the (negative) work required during compression (Heywood, 2018). Therefore, a larger fraction of fuel energy at beginning of expansion is transferred to the piston as work, and the brake thermal efficiency was improved. Factually, HD diesel had steadily increased from approximately 38% BTE and 10 MPa PCP in the mid-1980s to approximately 45% BTE and 17 MPa PCP in 2000. From 2000 to 2010, PCP increased continually but BTE fell first and increased as a result of technologies employed to satisfy new emissions regulations, most notably exhaust gas recirculation (EGR) (Stanton, 2013). For example, a 15 L 354 kW diesel engine (Displacement: 15 L, Power: 354 kW) operated at 42% BTE and 19 MPa PCP in 2010 (U.S. Department of Energy, 2013). From 2010 to 2020, although the PCP did not increase significantly, the BTEs of some prototypes were improved to 50% by optimization. The targets from the DOE report are 50% BTE and 25 MPa PCP in 2025, 55% BTE and 27.5 MPa PCP in 2040, and 60% BTE and 30 MPa PCP in 2050 (U.S. Department of Energy, 2013).
The materials used in HD diesel components have their mechanical loading limits (Pierce et al., 2019); an example of recently gray cast iron HD diesel head was designed for 25 MPa PCP (Megel et al., 2011). The injection strategies can improve the performance at the PCP limitation. Suh (2011) revealed that maximum apparent heat release rate (AHRR) of two pilot injections was decreased to 47.2% compared to that of single injection at 5 MPa PCP. It was also found that two pilot injections improved combustion efficiency. Furthermore, in multiple injection strategy, less HC emissions and more CO formation were observed during combustion process, and remarkable simultaneous reduction of soot emissions up to 25% and NOx emissions up to 58.7% could be achieved in low compression ratio engine. Babayev et al., 2019a compared the different injection strategies with the total injection quantity kept relatively constant under 15 MPa PCP. The results proved that the isobaric combustion concept could achieve gross indicated efficiencies close to or higher than those of a conventional diesel combustion (CDC) cycle. Furthermore, the results revealed that heat transfer losses could be reduced by over 20% with an isobaric cycle. The NOx emissions were significantly lower for the isobaric combustion. Meanwhile, the soot, CO, and HC emission levels were proven to be fairly similar to those of the conventional diesel combustion. Babayev et al., 2019b also focused on understanding the effect of different injection strategies on the emissions, heat release, and thermal efficiency of isobaric combustion at 15 MPa PCP. At high PCPs, isobaric combustion cycle was capable of achieving efficiencies equal to those of the CDC cycle. However, it had much higher exhaust enthalpy, lower PCPs, and heat transfer losses. NOx formation was only a function of the total injection duration. CO, HC, and soot were formed during the first injection, then oxidized during the subsequent injections. CO, HC, and soot formation rate increased again during the late injections. Nyrenstedt et al. (2020) performed injection strategy experiments with an equivalent HD diesel optical engine around 7 MPa PCP. Three injection strategies built two isobaric heat release cases and an isochoric heat release case. Results found that in the isobaric cases, liquid fuel was injected into burning gases. This resulted in shorter ignition delays and thus a poor mixing level. The lack of air/fuel mixing was clearly the main factor contributing to the high soot emissions observed in isobaric combustion. By tracking the chemiluminescence, the lower heat losses of the isobaric strategy were further explained. Unlike the single injection, multiple injections helped to contain the hot gases away from the walls. However, the opposite effects were also found from the high thermal radiation caused by the extensive soot formation. Ramadan et al. (2020) focused on the effect of fuels on the multiple-injection equivalent HD diesel optical engine which had 7 MPa PCP. The research revealed that isobaric combustion could be achieved even with high octane number fuels such as isooctane. The dwell time between injections was much larger for isooctane, which allowed enhanced mixing of the air with fuel jets and thereby a partially premixed combustion behavior. Tang et al. (2020) evaluated the fuel spray characteristics of the four-consecutive-injections strategy which used in high-pressure isobaric combustion of about 3.2 MPa PCP at TDC. The high-speed imaging of the liquid-phase spray revealed that a short injection dwell reduced the hydraulic delay of the injector, resulting in an increase in both the injection duration and the peak liquid-phase penetration length. Goyal et al. (2020) studied the effect of compression ratio, EGR, and engine speed on CDC and two isobaric combustion cases, by using multiple injection strategies. The high-pressure isobaric combustion (IsoH) and low-pressure isobaric combustion (IsoL) were maintained at PCP of 6.8 and 5 MPa, respectively. From the compression ratio comparison results, it was found that a higher compression ratio resulted in increased gross indicated efficiency and decreased exhaust losses. The NOx emissions were also increased with decreased soot concentration at the lower compression ratio. Irrespective of EGR rates and engine speed, it was found that IsoH had similar or higher gross indicated efficiency than CDC with the lowest efficiency for IsoL. At a given engine speed, lower EGR rates resulted in lower soot, CO, and HC emissions with higher NOx emissions. However, with decreased engine speed, HC and CO emissions were highly unchanged.
Based on the aforementioned studies, it is found that multiple-injection can effectively control the in-cylinder combustion, so as to obtain higher thermal efficiency and lower emissions. However, the studies on multiple-injection were mainly conducted under lower PCP at 15 MPa in the previous works. In future, PCPs should be increased further in heavy-duty diesel engines in order to obtain enhanced thermal efficiency. Therefore, in the current study, first of all, for further improve the understanding of injection strategies on higher PCP, the PCP is limited to 20 MPa to investigate the effects of multiple-injection on combustion and emissions. Secondly, the current study will clarify the relationship between PCPs and the engine performance, such as BTE, peak average temperature, and peak pressure rise rate. Finally, an optimized injection strategy is proposed at 20 MPa. The current work can provide a valuable reference on the utilization of injection strategies on diesel engine under higher combustion pressure conditions.
All experiments were carried out on an inline and 6-cylinder heavy-duty diesel engine equipped with a Bosch commercial common rail fuel-injection system. The detailed specifications of the engine are listed in Table 1. The schematic of the experimental setup is presented in Figure 1. The original engine can meet the Euro VI emission regulations by using a high-pressure EGR, a selective catalytic reduction (SCR), a diesel oxidation catalyst (DOC), and a diesel particulate filter (DPF). The EGR, SCR, DOC, and DPF were removed and all the emissions were the raw emissions in this experiment.
The in-cylinder pressure was measured by a pressure transducer (Kistler 6125C) coupled with a corresponding charge amplifier (Kistler 5011B10) and a data acquisition system. The acquisition of cylinder pressure data of 100 consecutive engine cycles was triggered by the optical crank angle encoder (Kistler 2614A4) with a resolution of 0.5 CA. The AHRR values were calculated by the model which has been applied in previous studies (Liu et al., 2013; Zheng et al., 2015a; Zheng et al., 2015b). The average temperatures were calculated using measured in-cylinder pressure and trapped mass with ideal law assumption. Exhaust smoke was measured with a filter paper smoke meter (AVL 415S). Furthermore, the gaseous emissions, including NOx, HC, and CO, were measured by an exhaust emission analyzer (HORIBA MEXA7100DECR). During the experiment, the temperature of cooling water and intake air were controlled at 85 ± 2°C and 50 ± 2°C, respectively. At each test point, the engine ran for several minutes until the controlled measurement parameters were stable, then the performance, emissions, and combustion pressures were measured and recorded. The uncertainties of the measurement instruments are shown in Table 2, which are from the manufacturer specification.
In this work, the operating condition of 1.5 MPa brake mean effective pressure (BMEP) and 1500 rpm engine speed was selected to represent the frequently used operating and the optimal economic area of the diesel engine. The injection settings are listed in Table 3. The maximum of the main injection timing of each type was the limit value with the PCP constraint of 20 MPa. In the case of single main injection timing, the injection timing was retarded from −14 CA after top dead center (ATDC) (2 CA interval), and the injection pressure was 120 MPa, which was from the original injection map at this operating condition. In the case of single main injection pressure, the injection pressure was decreased from 180 MPa (20 MPa interval), which was the maximum injection pressure of the fuel-injection system. The injection pressure of following cases was 160 MPa with the highest BTE of the single main injection pressure cases. In the case of pilot-main interval, the interval was deceased from 30 CA (5 CA interval), and the pilot mass was 10 mg. In the case of pilot mass, the pilot mass was decreased from 10 mg (2 mg interval), and the pilot-main interval was 5 CA with the highest BTE of pilot-main interval cases.
In the case of main-post interval, the interval was increased from 6 CA (2 CA interval), which was the minimum main-post interval, and the post mass was 30 mg. In the case of post mass, the post mass was decreased from 30 mg (5 mg interval), and the main-post interval was 6 CA with the highest BTE of main-post interval cases. In the case of pilot-main-post injection, the injection parameters were of the optimum value with the highest BTE of previous cases except main timing, and the main timing was retarded from −12 CA ATDC (2 CA interval).
The fuel energy (Qfuel) is divided into four parts: brake power, exhaust loss (ηex), heat transfer loss (ηcool), and combustion loss and others (ηmisc). Brake power (Pe) is the usable power delivered by the engine to the load. Energy of exhaust gas (Qex) is the energy taken away by the exhaust gas, and is calculated based on exhaust temperature. Heat transfer loss includes coolant and oil thermal losses, etc. Combustion loss and others include total combustion and mechanical losses. Combustion loss (ηcomb) is calculated based on unburned HC, CO, and H2. Mechanical losses (ηm) are the ratio of mechanical losses power and fuel energy. BTE (ηet), exhaust loss, heat transfer loss, combustion loss, and others are respectively defined as
The detailed calculations of each loss can be found in Ref. (Taymaz, 2006; Heywood, 2018).
Figure 2 shows the effects of single main injection timing and pressure on combustion characteristics, respectively. As the main timing retards, the start of combustion delays and the peak combustion pressure decrease. As the injection pressure increases, the injection duration is shortened and the fuel atomization is improved. The peak AHRR and combustion phasing determine the peak combustion pressure. As the injection pressure increases, the combustion phasing is advanced and the peak AHRR is increased, which results in the increase and advance of combustion pressure. Overall, the main injection timing has larger effects on in-cylinder pressure than injection pressure.
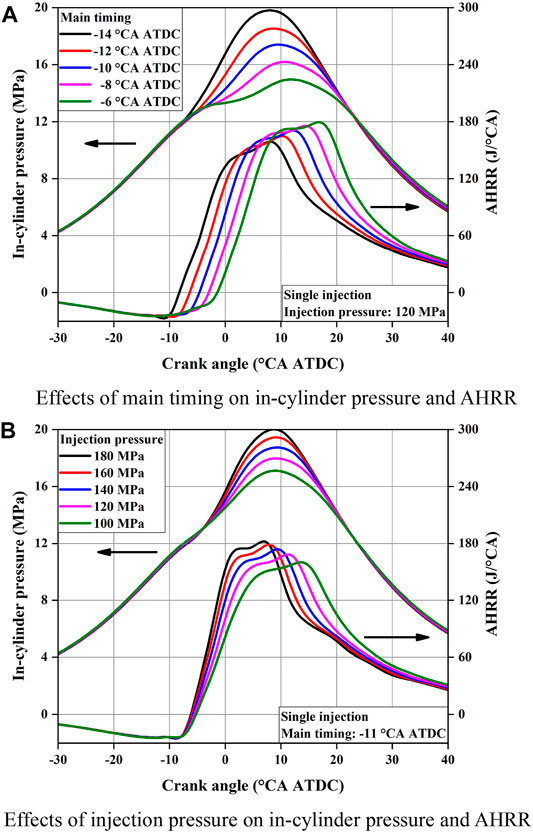
FIGURE 2. Effects of single main injection timing and pressure on combustion characteristics. (A) Effects of main timing on in-cylinder pressure and AHRR, (B) Effects of injection pressure on in-cylinder pressure and AHRR.
Figure 3 shows the effects of single main injection timing and pressure on distribution of fuel energy, respectively. As the main timing advances, the higher combustion pressure gradually increases BTE, the combustion phasing is nearer to TDC, and exhaust loss decreases gradually; the similar AHRR profiles determine basically unchanged heat transfer and combustion loss. As the injection pressure increases, the combustion pressure and mechanical losses are increased, which offset each other, and finally the BTE first increases and then decreases. With the increase of injection pressure, the combustion phasing is nearer to TDC and exhaust loss decreases gradually, the in-cylinder average temperature increases, and the heat transfer loss increases. The fuel pump work increases, and the mechanical losses increases. It should be noted that BTEs are similar above 120 MPa and all BTEs are between 42.6 and 42.8%. In general, more advanced injection timing can obtain higher BTE, while the injection pressure has fewer effects on BTE as it is higher than 120 MPa.
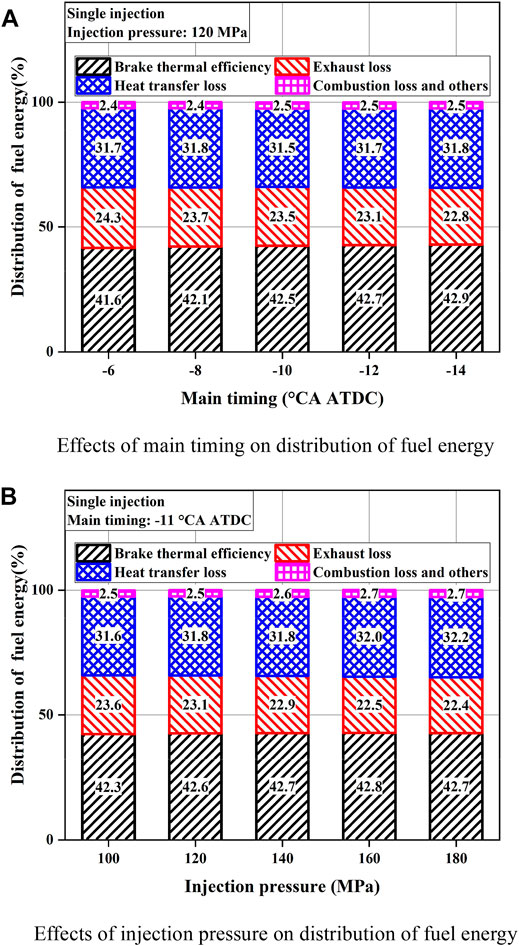
FIGURE 3. Effects of single main injection timing and pressure on distribution of fuel energy. (A) Effects of main timing on distribution of fuel energy, (B) Effects of injection pressure on distribution of fuel energy.
Figure 4 shows the effects of single main injection timing and pressure on emissions, respectively. As the injection timing advances, the combustion phasing is nearer to TDC and in-cylinder combustion pressure is increased, NOx emissions increase, while CO emissions decrease slightly. More fuel spray impinges on the combustion chamber walls due to earlier injection timings, resulting in the increase of HC emissions. The constant ignition delay leads to the basically unchanged soot emissions. As the injection pressure increases, in-cylinder combustion temperatures and pressures are increased, CO and NOx emissions trend is the same as that of the main timing. The improvement of spray atomization leads to the decrease of soot emissions and the shortening of ignition delay leads to the increase of soot emissions, which offset each other, and finally soot emissions first decrease and then increase. It is also because more fuel spray impinges on the combustion chamber walls, leading to slightly higher HC emissions, but the effects on HC emissions are less than those of the injection timings.
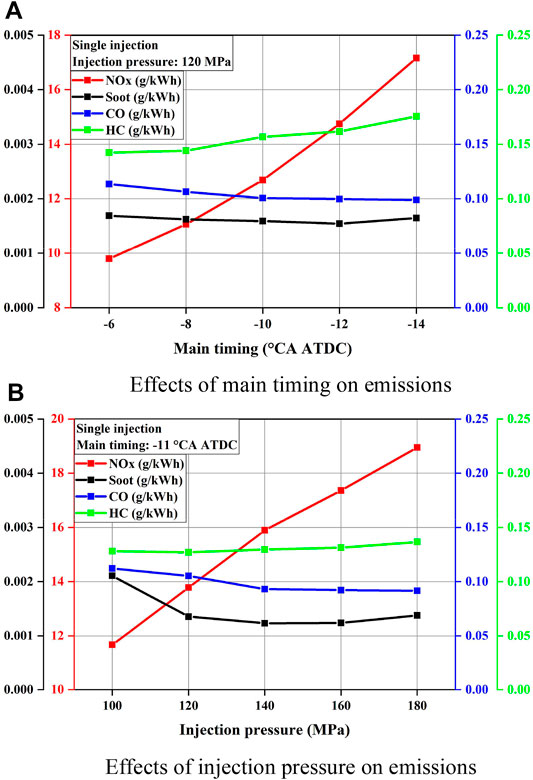
FIGURE 4. Effects of single main injection timing and pressure on emissions. (A) Effects of main timing on emissions. (B) Effects of injection pressure on emissions.
Figure 5 shows the effects of pilot-main interval and pilot mass on combustion characteristics, respectively. As the interval increases, the pilot-injection timing advances and, accordingly, the AHRR profiles of pilot injections are advanced, while the peak AHRR of pilot injections first increases and then decreases. When the interval is larger, the timing of pilot injection is too early, the in-cylinder temperatures and pressures are lower, and combustion volume is also larger, thus the combustion rates and peaks of AHRR for pilot injection are lower. Due to the fact that the in-cylinder temperature and pressure at 30 CA interval pilot injection are too low, the combustion phasing of pilot injection is similar at 30 and 25 CA interval. When the interval is smaller, in-cylinder temperatures and pressures are increased, the ignition delay of pilot injection is shorter, and peak AHRR of pilot injection is also lower. Therefore, at a given interval of 15 CA, the peak of AHRR for pilot-injection is the highest. Even if the AHRRs of pilot-injections present a large difference, the AHRR profiles of main injections are less affected by the interval. In-cylinder pressure of compression stroke is changed slightly as the peak AHRR of pilot injection changes, but the pilot mass is smaller and the in-cylinder pressure of expansion stroke is basically unchanged with the increased interval. In Figure 5B, as the pilot mass increases, the peak AHRR of pilot injection is increased, in-cylinder temperatures and pressures are higher, the ignition delay of main injection is shorter, and finally results in the decreased peak AHRR of main injection. In-cylinder pressure of compression stroke is increased, which leads to the increase of PCP in expansion stroke. Overall, pilot mass has larger effects on in-cylinder pressure than pilot-main interval.
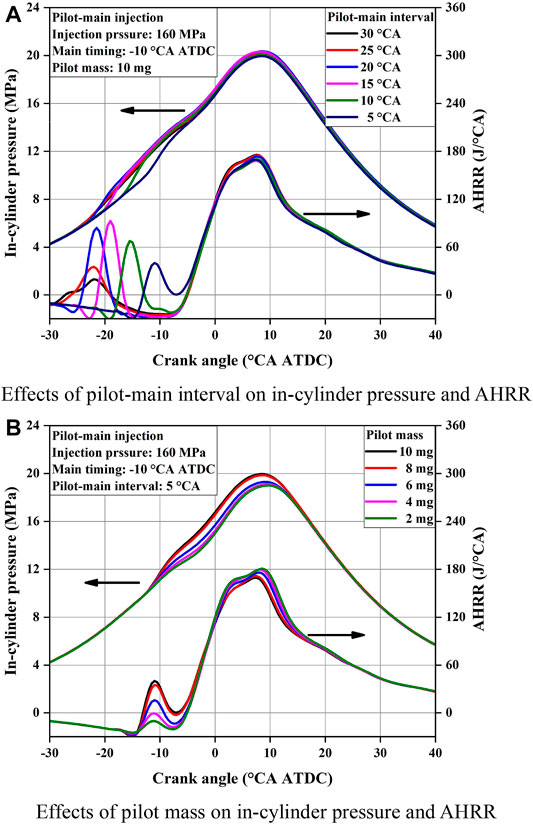
FIGURE 5. Effects of pilot-main interval and pilot mass on combustion characteristics. (A) Effects of pilot-main interval on in-cylinder pressure and AHRR. (B) Effects of pilot mass on in-cylinder pressure and AHRR.
Figure 6 shows the effects of pilot-main interval and pilot mass on distribution of fuel energy, respectively. In Figure 6A, the higher combustion pressure of pilot injection at compression stroke decreases BTE, which also leads to higher combustion temperature of compression stroke, and finally heat transfer loss increases. In general, the smaller pilot-main interval improves BTE. As the pilot mass increases, although the combustion pressure and temperature of expansion stroke increase, the combustion pressure and temperature of compression stroke also increase, which offset each other, and finally results in the basically unchanged distribution of fuel energy.
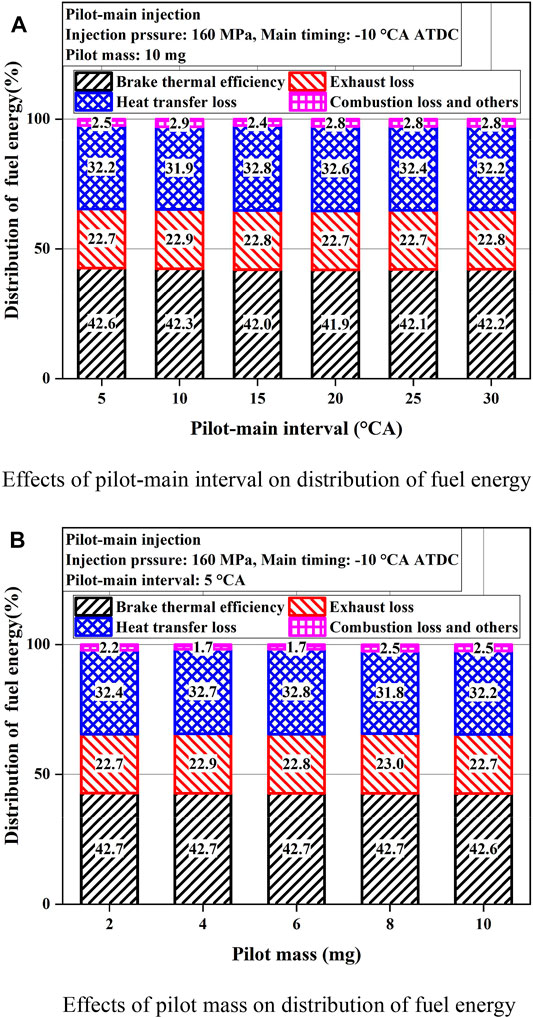
FIGURE 6. Effects of pilot-main interval and pilot mass on distribution of fuel energy. (A) Effects of pilot-main interval on distribution of fuel energy, (B) Effects of pilot mass on distribution of fuel energy.
Figure 7 shows the effects of pilot-main interval and pilot mass on emissions, respectively. The higher peak AHRRs of pilot injection as shown in Figure 5A result in slightly more NOx emissions at 15 and 20 CA intervals. The higher operating load and the smaller pilot mass make the interval have minor effects on HC and soot emissions. The CO emissions increase rapidly as the interval is larger than 15 CA. The AHRRs of main injection are basically unchanged and larger interval decreases the combustion temperature of pilot injection; the generated CO cannot be further oxidized to CO2, and enters the clearance area, resulting in the increase in CO emissions. As the pilot mass increases, the combustion pressure and temperature increase, which leads to the increase of NOx emissions. Due to the lower combustion temperature of pilot injection, as the pilot mass increases, the HC and soot emissions of incomplete combustion increase, while the main injection mass decreases, the AHRR of main injection decreases, which are not conducive to HC and soot oxidation, and both emissions increase slightly. Overall, both pilot-main interval and pilot mass have minor effects on emissions; the smaller pilot-main interval and the less pilot mass can improve emissions to some extent.
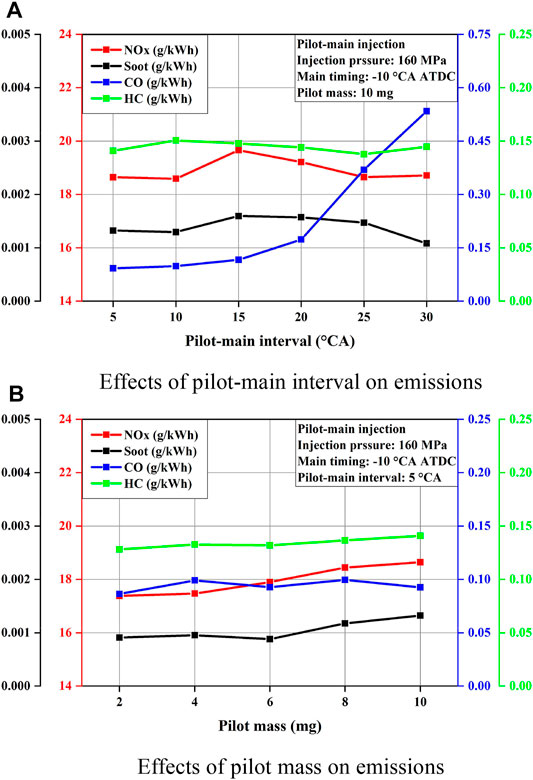
FIGURE 7. Effects of pilot-main interval and pilot mass on emissions. (A) Effects of pilot-main interval on emissions, (B) Effects of pilot mass on emissions.
Figure 8 shows the effects of main-post interval and post mass on combustion characteristics, respectively. As the interval increases, the AHRR profiles of post injections are retarded and the AHRR profiles of main injections and the peaks of AHRR for post injections are basically unchanged. The combustion phasing of post injection retards and is farther to TDC, which results in the basically unchanged AHRR profiles of main injection. Due to the in-cylinder pressure and temperature of main injection being relatively higher, the peaks of AHRRs for post injections are less affected by the main-post interval. As the interval increases, the combustion pressure of post injection is decreased slightly, and the combustion pressure of main injection is basically unchanged. As the post mass increases, the peak AHRR of post injection is increased slightly and the peaks of AHRR for post injections are retarded due to the longer post injection duration. More post mass makes the heat release of post injection farther to TDC, results in more exhaust and heat transfer loss, and the heat release of main injection decreases, resulting in lower PCP. In general, post mass has larger effects on PCP than main-post interval.
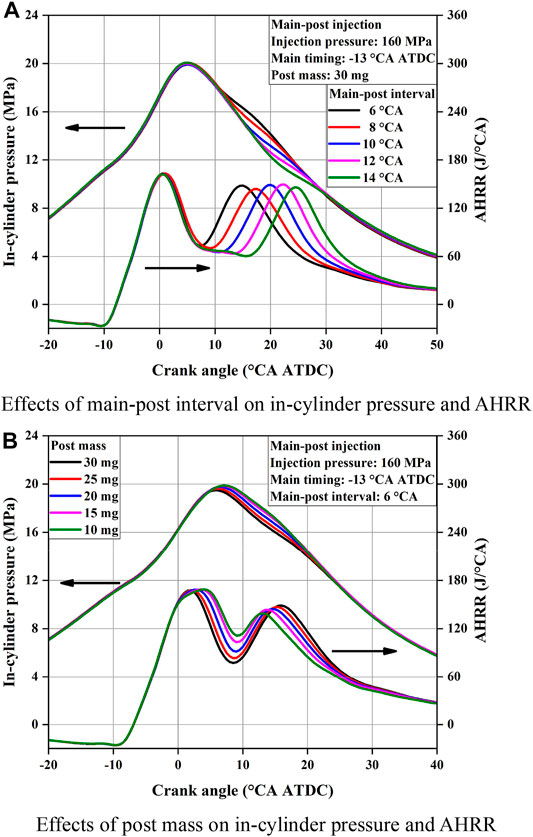
FIGURE 8. Effects of main-post interval and post mass on combustion characteristics. (A) Effects of main-post interval on in-cylinder pressure and AHRR, (B) Effects of post mass on in-cylinder pressure and AHRR.
Figure 9 shows the effects of main-post interval and post mass on distribution of fuel energy, respectively. As the interval increases, combustion phasing of post injection retards and is farther to TDC, and the combustion becomes less isochoric with the increase of combustion duration, which leads to the reduction in BTE and the increment of exhaust and heat transfer loss. As the post mass increases, the combustion pressure of main injection is slightly decreased, which results in the decrease of BTE. Meanwhile, the combustion duration is prolonged, which leads to the increased heat transfer loss. Overall, main-post interval has larger effects on distribution of fuel energy than post mass. The smaller main-post interval and the less post mass can improve BTE.
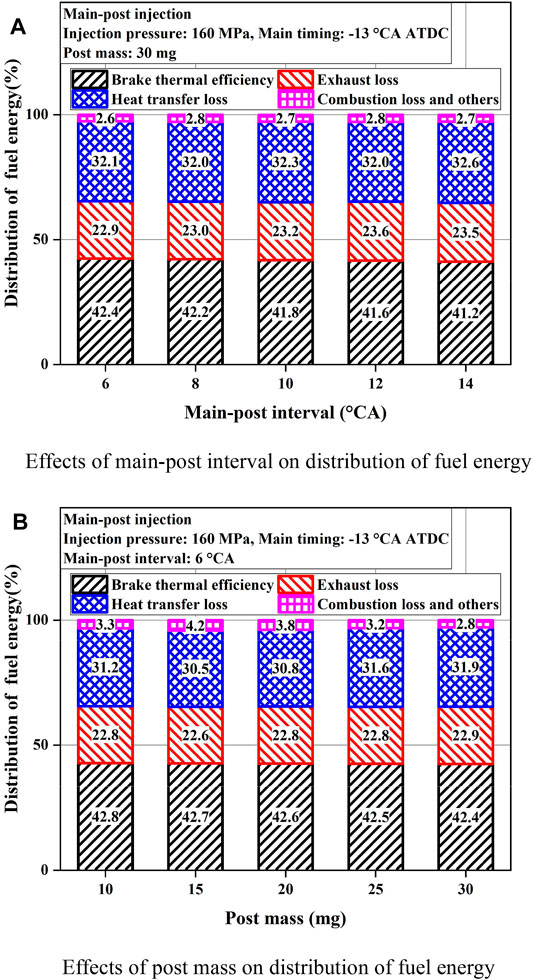
FIGURE 9. Effects of main-post interval and post mass on distribution of fuel energy.(A) Effects of main-post interval on distribution of fuel energy, (B) Effects of post mass on distribution of fuel energy.
Figure 10 shows the effects of main-post interval and post mass on emissions, respectively. As the interval increases, although the combustion duration is prolonged, the combustion temperature of post injection is decreased, which results in the decrease of NOx emissions and increase of soot emissions. Both CO and HC emissions are basically unchanged because of the higher in-cylinder pressure and temperature produced by the main injection combustion. The CO and HC emissions are slightly increased at 14 CA interval due to its too low combustion temperature of post injection. As the post mass increases, the combustion duration is also prolonged, but the combustion temperature and pressure of main injection are decreased, which also results in the decrease of NOx emissions and the increase of soot emissions. Similar to the effects of post interval, both CO and HC emissions are also basically unchanged with the variation of post mass. In general, both main-post interval and post mass have minor effects on emissions of CO and HC emissions, but can reduce NOx emissions and increase soot emissions.
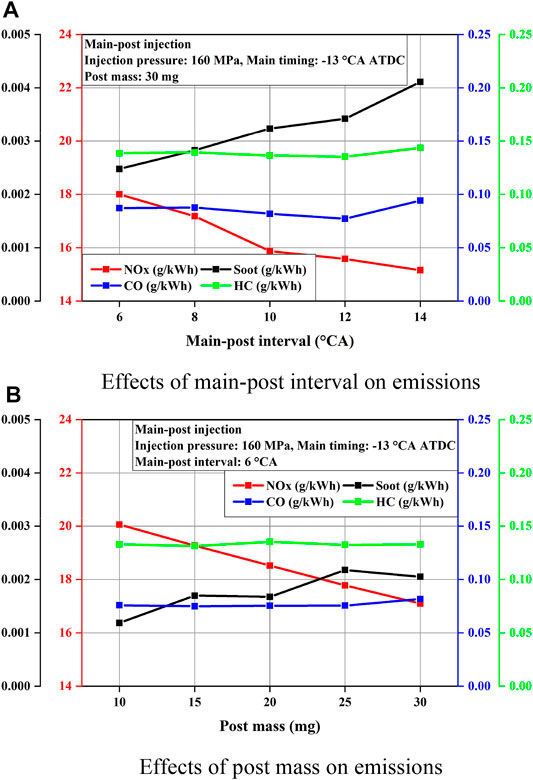
FIGURE 10. Effects of main-post interval and post mass on emissions. (A) Effects of main-post interval on emissions, (B) Effects of post mass on emissions.
Figure 11 shows the effects of pilot-main-post injection on combustion and emissions. Compared with single main injection, the AHRR profiles of pilot and post injection are added to the AHRR profile of main injection. Similar to single main injection, as injection timing advances, the start of combustion is farther to TDC, and the in-cylinder temperature and the peak AHRR decrease. But the combustion phasing is nearer to TDC, which leads to the increased combustion pressure. The higher combustion pressure increases BTE, the combustion phasing is nearer to TDC, and exhaust loss decreases gradually; the similar AHRR profiles are determined to be basically unchanged in heat transfer and combustion loss. The combustion phasing is nearer to TDC and in-cylinder combustion pressure is increased, which results in the increased NOx emissions. More fuel spray impinges on the combustion chamber walls due to earlier injection timings; thus, HC emissions increase slightly. The constant ignition delay and post mass lead to the basically unchanged soot and CO emissions.
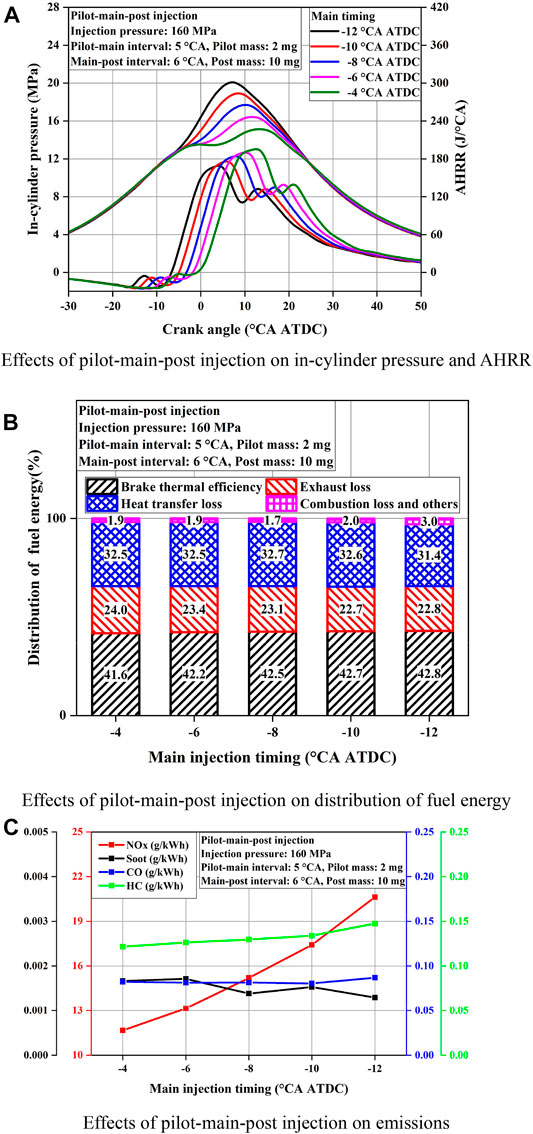
FIGURE 11. Effects of pilot-main-post injection on combustion and emissions. (A) Effects of pilot-main-post injection on in-cylinder pressure and AHRR, (B) Effects of pilot-main-post injection on distribution of fuel energy. (C) Effects of pilot-main-post injection on emissions.
Figure 12 shows the effects of PCP on performance. The local graphs only include the linear correlation points of different injection strategies. Overall, the increase of PCP is accompanied by the increase of BTE, peak average temperature and PRR. This also means that the improvement on BTE by the increase of PCP imparts greater mechanical and thermal loads on engine components and materials. Figure 12A shows that the PCP and BTE are linearly correlated under some injection strategies and the increment of BTE is about 0.3% for every 1 MPa increase in PCP. However, as the interval of pilot-main injection or main-post injection changes, or the post mass of main-post injection changes, they have very large effects on BTE. It can be seen that the PCP of the three injection strategies is about 20 MPa, but the BTE changes greatly. That is to say, at approximately 20 MPa PCP, calibrating the interval of pilot-main injection can make the diesel engine have relatively low PRR as shown in Figure 12C. Calibrating the interval and post mass of main-post injection can make the diesel engine have relatively low peak average temperature and thus lower NOx emissions as shown in Figure 12B. Furthermore, the post mass needs to be further reduced to improve BTE. Therefore, the three injection strategies need to be optimized to compromise the above performance and BTE at approximately 20 MPa PCP. Generally, PCP and peak average temperature of the other injection strategies are linearly correlated. The increment of peak average temperature and peak PRR are about 30 K and 0.1 MPa/CA for every 1 MPa increase in PCP.
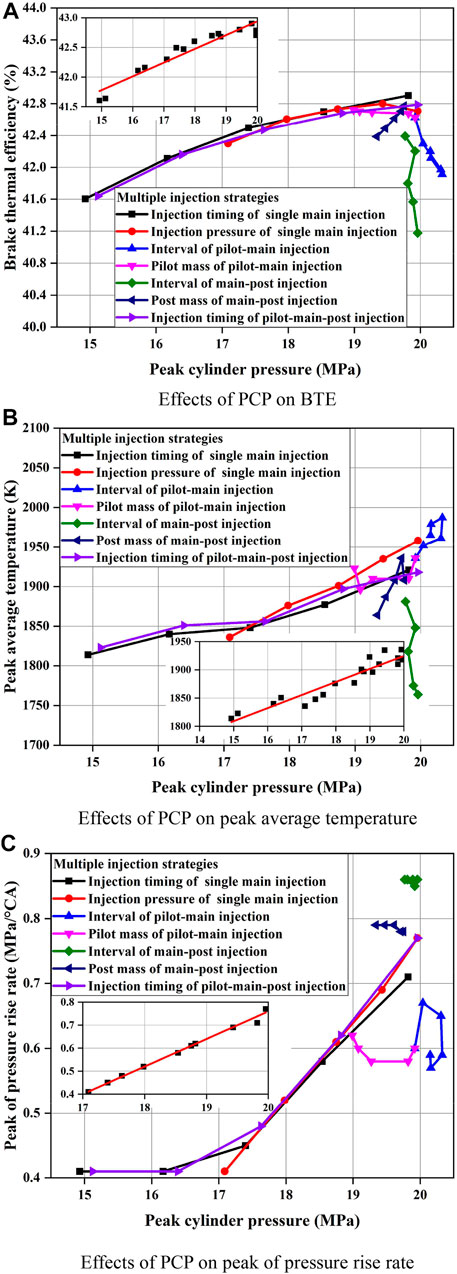
FIGURE 12. Effects of PCP on performance. (A) Effects of PCP on BTE, (B) Effects of PCP on peak average temperature, (C) Effects of PCP on peak of pressure rise rate.
The highest BTE of different injection strategies is obtained by calibrating the interval and mass in Table 3, but the maximum of the main injection timing of each type was the limit value with the PCP constraint of 20 MPa. Table 4 shows the highest BTE injection settings of different injection strategies at 20 MPa PCP. Figure 13 shows the effects of injection strategies in Table 4 on combustion and emissions. Different injection strategies have different characteristics of AHRR profiles. But the in-cylinder pressure profiles are basically the same. The main injection mass of single main injection and pilot-main injection is larger, and the combustion pressure of single main injection and pilot-main injection is slightly higher than that of main-post injection and pilot-main-post injection after PCP. The peak PRR of all four strategies is about 0.8 MPa/CA. The peak combustion temperature of all four strategies is similar. The BTE of all four strategies is 42.8% at 20 MPa PCP. Main-post injection and pilot-main-post injection prolong the combustion duration due to the post injection, which leads to the increased exhaust loss. Single main injection and pilot-main injection increase the higher combustion temperature duration due to larger main injection mass, which results in the increased heat transfer loss. Higher operating load and smaller pilot or post mass make different injection strategies have minor effects on emissions at 20 MPa PCP.
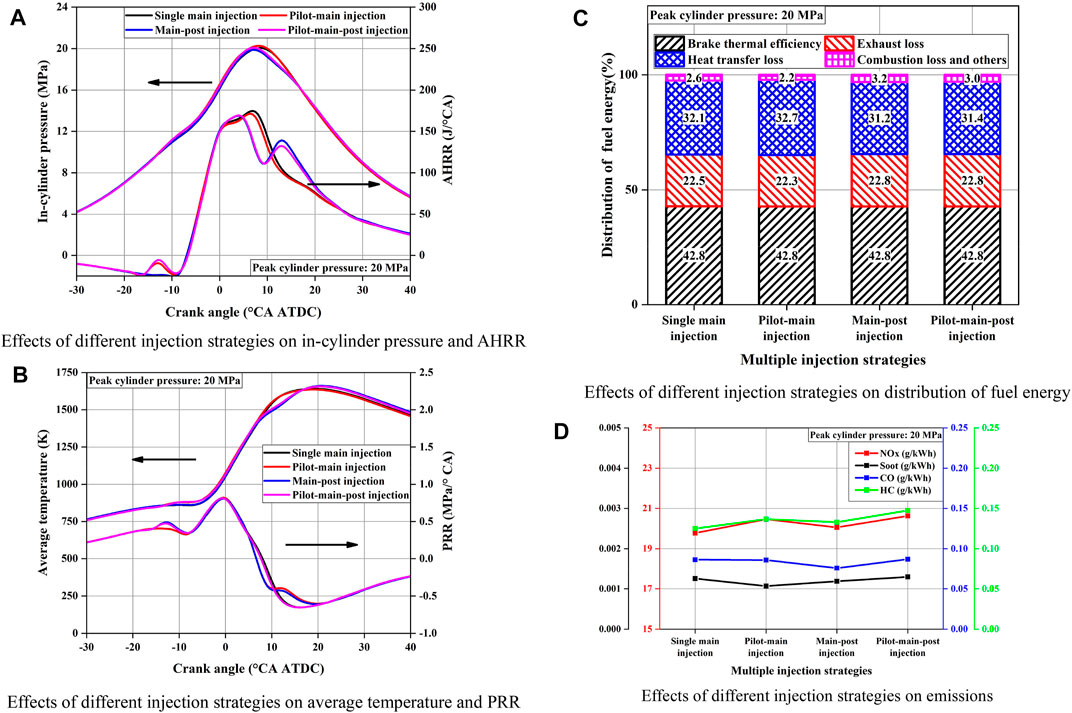
FIGURE 13. Effects of different injection strategies on performance at 20 MPa PCP. (A) Effects of different injection strategies on in-cylinder pressure and AHRR, (B) Effects of different injection strategies on average temperature and PRR, (C) Effects of different injection strategies on distribution of fuel energy, (D) Effects of different injection strategies on emissions.
Compared with other emissions, NOx emissions are increasingly difficult to reduce. Therefore, the effects of different injection strategies on combustion and emissions are studied at the same as NOx emissions. Table 5 shows the injection settings at a given NOx emission of 17.4 g/kWh and approximately 20 MPa PCP. Figure 14 shows the effects of injection strategies in Table 5 on combustion and emissions. Single main injection reaches the highest PCP and the combustion phasing is slightly advanced. The combustion pressure of single main injection and pilot-main injection is also slightly higher than that of main-post injection and pilot-main-post injection after PCP. The peak combustion temperature of all four strategies is also similar. The peak PRR of single main injection is slightly higher than the other three strategies. All four injection strategies have minor effects on distribution of fuel energy and emissions. Overall, regardless of keeping the same PCP or same NOx emissions at approximately 20 MPa combustion pressure, all four injection strategies have minor effects on performance.
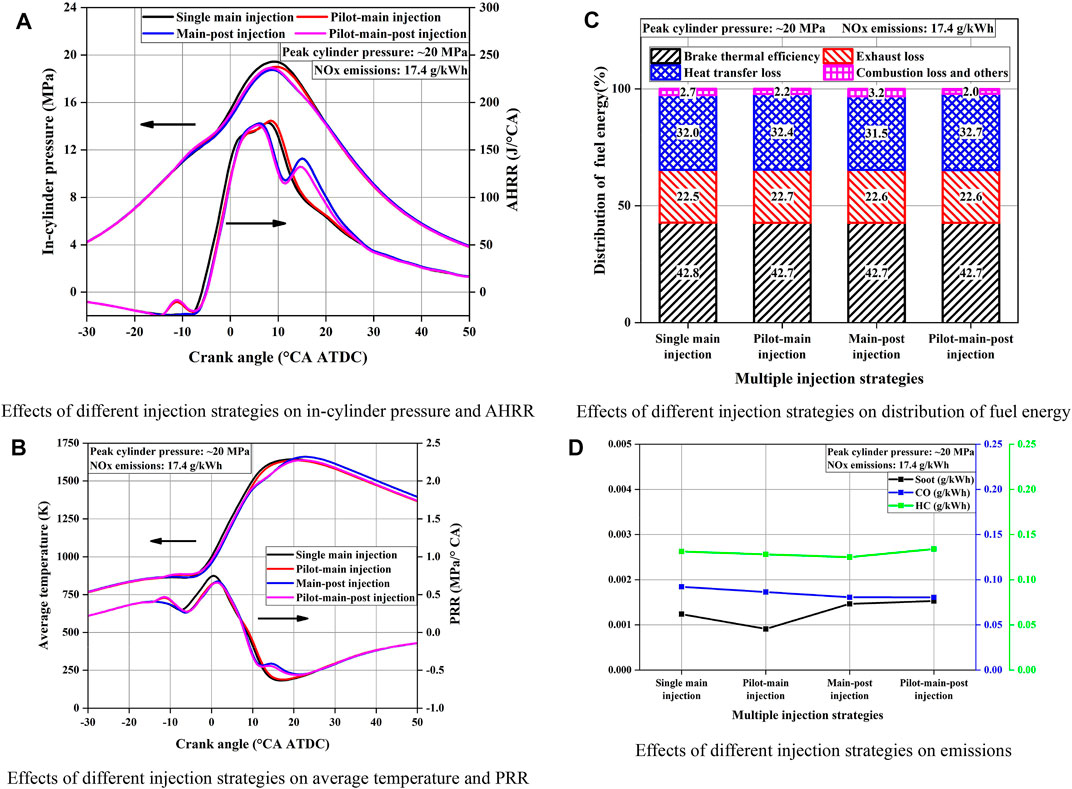
FIGURE 14. Effects of different injection strategies on performance at a given NOx emission of 17.4 g/kWh and approximate 20 MPa PCP. (A) Effects of different injection strategies on in-cylinder pressure and AHRR, (B) Effects of different injection strategies on average temperature and PRR, (C) Effects of different injection strategies on distribution of fuel energy, (D) Effects of different injection strategies on emissions.
In this study, an experimental study was conducted to further improve the understanding of injection strategies on engine performance under a relative higher peak combustion pressure at 20 MPa. The operating condition of 1.5 MPa BMEP and 1500 rpm engine speed was selected to represent the frequently used operating and the optimal economic area of the diesel engine. Four strategies of single main injection, pilot-main injection, main-post injection, and pilot-main-post injection were operated. The main conclusions can be summarized as follows.
(1) More advanced injection timing can obtain higher BTE, while the injection pressure has fewer effects on BTE as it is higher than 120 MPa. For double-injection, the smaller interval on pilot-main or main-post and the less pilot or post mass improves BTE and emissions. At approximately 20 MPa PCP, calibrating the interval of pilot-main injection can make the diesel engine have relatively low PRR. Calibrating the interval and post mass of main-post injection can make the diesel engine have relatively low peak average temperature and thus lower NOx emissions. Furthermore, the post mass needs to be further reduced to improve BTE. Therefore, the three injection strategies need to be optimized to compromise the above performance and BTE at approximately 20 MPa PCP.
(2) The PCPs are linearly correlated to the BTE, peak average temperature, and peak PRR. The increment of BTE, peak average temperature, and peak PRR are about 0.3%, 30 K, and 0.1 MPa/CA for every 1 MPa increase in PCP, respectively. This also means that the improvement on BTE by the increase of PCP imparts greater thermal and mechanical loads on engine materials and components.
(3) At 20 MPa PCP, based on the optimized injection strategies, the BTE of all four strategies is about 42.8%, and the peak PRR of all four strategies is about 0.8 MPa/CA. At a given NOx emission of 17.4 g/kWh and approximately 20 MPa PCP, all four injection strategies have minor effects on distribution of fuel energy and emissions. These show that all injection strategies have fewer effects on BTE and emissions at 20 MPa PCP.
The results demonstrated that all injection strategies have less effect on BTE and emissions at 20 MPa PCP, but the pilot-main injection and main-post injection are still effective measures to control combustion noise, mechanical load, heat load, and post-treatment temperature. However, in order to improve BTE, further experimental and numerical investigations are required to deeply examine the impacts of the higher PCP conditions (>30 MPa), higher injection pressure (>300 MPa), and more flexible injection strategy on combustion and emissions.
The original contributions presented in the study are included in the article/Supplementary Material, further inquiries can be directed to the corresponding author.
ZhZ: writing and editing. HL: review. ZY: methodology and validation. YW: investigation. XK: data curation. ZuZ: editing. MY: review and supervision.
This work was supported by the National Natural Science Foundation of China (NSFC) by No. 51976134 and Tianjin Science Fund for Distinguished Young Scholars by No. 20JCJQJC00160.
The authors declare that the research was conducted in the absence of any commercial or financial relationships that could be construed as a potential conflict of interest.
All claims expressed in this article are solely those of the authors and do not necessarily represent those of their affiliated organizations, or those of the publisher, the editors and the reviewers. Any product that may be evaluated in this article, or claim that may be made by its manufacturer, is not guaranteed or endorsed by the publisher.
Al Ramadan, A. S., Nyrenstedt, G., Ben Houidi, M., and Johansson, B. (2020). Optical Diagnostics of Isooctane and N-Heptane Isobaric Combustion. Technical Paper. 2020-01-1126. Warrendale: SAE. doi:10.4271/2020-01-1126
Babayev, R., Ben Houidi, M., Andersson, A., and Johansson, B. (2019a). Isobaric Combustion: A Potential Path to High Efficiency, in Combination with the Double Compression Expansion Engine (DCEE) Concept. Technical Paper. 2019-01-0085. Warrendale: SAE. doi:10.4271/2019-01-0085
Babayev, R., Houidi, M. B., Shankar, V. B., Aljohani, B., and Johansson, B. (2019b). Injection Strategies for Isobaric Combustion. Technical Paper. 2019-01-2267. Warrendale: SAE. doi:10.4271/2019-01-2267
Goyal, H., Dyuisenakhmetov, A., Houidi, M. B., Johansson, B., Badra, J., Cenker, E., et al. (2020). The Effect of Engine Speed, Exhaust Gas Recirculation, and Compression Ratio on Isobaric Combustion. SAE Int. J. Engines 13, 603–615. doi:10.4271/03-13-05-0038
Heywood, J. B. (2018). Internal Combustion Engine Fundamentals. second edition. New York: McGraw-Hill Education.
Horibe, N., Bao, Z., Taguchi, T., Egoshi, K., Kawanabe, H., and Ishiyama, T. (2018). Improvement of Thermal Efficiency in a Diesel Engine with High-Pressure Split Main Injection. Technical Paper. 2018-01-1791. Warrendale: SAE. doi:10.4271/2018-01-1791
Horibe, N., Tamura, I., Hamada, T., Liu, L., and Ishiyama, T. (2012). Smoke-Reduction Effect of after Injection in Combination with Pilot Injection. Trans. Soc. Automotive Eng. Jpn. 43, 1039–1044. doi:10.11351/jsaeronbun.43.1039
Horvath, A., Seitz, H. F., Gelter, J., and Raser, B. (2020). The Future Heavy-Duty Engine - Basic Engine Concept for Maximum CO2 Reduction. MTZ Worldw 81, 68–72. doi:10.1007/s38313-020-0276-9
Jin, C., Ampah, J. D., Afrane, S., Yin, Z., Liu, X., Sun, T., et al. (2021). Low-Carbon Alcohol Fuels for Decarbonizing the Road Transportation Industry: A Bibliometric Analysis 2000-2021. Environ. Sci. Pollut. Res. 29, 5577–5604. doi:10.1007/s11356-021-15539-1
Joshi, A. (2019). Review of Vehicle Engine Efficiency and Emissions. Technical Paper. 2019-01-0314. Warrendale: SAE. doi:10.4271/2019-01-0314
Joshi, A. (2021). Review of Vehicle Engine Efficiency and Emissions. Technical Paper. 2021-01-0575. Warrendale: SAE. doi:10.4271/2021-01-0575
Kocher, L. (2017). Cummins 55% Brake Thermal Efficiency Project, Project ACS098. Washington, DC: presentation at the US Department of Energy Annual Merit Review.
Koeberlein, D. (2014). Technology and System Level Demonstration of Highly Efficient and Clean, Diesel Powered Class 8 Trucks. Washington, DC: Cummins SuperTruck program.
Lee, J., Lee, J., Chu, S., Choi, H., and Min, K. (2015). Emission Reduction Potential in a Light-Duty Diesel Engine Fueled by JP-8. Energy 89, 92–99. doi:10.1016/j.energy.2015.07.060
Li, X., Guan, C., Luo, Y., and Huang, Z. (2015). Effect of Multiple-Injection Strategies on Diesel Engine Exhaust Particle Size and Nanostructure. J. Aerosol Sci. 89, 69–76. doi:10.1016/j.jaerosci.2015.07.008
Liu, H., Li, S., Zheng, Z., Xu, J., and Yao, M. (2013). Effects of N-Butanol, 2-butanol, and Methyl Octynoate Addition to Diesel Fuel on Combustion and Emissions over a Wide Range of Exhaust Gas Recirculation (EGR) Rates. Appl. Energ. 112, 246–256. doi:10.1016/j.apenergy.2013.06.023
Martin, J., Sun, C., Boehman, A., and O'Connor, J. (2016). Experimental Study of Post Injection Scheduling for Soot Reduction in a Light-Duty Turbodiesel Engine. Technical Paper. 2016-01-0726. Warrendale: SAE. doi:10.4271/2016-01-0726
Megel, M., Westmoreland, B., Jones, G., Phillips, F., Eberle, D., Tussing, M., et al. (2011). Development of a Structurally Optimized Heavy Duty Diesel Cylinder Head Design Capable of 250 Bar Peak Cylinder Pressure Operation. SAE Int. J. Engines 4, 2736–2755. doi:10.4271/2011-01-2232
Mohan, B., Yang, W., and Chou, S. K. (2013). Fuel Injection Strategies for Performance Improvement and Emissions Reduction in Compression Ignition Engines-A Review. Renew. Sustainable Energ. Rev. 28, 664–676. doi:10.1016/j.rser.2013.08.051
Nyrenstedt, G., Al Ramadan, A., Tang, Q., Badra, J., Cenker, E., Ben Houidi, M., et al. (2020). Isobaric Combustion for High Efficiency in an Optical Diesel Engine. Technical Paper. 2020-01-0301. Warrendale: SAE. doi:10.4271/2020-01-0301
O'Connor, J., Borz, M., Ruth, D., Han, J., Paul, C., Imren, A., et al. (2017). Optimization of an Advanced Combustion Strategy towards 55% BTE for the Volvo SuperTruck Program. Technical Paper. 2017-01-0723. Warrendale: SAE. doi:10.4271/2017-01-0723
Osada, H., Aoyagi, Y., and Shimada, K. (2012). Diesel Combustion Improvement Using High Boost, Wide Range and High Rate EGR in a Single Cylinder Engine (Third Report). Trans. Soc. Automotive Eng. Jpn. 43, 855–861. doi:10.11351/jsaeronbun.43.855
Park, S., Kim, H. J., Shin, D. H., and Lee, J.-T. (2018). Effects of Various Split Injection Strategies on Combustion and Emissions Characteristics in a Single-cylinder Diesel Engine. Appl. Therm. Eng. 140, 422–431. doi:10.1016/j.applthermaleng.2018.05.025
Pierce, D., Haynes, A., Hughes, J., Graves, R., Maziasz, P., Muralidharan, G., et al. (2019). High Temperature Materials for Heavy Duty Diesel Engines: Historical and Future Trends. Prog. Mater. Sci. 103, 109–179. doi:10.1016/j.pmatsci.2018.10.004
Roh, H. G., Lee, D., and Lee, C. S. (2015). Impact of DME-Biodiesel, Diesel-Biodiesel and Diesel Fuels on the Combustion and Emission Reduction Characteristics of a CI Engine According to Pilot and Single Injection Strategies. J. Energ. Inst. 88, 376–385. doi:10.1016/j.joei.2014.11.005
Stanton, D. W. (2013). Systematic Development of Highly Efficient and Clean Engines to Meet Future Commercial Vehicle Greenhouse Gas Regulations. SAE Int. J. Engines 6, 1395–1480. doi:10.4271/2013-01-2421
Suh, H. K. (2011). Investigations of Multiple Injection Strategies for the Improvement of Combustion and Exhaust Emissions Characteristics in a Low Compression Ratio (CR) Engine. Appl. Energ. 88, 5013–5019. doi:10.1016/j.apenergy.2011.06.048
Tang, Q., Sampath, R., Sharma, P., Nyrenstedt, G., Al Ramadan, A., Ben Houidi, M., et al. (2020). Optical Study on the Fuel Spray Characteristics of the Four-Consecutive-Injections Strategy Used in High-Pressure Isobaric Combustion. Technical Paper. 2020-01-1129. Warrendale: SAE. doi:10.4271/2020-01-1129
Taymaz, I. (2006). An Experimental Study of Energy Balance in Low Heat Rejection Diesel Engine. Energy 31 (2-3), 364–371. doi:10.1016/j.energy.2005.02.004
U.S. Department of Energy (2013). WORKSHOP REPORT:Trucks and Heavy-Duty Vehicles Technical Requirements and Gaps for Lightweight and Propulsion Materials. Washington, DC: U.S. Department of Energy.
Zheng, Z., Li, C., Liu, H., Zhang, Y., Zhong, X., and Yao, M. (2015a). Experimental Study on Diesel Conventional and Low Temperature Combustion by Fueling Four Isomers of Butanol. Fuel 141, 109–119. doi:10.1016/j.fuel.2014.10.053
Zheng, Z., Yue, L., Liu, H., Zhu, Y., Zhong, X., and Yao, M. (2015b). Effect of Two-Stage Injection on Combustion and Emissions under High EGR Rate on a Diesel Engine by Fueling Blends of Diesel/gasoline, Diesel/n-Butanol, Diesel/gasoline/n-Butanol and Pure Diesel. Energ. Convers. Management 90, 1–11. doi:10.1016/j.enconman.2014.11.011
Keywords: diesel engine, multiple injection strategies, peak combustion pressure, combustion, emissions
Citation: Zhang Z, Liu H, Yue Z, Wu Y, Kong X, Zheng Z and Yao M (2022) Effects of Multiple Injection Strategies on Heavy-Duty Diesel Energy Distributions and Emissions Under High Peak Combustion Pressures. Front. Energy Res. 10:857077. doi: 10.3389/fenrg.2022.857077
Received: 18 January 2022; Accepted: 22 March 2022;
Published: 14 April 2022.
Edited by:
Xiao Liu, Harbin Engineering University, ChinaReviewed by:
Choongsik Bae, Korea Advanced Institute of Science and Technology, South KoreaCopyright © 2022 Zhang, Liu, Yue, Wu, Kong, Zheng and Yao. This is an open-access article distributed under the terms of the Creative Commons Attribution License (CC BY). The use, distribution or reproduction in other forums is permitted, provided the original author(s) and the copyright owner(s) are credited and that the original publication in this journal is cited, in accordance with accepted academic practice. No use, distribution or reproduction is permitted which does not comply with these terms.
*Correspondence: Haifeng Liu, aGFpZmVuZ2xpdUB0anUuZWR1LmNu
Disclaimer: All claims expressed in this article are solely those of the authors and do not necessarily represent those of their affiliated organizations, or those of the publisher, the editors and the reviewers. Any product that may be evaluated in this article or claim that may be made by its manufacturer is not guaranteed or endorsed by the publisher.
Research integrity at Frontiers

Learn more about the work of our research integrity team to safeguard the quality of each article we publish.