Abstract
The electro-osmotic drag coefficient of water and methanol mixtures through Nafion 117 membranes was measured as a function of the composition at several temperatures between 25 and 60°C using a two-compartment capillary cell with Ag/AgCl electrodes. The electro-osmotic water drag in HCl aqueous solutions is higher than that reported in measurements where the membrane is in contact with pure water; hence, all the reported results were performed at the same acid concentration. It was found that the drag coefficient for pure methanol is about 40% higher than that for water at all the temperatures studied as a consequence of the expanded nanostructure of Nafion in methanol. The drag coefficients of the water–methanol mixtures exhibit a high non-linearity, which can be explained by considering the Nafion sorption in the binary solvent. The electro-osmotic flow in pure methanol is similar to that of 5 M methanol aqueous solutions, which opens the opportunity to use pure methanol in DMFCs. The methanol crossover due to permeability can be minimized. Controversial results with previous studies are also addressed.
Introduction
Methanol crossover through proton-exchange membranes (PEMs) is a major disadvantage of direct methanol fuel cells (DMFCs) since the oxidation of methanol at the cathode with the help of the catalyst contributes to a decreased overall cell efficiency and lifetime (DeLuca and Elabd, 2006; Neburchilov et al., 2007; Corti et al., 2014). The reaction of methanol at the cathode results in a loss of fuel and cathode voltage and is referred to as a mixed potential. To ameliorate this problem, low methanol concentrations (below 2 M or 8%v/v) are used in the DMFCs, limiting the overall cell potential (Corti et al., 2014).
The methanol flow through the PEMs is driven by three different forces, namely, the concentration gradient, the pressure gradient, and the electro-osmotic drag, which contribute in variable proportions to the methanol crossover. The hydraulic pressure gradient is generally low or null under the usual DMFC operation conditions, so mechanical permeation is not important. Methanol permeability and, more precisely, the ratio between the proton conductivity and the methanol permeability, called the membrane selectivity (Pivovar et al., 1999), are key parameters for PEMs used in DMFCs. PEMs with high selectivity are potentially better for DMFC applications. However, the methanol flow due to concentration gradients through the membrane depends on the efficiency of the methanol oxidation on the anode and the methanol concentration in the feed solution. It could be partially controlled by optimizing the thickness of the membrane, the methanol concentration of the feeding solutions, and the efficiency of the anodic catalyst (Kim and Pivovar, 2007).
On the other hand, the ionic (proton) transport through the membrane generates convective transport of solvent molecules through the electro-osmotic drag, which accounts for the transport of water or methanol by coupling the charge and mass transport. At a constant current density, the membrane thickness is the parameter that determines the relative contribution of diffusion and electro-osmosis to the alcohol crossover. Because diffusion flux depends on the membrane thickness, while electro-osmotic drag does not, the thinner the membrane is, the lower the electro-osmotic contribution is.
Nafion, a perfluorinated polymer with excellent chemical stability and ion conductivity (Mauritz and Moore, 2004) that allowed the commercialization of H2-fed PEM fuel cells, is also vastly used in DMFCs. The sorption of methanol in Nafion is high, and consequently, its permeability is much higher than that expected for a PEM for DMFCs (Diaz et al., 2012; Corti et al., 2014). In fact, several strategies have been developed for hindering the crossover of methanol from the anode to cathode in Nafion membranes. They have been analyzed in detail by Zakail et al. (Zakil et al., 2016) in a recent review. Briefly, the Nafion membranes can be modified by forming multilayers of metal (Pd, Pt, Pt/Ru) nanoparticles or nanowires on the Nafion surface or into the membrane (Tang et al., 2005; Jiang et al., 2006a; Jung et al., 2007; Brandão et al., 2010; Liang et al., 2010) by adding thin cracked metal barriers (Kim et al, 2017), processing the membrane at high temperature (Ramya and Dhathathreyan, 2008), recasting Nafion using different solvents (Ma et al., 2009), or forming a composite Nafion membrane with silica particles (Jiang et al., 2006b; Garnica Rodriguez et al., 2006; Jin et al., 2008), organic silica (Liang et al., 2006; Ren et al., 2006), inorganic fillers (Bauer and Willert-Porada, 2005; Lee et al., 2007; Wu et al., 2008; Hasani-Sadrabadi et al., 2009; Barbora et al., 2010; Zhang et al., 2011a; Abouzari-lotf et al., 2015; Velayutham et al., 2017; Mazzapioda et al., 2020; Parthiban and Sahu, 2020), organic fillers (Shao et al., 2002; Bae et al., 2005; Choi et al., 2005; Shim et al., 2005; Xu et al., 2005; Lin et al., 2006; Wu et al., 2007; Choi et al., 2008; Park et al., 2008; Yildirim et al., 2008; Wang et al., 2009; Zhang et al., 2011b; Su et al., 2014; Mondal et al., 2015; Hosseinpour et al., 2019), and graphene oxides (Nicotera et al., 2014; Yuan et al., 2014).
The main objective of the fillers used as a barrier to methanol crossover is to reduce the permeability of methanol by reducing its sorption capacity and increasing the tortuosity factor without affecting the ionic conductivity. In many cases, the modified Nafion membranes used in DMFC helped improve the cell performance, particularly those that increased the membrane’s selectivity. However, the DMFC operating conditions have a large effect on a DMFC performance, and instead of membrane selectivity ratio, cell power density is the most adequate parameter to assess the potential of a modified Nafion membrane (Zakil et al., 2016). Also, as long as we know, the effect of the fillers on the electro-osmotic flow of methanol has not been addressed in the literature.
Among the operational parameters that can be controlled to reduce the methanol crossover is the methanol concentration in the anode. A lower methanol concentration will reduce the gradient through the membrane and the methanol uptake by the membrane, reducing the permeability. However, the effect of the methanol concentration on the electro-osmotic flow is still not well understood. Only a few studies have reported electro-osmotic flow data for methanol–water mixtures through Nafion membranes, and the results are controversial.
The quantities that are commonly determined in electro-osmotic studies are the electro-osmotic permeability, W, defined as the ratio between the mass flow of the solvent (JV) and the current, I, circulating through the cell in the absence of pressure gradients (de Groot, 1952)and the electro-osmotic drag factor, ξ, defined as the number of solvent moles that are dragged by a mole of hydrogen ions (Fuller and Newman, 1992)
The first study of methanol transport through Nafion membranes was performed by Ren et al. (Ren et al., 2000) using a DMFC configuration method. They prepared the membrane-electrode assembly (MEA) with the Nafion membrane having PtRu and Pt black catalysts. In the DMFCs, working at a constant current density, i, methanol flows through the PtRu electrode and the fraction of methanol permeating the membrane is oxidized on the Pt electrode. In this configuration, methanol transport has a diffusional component in the Pt electrode direction and an electro-osmotic drag flow of methanol toward the PtRu electrode. That is, the electro-osmotic drag of methanol by the protons is opposite to the drag effects taking place in a DMFC under normal operation, and the net methanol flux in the DMFC is given bywhere P is the methanol permeability in Nafion, dc/dz is the concentration gradient, and F is the Faraday constant, while the other terms were previously defined. The electro-osmotic component of the flux may contribute to a considerable fraction of the methanol flow, particularly at high methanol concentrations. Thus, the methanol electro-osmotic drag factor is needed to determine the methanol permeability. Since this parameter was unknown, Ren et al. (Ren et al., 2000) proposed that it would be similar to the drag factor of water in Nafion, weighted by the molar fraction of methanol, xm, in the membrane. This approach, that is, to assume ξm = xm.ξw, was amply used for mathematical modeling of DMFCs (Wang and Wang, 2003; García et al., 2004).
Later, Tschinder and co-workers (Schaffer et al., 2006; Tschinder et al., 2007) measured the electro-osmotic drag factor of water–methanol mixtures using a two-compartment cell similar to that described by Zawodzinski (Zawodzinski et al., 1993a) to study the electro-osmosis of water in Nafion. In their first study (Schaffer et al., 2006), the authors reported the total drag factor (water + methanol) through different Nafion membranes (112, 115, and 117) at 30°C. The results shown in Figure 1 indicate that for Nafion 117, the drag factor increases with the methanol concentration from ξ ≈ 2.7 for pure water up to ξ ≈ 9.5 for pure methanol. In the second study (Tschinder et al., 2007), the measurements for Nafion 117 were extended to temperatures from 20 to 70°C in the range of compositions from pure water to methanol ≈65% w/w. The results, also plotted in Figure 1, show a monotonous increase in the drag factor with the methanol concentration that the authors assigned to the enlargement of the Nafion membrane channel diameter, which facilitates the solvent transport.
FIGURE 1
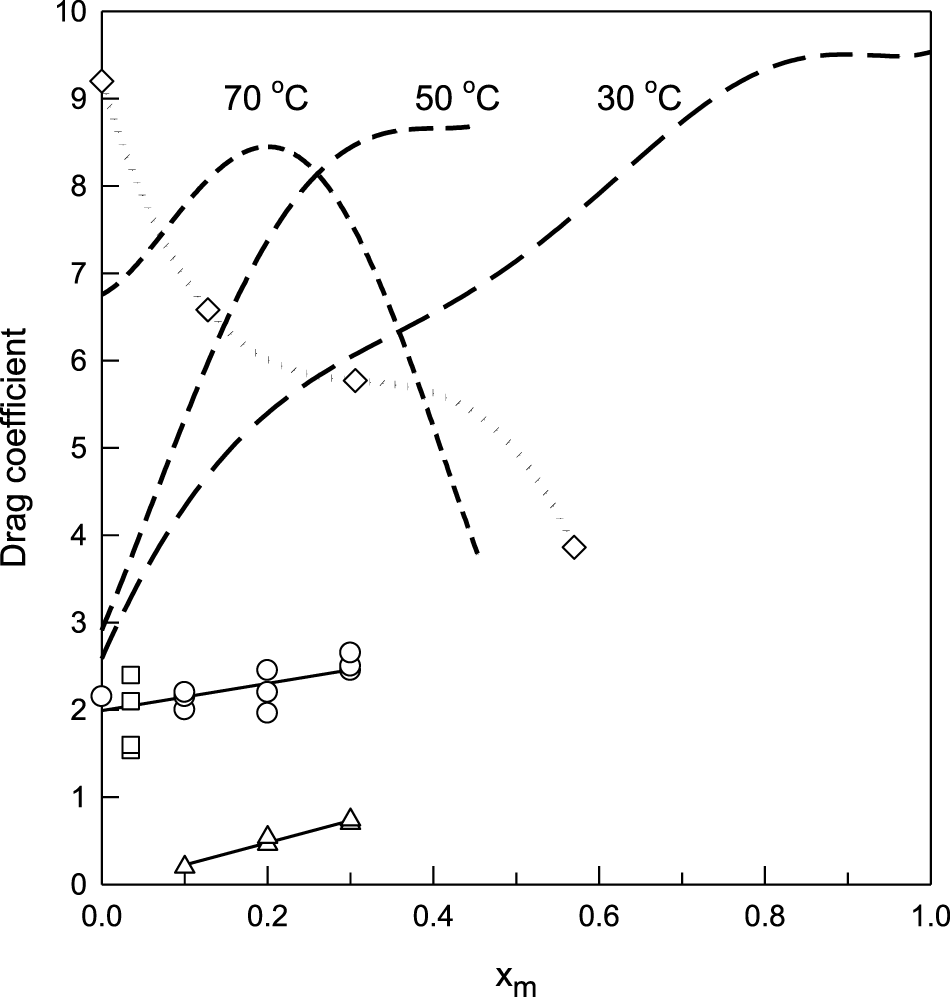
Electro-osmotic drag coefficient of water–methanol mixtures in Nafion 117 membranes as a function of composition. Dashed lines represent the total drag factor at 30, 50, and 70°C from Tschinder et al., 2007; (○) at 25°C from Hallberg et al., 2010, (□) at 30 and 60°C from Chi et al., 2013, (◇) at 25°C for the K+ form from Barragan et al, 2005, and (∆) methanol drag factor at 25°C from Hallberg et al, 2010.
A new in situ study of the transport of methanol in Nafion membranes was performed by Hallberg et al. (Hallberg et al., 2010) using an electrophoretic NMR method, which allows separating the methanol contributions to the total drag factor. The results, also depicted in Figure 1, exhibit a rather different behavior than those by Tschinder et al. (Schaffer et al., 2006; Tschinder et al., 2007) on the limited concentration range (xm < 0.3) studied with the NMR technique. It can be observed that the increase of the drag factor with methanol concentration is much less pronounced, and the methanol contribution seems to be lower than that measured by Tschinder et al. (Schaffer et al., 2006; Tschinder et al., 2007).
A reverse DMFC configuration like that reported by Ren et al. (Ren et al., 2000) was used by Chi et al. (Chi et al., 2013) to study the electro-osmotic drag of 2 M CH3OH (xm = 0.035) aqueous solutions in Nafion 117 between 30 and 80°C. The calculated total drag coefficient, which is essentially due to water for this low methanol concentration, increases from 1.54 at 30°C up to 2.4 at 50°C, but it decays to 1.6 at 60°C (see Figure 1).
There are no further studies of the electro-osmotic flow of water–methanol mixtures in Nafion, except for those reported by the group of Barragan (Barragán et al., 2004a; Barragán et al., 2004b; Barragan et al., 2005) that measured the electro-osmotic permeability, W in Eq. 1, of water–methanol mixtures in Nafion membranes in the K+ form at 25°C. When converted to electro-osmotic drag coefficients, the results exhibit a composition dependence that is opposite to that observed for the H+-form: the electro-osmotic drag decreases as the methanol concentration increases. Even when the properties of the K+ form of Nafion 117 are quite different from those of the H+ form used in DMFCs, we will discuss these results later in relation to our findings.
Theoretical studies provide an alternative insight into the electro-osmotic drag factor of water and methanol in Nafion. Ji et al. (Ji et al., 2008) concluded, by molecular dynamics (MD) simulations of the diffusion of water and methanol in oligomers of perfluorosulfonic acid (similar to Nafion), that the electro-osmotic drag coefficient of methanol (ξ ≈ 0.07–0.16) is much smaller than that of water (ξ ≈ 4.0–5.3). The simulation runs correspond to a methanol solution of xm = 0.105, and consequently, the MD results seem to agree qualitatively with those reported by Tschinder et al. (Tschinder et al., 2007).
In summary, the results reported in the literature for the electro-osmotic flow of water–methanol solutions through Nafion exhibit large incongruences that are evident by a simple inspection of Figure 1. Thus, the main goal of this study is to provide new experimental evidence that helps to improve the electro-osmotic drag description of these mixtures, which are relevant to the modeling and operation of DMFCs.
We determined the electro-osmotic flow of methanol–water mixtures through a Nafion 117 membrane on the entire composition range, from pure water to pure methanol, at different temperatures in the interval of 25–60°C. The method used is the two-compartment capillary cell (TCCC), the most used for these systems, and it was first used by Zawodzinski et al. (Zawodzinski et al., 1993a; Zawodzinski et al., 1993b) for electro-osmosis studies of water in Nafion and later by Meier and Eigenberger (Meier and Eigenberger, 2004), Barragan et al. (Barragán et al., 2004a; Barragán et al., 2004b; Barragan et al., 2005), and Pivovar et al. (Pivovar et al., 2005). The results shed some light on the composition and temperature dependence of the electro-osmotic flow of water–methanol through Nafion.
Experimental
Chemicals
Methanol (Merck) and hydrochloric acid 35% (Sigma Aldrich) were used as received. All aqueous solutions were prepared with water purified (specific resistivity 18 MΩ.cm) with Pro Equipo Arium (Sartorius) and degassed using high-purity N2 (Indura S.A.).
Nafion® 117 (Ion Power) membranes (EW 1100 g.eq−1, thickness 118 μm) were pretreated as described elsewhere (Diaz et al., 2012). The membranes were washed in H2O2 3% w/w at 80°C for 1 h, then rinsed in boiling water for 1 h, and immersed in 1 M H2SO4 at 80°C. Finally, they were rinsed again in boiling water for 1 h.
We have used aqueous HCl as the acid media in contact with the Nafion membrane for two reasons: 1) the preparation of an acidic pure methanol solution is simpler from gaseous HCl than from liquid H2SO4 or H3PO4 and 2) the two-compartment capillary cell used in this work requires electrodes reversible to the anion of the acid, and the Ag/AgCl electrodes are simpler to prepare and are more reproducible than electrodes reversible to sulfate or phosphate ions.
A stock solution of HCl in methanol was prepared following a procedure described in the literature (Arnáiz, 1995). Aqueous HCl (35% w/w) was poured in a flask containing CaCl2, which was previously dried in an oven at 80°C for 12 h. The stream of gaseous anhydrous HCl exits the flask through a lateral tube and bubbles into anhydrous methanol (0.8 ppm of water determined by Karl Fisher titration) contained in a vessel under a dry nitrogen atmosphere. The stock solution was titrated using a standardized NaOH solution. Finally, an aliquot of the stock solution was diluted with anhydrous methanol to prepare a 0.5 molal methanolic HCl solution used in the electro-osmotic experiments. HCl solutions in methanol–water mixtures were prepared by mixing the corresponding masses of pure methanol and the stock aqueous HCl solution previously titrated using standardized NaOH aqueous solutions. Thus, HCl solutions (0.5 molal) were prepared with methanol (working compositions), in addition to the 0.5 m HCl solutions in pure methanol and pure water.
The Ag/AgCl electrodes used in the electro-osmosis cell were prepared by the procedure described by Ives and Janz (Ives and Janz, 1961). Silver oxide (Ag2O) was prepared by adding NaOH to an AgNO3 aqueous solution, and the solid oxide, thoroughly washed with water to remove the excess alkali, was filtered and mixed with water to form a paste that was deposited on a wounded Ag wire, forming a spherical electrode approximately 6 mm in diameter. The silver oxide covering the Ag wire was first dried by heating in an oven for 1 h and then reduced to metallic Ag by heating at 450°C for 30 min. The spongy metallic Ag was finally anodized in 2 M HCl to convert it partially into AgCl.
The Electro-Osmosis Cell and Measurement Protocol
The TCCC used in this work is schematized in Figure 2. The cell, built with plexiglass (A), has two compartments with volumes around 22 cm3, separated by the membrane (B), which is kept in position with perforated plates (C). Thus, the possible bend or deformation of the membrane, whose exposed area is 2.5 cm2, is prevented. Silicone o'rings (D) on each side are compressed with five bolts (E) to seal the assembly avoiding solution leakages. Ag/AgCl electrodes (F) are used to drive a constant current through the HCl solution in the water–methanol mixture (G). Concentration gradients within the solutions are avoided by using magnetic bars (H) as stirrers. The solutions are introduced into the compartments through two septa (I), and the volume change as a function of time is determined by following the position of the meniscus in the calibrated capillary tube (J) with a cross area of 1.31 mm2.
FIGURE 2
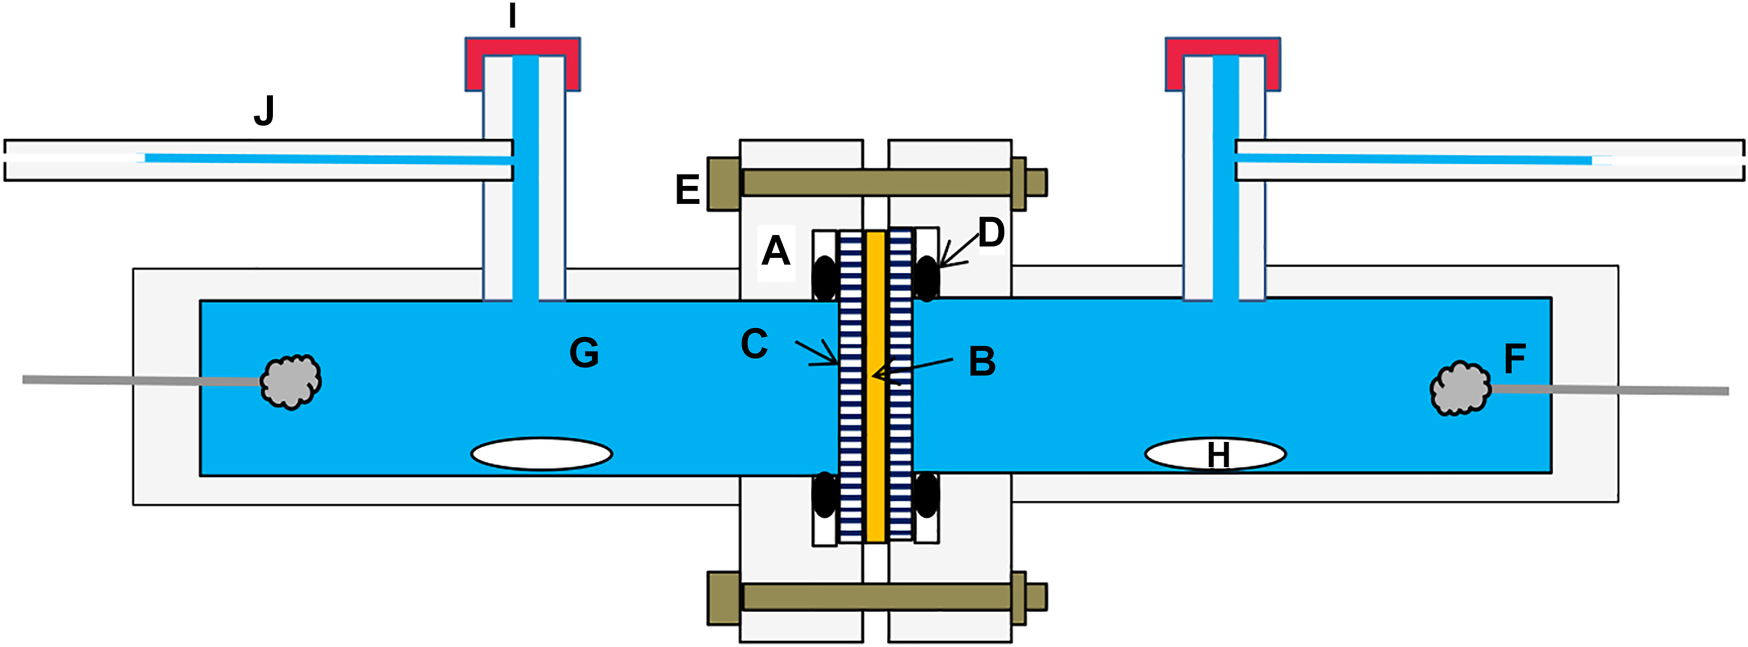
Scheme of the electro-osmotic cell. A, plexiglass cell; B, membrane; C, perforated plate; D, o’ring; E, bolt; F, Ag/AgCl electrode; G, HCl solution; H, stirrer; I, septum; J, capillary tube.
Previous to each experiment, the Nafion membrane was immersed for 24 h in the corresponding solution to assure sorption equilibrium. After that, the membrane was mounted in the cell, and both compartments were filled with the same solution through the septa located on each side. The cell is then placed in an airbox having an infrared lamp (General Electric, 150 W, 240 V) as a heater, a platinum temperature sensor (PT100), an air fan, and a PID temperature controller (Electrargen). This setup allowed a temperature control ≈ ± 0.1 K per °C in the range between 25°C and 60°C.
Once the temperature became stable, the cell electrodes were polarized with a potentiostat–galvanostat Autolab PGSTAT302N (Echochemie) in the galvanostatic mode, with currents between 0.9 and 2.0 mA. The experiments were run during variable intervals, which can reach up to 100 min. A typical measurement consists of four to five cycles, and the polarity of the electrodes was inverted after each cycle to avoid the depletion of the AgCl layer on the cathodic electrode.
The liquid displacement is measured at intervals of 200–400 s on a millimetric scale located behind the capillary tube by resorting to a 10× magnification lens. The accuracy in the displacement of the liquid was ±0.1 mm, which is equivalent to a volume error of around 1.3 μL.
The proper performance of the electro-osmotic cell and membrane integrity was checked by observing the liquid displacement on each side. An example is shown in Supplementary Figure S1 of Supplementary Information for a run in a solution with methanol mole fraction xm = 0.44 at 40°C. The linear behavior of the solution volume changes with time is maintained all over the experiment, and it is approximately the same in the anodic and cathodic compartments, except for small differences due to the volume corrections that need to be applied by the volume changes of the Ag/AgCl electrodes, and of the water–methanol solutions because of the small changes in HCl concentration due to the electrode processes:
Cathode: AgCl (s) + e = Ag (s) + Cl− (sln)
Anode: Ag (s) + Cl− (sln) = AgCl (s)
The corresponding volume corrections are as follows:where I is the current through the membrane, F is the Faraday constant, and VAg and VAgCl are the molar volumes of pure Ag and AgCl, respectively, and VHCl(sln) is the partial molar volume of HCl in the solution, which is assumed to be the value at the initial concentration. The calculation of the volume correction is described in Supplementary Section S1 of the Supplementary Information, and it is concluded that its magnitude is close to the experimental error in the measurement of the volume change.
The electro-osmotic flux of the solvent (Eq. 3) for water, methanol, or their mixtures can be calculated from the corrected volume, V = Vm–ΔV, where Vm is the measured volume change after a time t, as follows:where ρ is the density of the solution, M is the mean molecular weight of the solvent [M = 32.04 xm + 18.015 (1–xm)], A is the membrane area, and i is the current density. The derivation of Eq. 6 assumes that the diffusion term in Eq. 3 is negligible because the HCl concentration gradient through the membrane during the experiment is very small.
Results and Discussion
Electro-Osmotic Drag Coefficient of Water
Several authors have determined the electro-osmotic flow of water in Nafion membranes by resorting to different methods. The results are summarized in Supplementary Table S1 of Supplementary Information, where the type of membrane, the experimental temperature, and the water uptake expressed as moles of water per ionic group (λ) are also indicated since the drag coefficient is sensitive to the water content of the membrane that determines the size of the nanochannels.
The drag coefficients of water in Nafion 117 measured in this work as a function of temperature are compared with the results reported in the literature in Figure 3. The measured ξ using the TCCC is much higher than those reported for Nafion 117 using the hydrogen pump technique (Luo et al., 2010), a direct methanol MEA (Ren et al., 1997), electrophoretic NMR (Ise et al., 1999), and a hydrogen PEM (Ge et al., 2006), even in the case where the Nafion water content is similar to that of the fully hydrated membranes (λ ≈ 22) (Ren et al., 1997; Luo et al., 2010). This apparent disagreement is related to the fact that in these techniques, the membrane is in contact with pure water, while in the TCCC technique, the membrane is in contact with an acid aqueous solution.
FIGURE 3
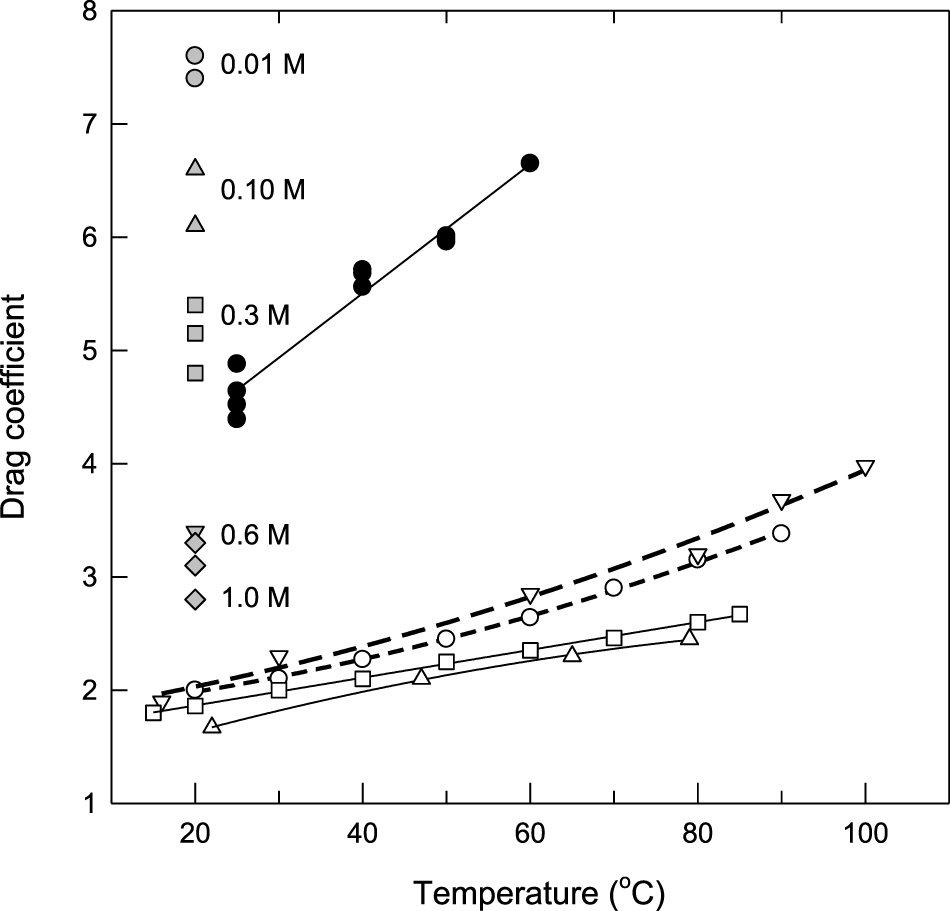
Electro-osmotic drag coefficient of water in Nafion membranes as a function of temperature: (=) this work, (°C) λ = 22 (Ren et al, 1997), (□) λ = 22.5 (Luo et al, 2010), (∆) λ = 13 (Ise et al, 1999), and (◊) λ = 16.8 (Ge et al, 2006). The gray symbols correspond to the data by Pivovar et al. (Pivovar et al., 2005) for Nafion 117 in the presence of aqueous HCl at the indicated concentrations.
To confirm this assumption, we plotted in Figure 3 the results of the electro-osmotic drag coefficient of water determined by Pivovar et al. (Pivovar et al., 2005) using the same technique at room temperature and several HCl concentrations. It is observed that ξ changes strongly with the acid concentration and our data at 25°C lie in the region expected for a 0.5 M HCl solution. Why the drag coefficient diminishes when the acid concentration in the external solution increases is a question addressed by Pivovar et al. (Pivovar et al., 2005) by resorting to the presence of free anionic species that change the radial distribution of the charge carriers (Yang and Pintauro, 2000). However, the fraction of charge transported by the chloride ion in Nafion 117 is no more than 2–3% at concentrations close to 0.5 M, as expected by Donnan exclusion, so it is not clear why ξ decreases abruptly from ≈7 at 0.01 M down to ≈3 at 0.6 M. Although there are no data for the water sorption of Nafion equilibrated with aqueous HCl as a function of the acid concentration, the results for the sorption of water in NaCl solutions seem to indicate an important decrease of the water content in the membrane as the osmotic pressure of the equilibrating solution increases (Izquierdo-Gil et al., 2020).
In order to provide a reliable comparison of the electro-osmotic drag factor of the water–methanol mixtures, all the measurements were performed at the same HCl concentration (0.5 molal).
Electro-Osmotic Drag Coefficients of Water–Methanol Mixtures and Pure Methanol as a Function of Temperature
The complete set of electro-osmotic drag coefficient data for all the mixtures and temperatures studied is summarized in Figure 4. Duplicates and even triplicates are plotted for almost all the points to visualize the reproducibility of the measurements.
FIGURE 4
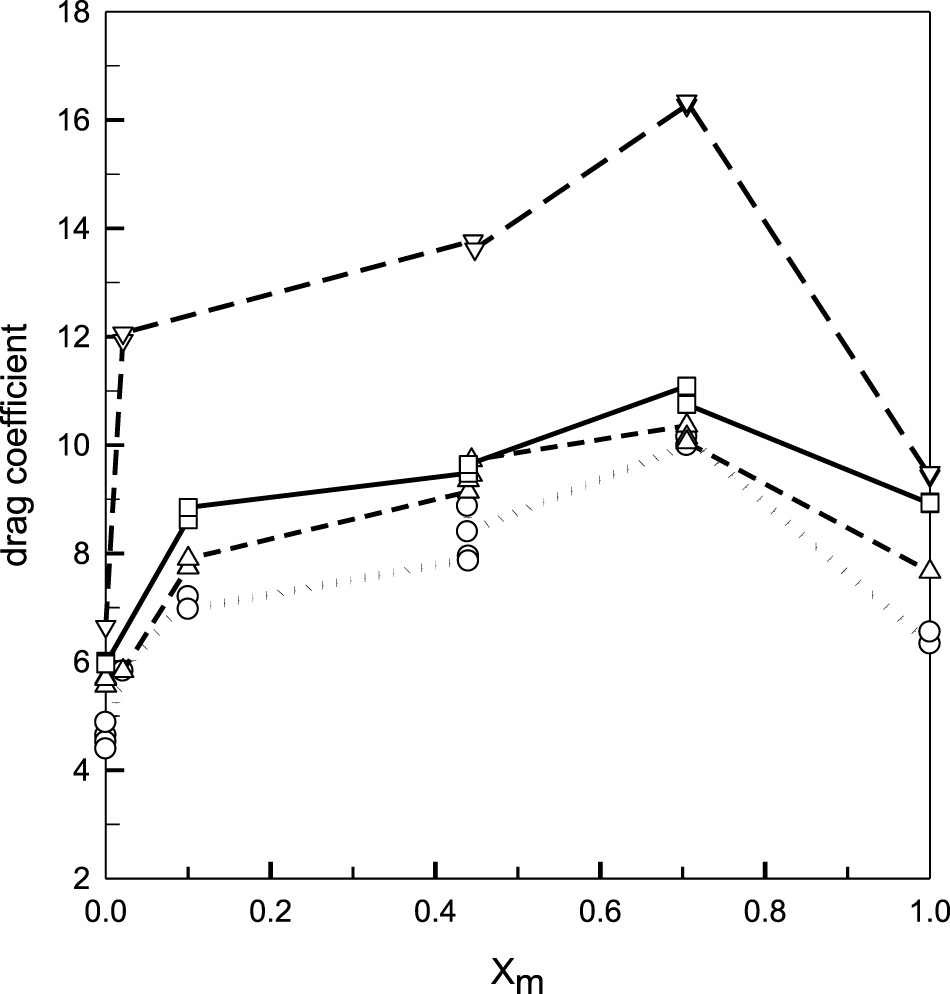
Total drag coefficient as a function of methanol concentration at different temperatures: (ο) 25°C, (Δ) 40°C, (□) 50°C, and (∇) 60°C. The lines are just a guide for the eyes.
Several conclusions emerge from the whole behavior depicted in Figure 4. First, the drag coefficients for pure methanol in Nafion 117 are higher than those for pure water on the temperature interval studied, as indicated in Table 1, where the average values of are summarized. The ratio is close to 1.4 in the range of 25–60°C, indicating that the electro-osmotic drag is more efficient for methanol as compared to water when Nafion 117 is fully solvated with alcohol. This is expected because of the large swelling of Nafion in methanol in relation to water, which in turn determines the high permeability of methanol in Nafion (Diaz et al., 2012).
TABLE 1
| Electro-osmotic drag factor (ξ) | ||||
|---|---|---|---|---|
| Temperature | 25°C | 40°C | 50°C | 60°C |
| Water | 4.61 | 5,65 | 5.98 | 6.65 |
| Methanol | 6.44 | 7.66 | 8.94 | 9.46 |
Electro-osmotic drag factor, ξ, for pure water and methanol in Nafion 117 at several temperatures.
Thus, the observed electro-osmotic drag of methanol in Nafion would be the consequence of expanded nanocylindrical micelles (Schmidt-Rohr and Chen, 2008) when methanol replaces water and not for a stronger solvation of the H+ in methanol. More importantly, our results contradict the finding of MD simulation, which predicted that the electro-osmotic drag of methanol would be much smaller than that of water. However, it should be noted that the simulations correspond to a relatively diluted aqueous methanol solution (xm = 0.105), and most of the H+ could be solvated with water instead of methanol. If this is the case, the disagreement with our findings is only apparent.
It can be observed that the temperature dependence of the drag coefficient of methanol does not exhibit a maximum at any composition, as suggested by Chi et al. (Chi et al., 2013), for water–methanol mixtures rich in water (xm = 0.035) but increases between 25 and 60°C at all the compositions, nor do they show the complex temperature behavior observed by Tschinder et al. (Tschinder et al., 2007), where there is an abrupt increment of ξ above 50°C in the water-rich region (Figure 1), but at 70°C, it suddenly decreases for xm > 0.2. Instead, our results show a monotonous increment of the drag coefficient with temperature all over the temperature range, which is more pronounced above at 60°C.
Finally, the most notable concerning DMFC, is the large non-linearity observed in the concentration dependence of ξ at all the temperatures studied. The total drag coefficient increases strongly after a small amount of methanol is added to water (xm < 0.1) and then increases smoothly until reaching a maximum close to xm = 0.7 and last decays to the values for pure methanol.
In fact, the electro-osmotic drag effect in pure methanol is lower than that observed for xm = 0.1, which corresponds to a ≈5 M aqueous methanol solution. Thus, provided that the methanol crossover by permeability can be reduced by managing the methanol balance in the anode, the work with pure methanol seems a plausible option.
For testing the validity of the former claim, we briefly reviewed the results reported for the performance of DMFCs fed with concentrated methanol aqueous solutions and pure methanol. Most of these studies were aimed to determine the role of the methanol concentration on the performance of DMFCs, taking as parameters methanol crossover and the maximum power density. These studies were performed at methanol concentrations lower than 5 M, corresponding to xm < 0.1. There are few studies at higher methanol concentrations or using neat methanol. Moreover, comparisons are usually difficult because of differences in the operation conditions, type of catalyst used, and mode of operation (active vs. passive).
In a couple of works (Li et al., 2016; Sebastián et al., 2017), the effect of methanol concentration on the DMFC performance in the range from 0.5 M up to 17 M was studied using Fe–N–C cathodic catalysts, with excellent tolerance to methanol, and compared with the Pt/C catalyst. Li et al. (Li et al., 2016) reported a decrease of the maximum power density using a Pt-free catalyst at 75°C. As the methanol concentration increases from 0.5 to 17 M (xm ≈ 0.5), the performance deterioration is particularly important above 8 M. A similar behavior is observed for the Pt/C catalyst, but the DMFCs have a very small power density at methanol concentrations above 2 M.
Baglio and co-workers (Sebastián et al., 2017) have carried out a similar study at temperatures between 30 and 110°C. They found that at 90°C, the maximum power density of the DMFCs decreases with the increasing methanol concentration from 1 M up to 10 M at 30 and 60°C, while it is almost constant with the methanol concentration at 90°C. For the highest methanol concentration (17 M), they only reported data at 110°C, with the maximum power density close to 60 mW/cm2, which is similar to that measured for the same cathodic catalyst at 90°C with 10 M methanol.
Feng et al. (Feng et al., 2017) also observed a steady decrease of the maximum power density of DMFCs as the methanol concentration rises from 2 M up to 15 M with the Pt/C catalyst at 80°C. If Au@Ag2S@Pt and Au@Pd are used as anodic and cathodic catalysts, respectively, the decrease of performance of the cell occurs above 10 M.
These results can be explained, in part, by the increases in the electro-osmotic flow of methanol in the region of 0.1 < xm < 0.5, as shown in Figure 4. Methanol’s permeability by concentration gradients could also contribute to this behavior, particularly when a Pt/C catalyst is used in the cathode.
However, the key question is what occurs when pure methanol is used as a fuel? Wu et al. (Wu et al., 2014) studied a passive DMFC with conventional Pt–Ru (anode) and Pt (cathode) electrodes and fed with a methanol concentration between 18 M (xm ≈ 0.52) and 24.7 M (neat methanol, xm = 1) at 15–17°C. They observed an increase in peak power density from 16.7 to 20.3 mW cm−2, when the concentration increased from 18 M to pure methanol. Nakagawa et al. (Nakagawa et al., 2012) reported the results for an active DMFC using the same electrodes and methanol with concentrations between 70 wt% (xm = 0.57) and 100 wt% at 65°C, where the maximum power density increases from 30 to 40 mW.cm−2 with the methanol concentration. Remarkably, the range of methanol concentrations covered in these two works corresponds to the region in Figure 4 where the electro-osmotic flow decreases with increasing methanol concentration, supporting our claim that the use of pure methanol would lead to better performance under operation conditions where the electro-osmotic drag is mainly responsible for methanol crossover.
The rationale behind the behavior depicted in Figure 4 is complex because of changes in the nanostructure of the Nafion membrane, the selective solvation of H+ by water and methanol, and changes in the mechanism of H+ conduction (vehicular vs. Grotthuss) involved. An MD simulation of the sandwich Nafion model in water–methanol (Abroshan et al., 2011) revealed that the presence of a small amount of methanol molecules (even xm = 0.03) significantly affects the water distribution, with the methanol distribution more specific than that of water in nanochannels as well. This could be the cause of the rapid increase in the electro-osmotic drag with the methanol concentration.
A phenomenological explanation of the non-linearity of the drag coefficient vs. methanol mole fraction could be found in the behavior of the water–methanol sorption in Nafion 117. Solvent (water + methanol) sorption maxima were observed as a function of the solvent composition for xm ≈ 0.7–0.8.7,81 Diaz et al. (Jung et al., 2011; Diaz et al., 2012) determined the composition of the sorbed mixture in the Nafion membranes and found that the partition of methanol and water in Nafion with respect to the external solution is highly asymmetric, as shown in Figure 5. It is observed that the methanol concentration in the membrane increases sharply, while the water concentration decreases slowly as the methanol mole fraction in the solution increases from 0 up to 0.4. Above xm = 0.5, an abrupt decrease in the water content is observed, while the methanol concentration reaches a plateau. Because of this sorption behavior at xm > 0.8 in the solution, the amount of water within the membrane is negligible. Therefore, one is tempted to think that the decrease of the electro-osmotic drag factor in this region is driven by the higher partition coefficient of methanol between the membrane and the solution compared to water.
FIGURE 5
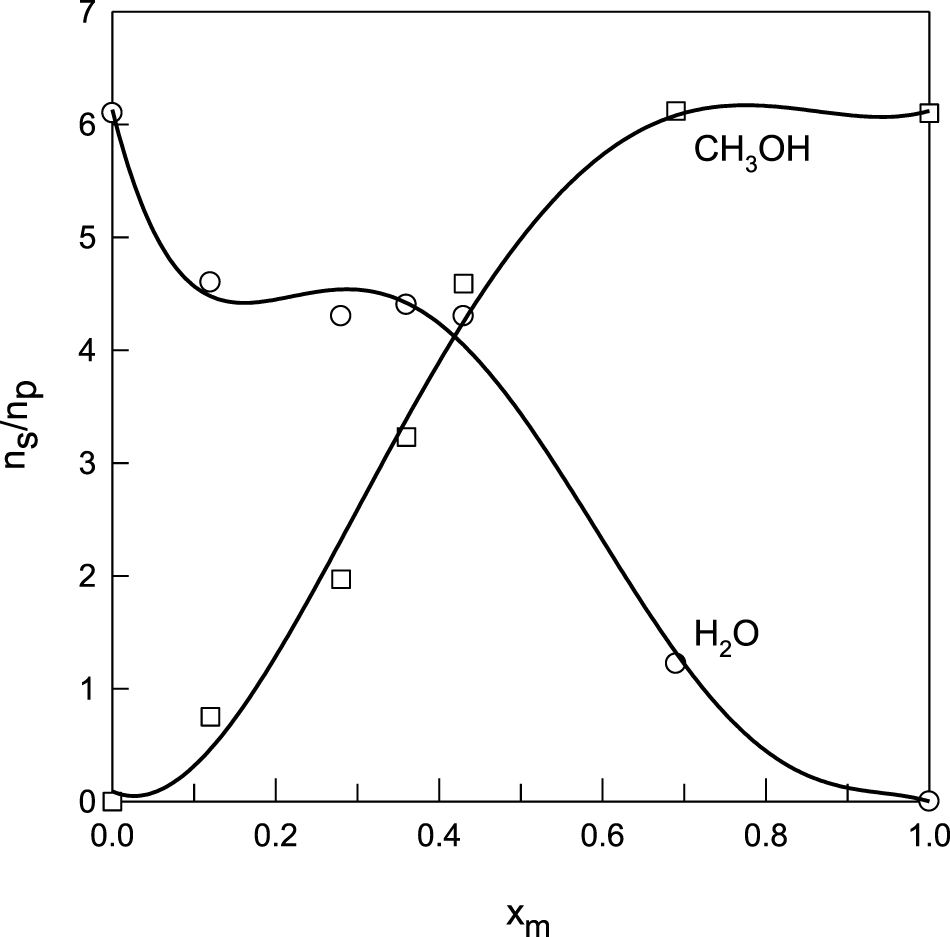
Sorption of water and methanol in Nafion, expressed as moles of solvent per mole of polymer, as a function of the solvent composition. Data from Diaz et al, 2012.
Even when at xm ≈ 0.7, there are approximately five methanol molecules per water molecule in the membrane, protons are preferentially solvated by molecules of water, and the vehicular mechanism of proton conduction, which is responsible for the electro-osmotic drag, is enhanced due to the loss of the hydrogen bond network in the methanol-rich region.
Finally, it is worth mentioning that the conclusion, coming from experimental and simulations studies of the electro-osmotic drag factor in the water-rich region, that the electro-osmotic drag factor is much lower than that of water (Ji et al., 2008; Hallberg et al., 2010), is only valid when the relative contribution of water and methanol in the membrane is considered. Regarding the opposite tendency observed for the electro-osmotic drag coefficient of water–methanol in Nafion in the K+ form (Barragan et al., 2005), it is probably related to a change of the Nafion nanostructure when H+ is replaced with a less solvated cation and mainly to the fact that the solvation by methanol is much weaker than that by water for K+ ions.
Conclusion
We have measured the electro-osmotic drag factor of water–methanol mixtures through Nafion 117 membranes all over the composition range, from pure water to pure methanol, at temperatures between 25 and 60°C, by resorting to the two-compartment capillary cell technique. Since the drag coefficient is strongly dependent on the acid concentration in the solution, we have performed all the measurements at the same concentration of HCl in the solution. The measured drag coefficient for pure water is higher than that reported by previous studies using techniques where the Nafion membrane is in contact with pure water but agrees with the data reported in the HCl aqueous solution at similar concentrations.
The drag coefficient for pure methanol is roughly 40% higher than that for pure water, obeying the more expanded structure of the Nafion swollen by methanol. The electro-osmotic drag in water–methanol mixtures exhibits a marked non-linearity, reaching a maximum at xm ≈ 0.7 at all the temperatures. This behavior was rationalized by analyzing the asymmetric sorption features of Nafion in water–methanol mixtures. The discrepancies of our results with previous results for the water–methanol electro-osmotic flow were also addressed.
Regarding the impact of these results concerning the operation of DMFCs, we claim that the lower electro-osmotic flow of methanol in pure methanol as compared with methanol solutions of intermediate concentrations would improve the performance of DMFCs where the electro-osmotic drag predominates over other processes, a fact that has been validated by analyzing the few studies where the performance of DMFCs have been determined over an extended range of methanol concentrations, including neat methanol.
Statements
Data availability statement
The original contributions presented in the study are included in the article/Supplementary Material, further inquiries can be directed to the corresponding author.
Author contributions
All the authors listed have made a substantial, direct, and intellectual contribution to the work and approved it for publication.
Funding
This work was funded by the Agencia Nacional de Promoción Cientifica y Tecnológica (Argentina) through the PICT 2013-1818 and the Natural Sciences and Engineering Research Council of Canada, Discovery Grant Program RGPIN/371933-2011.
Acknowledgments
The authors thank Agencia Nacional de Promoción Cientifica y Tecnológica for financial support (PICT 2013-1818) and the Natural Sciences and Engineering Research Council of Canada, Discovery Grant Program (RGPIN/371933-2011). HRC is a member of CONICET. The authors acknowledge Yessika Hernandez for helping us with the preparation of the solutions and her collaboration in the electro-osmotic measurements.
Conflict of interest
The authors declare that the research was conducted in the absence of any commercial or financial relationships that could be construed as a potential conflict of interest.
Publisher’s note
All claims expressed in this article are solely those of the authors and do not necessarily represent those of their affiliated organizations or those of the publisher, the editors, and the reviewers. Any product that may be evaluated in this article or claim that may be made by its manufacturer is not guaranteed or endorsed by the publisher.
Supplementary material
The Supplementary Material for this article can be found online at: https://www.frontiersin.org/articles/10.3389/fenrg.2022.855333/full#supplementary-material
Abbreviations
ΔVa, cathode correction volume change; ΔVa, anode correction volume change; λ, water uptake (moles of water per ionic group); ξ, electro-osmotic drag coefficient; ρ, density of the solvent; A, membrane area; dc/dz, methanol concentration gradient; F, Faraday constant; I, current; i, current density; J, net flow of methanol; JV, mass flow of the solvent; M, molecular weight of the solvent; ns, number of solvent moles; nH+, number of hydrogen moles; P, methanol permeability; t, time; xm, methanol molar fraction in the solution; , molar volume of component i; , partial molar volume of component i; W, electro-osmotic permeability.
References
1
Abouzari-lotf E. Nasef M. M. Ghassemi H. Zakeri M. Ahmad A. (2015). Improved Methanol Barrier Property of Nafion Hybrid Membrane by Incorporating Nanofibrous Interlayer Self-Immobilized with High Level of Phosphotungstic Acid. ACS Appl. Mater. Inter.7, 17008. 10.1021/acsami.5b02268
2
Abroshan H. Akbarzadeh H. Taherkhani F. Parsafar G. (2011). Effect of Water-Methanol Content on the Structure of Nafion in the sandwich Model and Solvent Dynamics in Nano-Channels; a Molecular Dynamics Study. Mol. Phys.109, 709–724. 10.1080/00268976.2010.549846
3
Arnáiz F. (1995). A Convenient Way to Generate Hydrogen Chloride in the Freshman Lab. J. Chem. Educ.72, 1139. 10.1021/ed072p1139
4
Bae B. Ha H. Y. Kim D. (2005). Preparation and Characterization of Nafion/poly(1-Vinylimidazole) Composite Membrane for Direct Methanol Fuel Cell Application. J. Electrochem. Soc.152, A1366–A1372. 10.1149/1.1926668
5
Barbora L. Singh R. Shroti N. Verma A. (2010). Synthesis and Characterization of Neodymium Oxide Modified Nafion Membrane for Direct Alcohol Fuel Cells. Mater. Chem. Phys.122, 211–216. 10.1016/j.matchemphys.2010.02.036
6
Barragan V. M. Ruiz-Bauza C. Garcia Villaluenga J. P. Seoane B. (2005). Simultaneous Electro-Osmotic and Permeation Flows through a Nafion Membrane - 2. Methanol-Water Electrolyte Solutions. J. Colloid Interf. Sci288, 540. 10.1016/j.jcis.2005.03.019
7
Barragán V. M. Ruíz-Bauzá C. Villaluenga J. P. G. Seoane B. (2004a). Simultaneous Electro-Osmotic and Permeation Flows through a Nafion Membrane. 1. Aqueous Electrolyte Solutions. J. Colloid Interf. Sci.277, 176. 10.1016/j.jcis.2004.04.066
8
Barragán V. M. Ruiz C. Villaluenga J. P. G. Seoane B. (2004b). On the Methanol-Water Electroosmotic Transport in a Nafion Membrane. J. Membr. Sci.236, 109–120. 10.1016/j.memsci.2003.12.033
9
Bauer F. Willert-Porada M. (2005). Characterisation of Zirconium and Titanium Phosphates and Direct Methanol Fuel Cell (DMFC) Performance of Functionally Graded Nafion(R) Composite Membranes Prepared Out of Them. J. Power Sourc.145, 101–107. 10.1016/j.jpowsour.2005.01.063
10
Brandão L. Rodrigues J. Madeira L. M. Mendes A. (2010). Methanol Crossover Reduction by Nafion Modification with Palladium Composite Nanoparticles: Application to Direct Methanol Fuel Cells. Int. J. Hydrogen Energ.35, 11561. 10.1016/j.ijhydene.2010.04.096
11
Chi N. T. Q. Bae B. Kim D. (2013). Electro-Osmotic Drag Effect on the Methanol Permeation for Sulfonated Poly(Ether Ether Ketone) and Nafion117 Membranes. J. Nanosci. Nanotech.13, 7529–7534. 10.1166/jnn.2013.7894
12
Choi J. Kim I. T. Kim S. C. Hong Y. T. (2005). Nafion-sulfonated Poly(arylene Ether Sulfone) Composite Membrane for Direct Methanol Fuel Cell. Macromol. Res.13, 514–520. 10.1007/bf03218489
13
Choi S. W. Fu Y.-Z. Ahn Y. R. Jo S. M. Manthiram A. (2008). Nafion-impregnated Electrospun Polyvinylidene Fluoride Composite Membranes for Direct Methanol Fuel Cells. J. Power Sourc.180, 167–171. 10.1016/j.jpowsour.2008.02.042
14
Corti H. R. (2014). “Membranes for Direct Alcohol Fuel Cells,” in Membranes for Direct Alcohol Fuel Cells” in Direct Alcohol Fuel Cells. Materials, Performance, Durability and Applications. Editors CortiH. R.GonzalezE. R. (Springer), 121–230. 10.1007/978-94-007-7708-8_6
15
de Groot S. R. (1952). Thermodynamic of Irreversible Processes. Amsterdam: North-Holland Publishing.
16
DeLuca N. W. Elabd Y. A. (2006). Polymer Electrolyte Membranes for the Direct Methanol Fuel Cell: a Review. J. Polym. Sci. B Polym. Phys.44, 2201–2225. 10.1002/polb.20861
17
Diaz L. A. Abuin G. C. Corti H. R. (2012). Methanol Sorption and Permeability in Nafion and Acid-Doped PBI and ABPBI Membranes. J. Membr. Sci.411-412, 35–44. 10.1016/j.memsci.2012.04.013
18
Feng Y. Liu H. Yang J. (2017). A Selective Electrocatalyst-Based Direct Methanol Fuel Cell Operated at High Concentrations of Methanol. Sci. Adv.3, e1700580. 10.1126/sciadv.1700580
19
Fuller T. F. Newman J. (1992). Experimental Determination of the Transport Number of Water in Nafion 117 Membrane. J. Electrochem. Soc.139, 1332–1337. 10.1149/1.2069407
20
García B. L. Sethuraman V. A. Weidner J. W. Dougal R. White R. E. (2004). Mathematical Model of a Direct Methanol Fuel Cell. J. Fuel Cel Sci. Techn.1, 43. 10.1115/1.1782927
21
Garnica Rodriguez J. I. Dicks A. L. Duke M. C. Diniz da Costa J. C. (2006). Silica Nafion Modified Composite Membranes for Direct Methanol Fuel Cells. Dev. Chem. Eng. Miner. Process.14, 119. 10.1002/apj.5500140109
22
Ge S. Yi B. Ming P. (2006). Experimental Determination of Electro-Osmotic Drag Coefficient in Nafion Membrane for Fuel Cells. J. Electrochem. Soc.153, A1443–A1450. 10.1149/1.2203934
23
Hallberg F. Vernersson T. Pettersson E. T. Dvinskikh S. V. Lindbergh G. Furó I. (2010). Electrokinetic Transport of Water and Methanol in Nafion Membranes as Observed by NMR Spectroscopy. Electrochimica Acta55, 3542–3549. 10.1016/j.electacta.2010.01.064
24
Hasani-Sadrabadi M. M. Dashtimoghadam E. Majedi F. S. Kabiri K. (2009). Nafion/bio-functionalized Montmorillonite Nanohybrids as Novel Polyelectrolyte Membranes for Direct Methanol Fuel Cells. J. Power Sourc.190, 318–321. 10.1016/j.jpowsour.2009.01.043
25
Hosseinpour M. Sahoo M. Ross Baylis S. Patel F. Holmes S. M. (2019). Improving the Performance of Direct Methanol Fuel Cells by Implementing Multilayer Membranes Blended with Cellulose Nanocrystals. Int. J. Hydrogen Energ.44, 30409. 10.1016/j.ijhydene.2019.09.194
26
Ise M. Kreuer K. D. Maier J. (1999). Electroosmotic Drag in Polymer Electrolyte Membranes: an Electrophoretic NMR Study. Solid State Ionics125, 213–223. 10.1016/s0167-2738(99)00178-2
27
Ives D. J. G. Janz G. J. (1961). Reference Electrodes, Theory and Practice. 1st ed. London: Academic Press.
28
Izquierdo-Gil M. A. Villaluenga J. P. G. Muñoz S. Barragán V. M. (2020). The Correlation between the Water Content and Electrolyte Permeability of Cation-Exchange Membranes. Ijms21, 5897. 10.3390/ijms21165897
29
Ji X. Yan L. Zhu S. Zhang L. Lu W. (2008). Methanol Distribution and Electroosmotic Drag in Hydrated Poly(perfluorosulfonic) Acid Membrane. J. Phys. Chem. B112, 15616–15627. 10.1021/jp8066469
30
Jiang R. Kunz H. R. Fenton J. M. (2006). Composite silica/Nafion Membranes Prepared by Tetraethylorthosilicate Sol-Gel Reaction and Solution Casting for Direct Methanol Fuel Cells. J. Membr. Sci.272, 116–124. 10.1016/j.memsci.2005.07.026
31
Jiang S. P. Liu Z. Tang H. L. Pan M. (2006). Synthesis and Characterization of PDDA-Stabilized Pt Nanoparticles for Direct Methanol Fuel Cells. Electrochimica Acta51, 5721–5730. 10.1016/j.electacta.2006.03.006
32
Jin Y. Qiao S. Zhang L. Xu Z. P. Smart S. Costa J. C. D. d. et al (2008). Novel Nafion Composite Membranes with Mesoporous Silica Nanospheres as Inorganic Fillers. J. Power Sourc.185, 664–669. 10.1016/j.jpowsour.2008.08.094
33
Jung B. Moon H.-M. Baroña G. N. B. (2011). Effect of Methanol on Plasticization and Transport Properties of a Perfluorosulfonic Ion-Exchange Membrane. J. Power Sourc.196, 1880–1885. 10.1016/j.jpowsour.2010.09.030
34
Jung E. Jung U. Yang T. Peak D. Jung D. Kim S. (2007). Methanol Crossover through PtRu/Nafion Composite Membrane for a Direct Methanol Fuel Cell. Int. J. Hydrogen Energ.32, 903–907. 10.1016/j.ijhydene.2006.12.014
35
Kim Y. S. Pivovar B. S. (2007). “Polymer Electrolyte Membranes for Direct Methanol Fuel Cells,” in Polymer Electrolyte Membranes for Direct Methanol Fuel Cells” in Advances in Fuel Cells. Editors ZhaoT. S.KreuerK. D.Van NguyenT.Elsevier, 187–234. 10.1016/s1752-301x(07)80009-3
36
Kim S. Jang S. Kim S. M. Ahn C.-Y. Hwang W. Cho Y.-H. Sung Y.-E. (2017). Reduction of Methanol Crossover by Thin Cracked Metal Barriers at the Interface between Membrane and Electrode in Direct Methanol Fuel Cells. J. Power Sourc.363, 153.
37
Lee W. Kim H. Kim T. Chang H. (2007). Nafion Based Organic/inorganic Composite Membrane for Air-Breathing Direct Methanol Fuel Cells. J. Membr. Sci.292, 29–34. 10.1016/j.memsci.2006.12.051
38
Li Q. Wang T. Havas D. Zhang H. Xu P. Han J. et al (2016). High‐Performance Direct Methanol Fuel Cells with Precious‐Metal‐Free Cathode. Adv. Sci.3, 1600140. 10.1002/advs.201600140
39
Liang Z. X. Shi J. Y. Liao S. J. Zeng J. H. (2010). Noble Metal Nanowires Incorporated Nafion Membranes for Reduction of Methanol Crossover in Direct Methanol Fuel Cells. Int. J. Hydrogen Energ.35, 9182–9185. 10.1016/j.ijhydene.2010.06.054
40
Liang Z. X. Zhao T. S. Prabhuram J. (2006). Diphenylsilicate-incorporated Nafion Membranes for Reduction of Methanol Crossover in Direct Methanol Fuel Cells. J. Membr. Sci.283, 219–224. 10.1016/j.memsci.2006.06.031
41
Lin J. Lee J. K. Kellner M. Wycisk R. Pintauro P. N. (2006). Nafion-Flourinated Ethylene-Propylene Resin Membrane Blends for Direct Methanol Fuel Cells. J. Electrochem. Soc.153, A1325–A1331. 10.1149/1.2196687
42
Luo Z. Chang Z. Zhang Y. Liu Z. Li J. (2010). Electro-osmotic Drag Coefficient and Proton Conductivity in Nafion Membrane for PEMFC. Int. J. Hydrogen Energ.35, 3120–3124. 10.1016/j.ijhydene.2009.09.013
43
Ma C.-H. Yu T. L. Lin H.-L. Huang Y.-T. Chen Y.-L. Jeng U.-S. et al (2009). Morphology and Properties of Nafion Membranes Prepared by Solution Casting. Polymer50, 1764–1777. 10.1016/j.polymer.2009.01.060
44
Mauritz K. A. Moore R. B. (2004). State of Understanding of Nafion. Chem. Rev.104, 4535–4586. 10.1021/cr0207123
45
Mazzapioda L. Lo Vecchio C. Danyliv O. Baglio V. Martinelli A. Navarra M. A. (2020). Composite Nafion-CaTiO3-δ Membranes as Electrolyte Component for PEM Fuel Cells. Polymers12, 2019. 10.3390/polym12092019
46
Meier F. Eigenberger G. (2004). Transport Parameters for the Modelling of Water Transport in Ionomer Membranes for PEM-Fuel Cells. Electrochimica Acta49, 1731–1742. 10.1016/j.electacta.2003.12.004
47
Mondal S. Soam S. Kundu P. P. (2015). Reduction of Methanol Crossover and Improved Electrical Efficiency in Direct Methanol Fuel Cell by the Formation of a Thin Layer on Nafion 117 Membrane: Effect of Dip-Coating of a Blend of Sulphonated PVdF-Co-HFP and PBI. J. Membr. Sci.474, 140–147. 10.1016/j.memsci.2014.09.023
48
Nakagawa N. Tsujiguchi T. Sakurai S. Aoki R. (2012). Performance of an Active Direct Methanol Fuel Cell Fed with Neat Methanol. J. Power Sourc.219, 325–332. 10.1016/j.jpowsour.2012.07.062
49
Neburchilov V. Martin J. Wang H. Zhang J. (2007). A Review of Polymer Electrolyte Membranes for Direct Methanol Fuel Cells. J. Power Sourc.169, 221–238. 10.1016/j.jpowsour.2007.03.044
50
Nicotera I. Simari C. Coppola L. Zygouri P. Gournis D. Brutti S. et al (2014). Sulfonated Graphene Oxide Platelets in Nafion Nanocomposite Membrane: Advantages for Application in Direct Methanol Fuel Cells. J. Phys. Chem. C118, 24357–24368. 10.1021/jp5080779
51
Park H. Kim Y. Choi Y. S. Hong W. H. Jung D. (2008). Surface Chemistry and Physical Properties of Nafion/polypyrrole/Pt Composite Membrane Prepared by Chemical In Situ Polymerization for DMFC. J. Power Sourc.178, 610–619. 10.1016/j.jpowsour.2007.08.050
52
Parthiban V. Sahu A. K. (2020). Performance Enhancement of Direct Methanol Fuel Cells Using a Methanol Barrier boron Nitride–Nafion Hybrid Membrane. New J. Chem.44, 7338.
53
Pivovar B. S. Smyrl W. H. Cussler E. L. (2005). Electro-osmosis in Nafion 117, Polystyrene Sulfonic Acid, and Polybenzimidazole. J. Electrochem. Soc.152, A53–A60. 10.1149/1.1827599
54
Pivovar B. S. Wang Y. Cussler E. L. (1999). Pervaporation Membranes in Direct Methanol Fuel Cells. J. Membr. Sci.154, 155–162. 10.1016/s0376-7388(98)00264-6
55
Ramya K. Dhathathreyan K. S. (2008). Methanol Crossover Studies on Heat-Treated Nafion Membranes. J. Membr. Sci.311, 121–127. 10.1016/j.memsci.2007.12.001
56
Ren S. Sun G. Li C. Liang Z. Wu Z. Jin W. et al (2006). Organic silica/Nafion Composite Membrane for Direct Methanol Fuel Cells. J. Membr. Sci.282, 450–455. 10.1016/j.memsci.2006.05.050
57
Ren X. Henderson W. Gottesfeld S. (1997). Electro‐osmotic Drag of Water in Ionomeric Membranes: New Measurements Employing a Direct Methanol Fuel Cell. J. Electrochem. Soc.144, L267–L270. 10.1149/1.1837940
58
Ren X. Springer T. E. Zawodzinski T. A. Gottesfeld S. (2000). Methanol Transport through Nation Membranes. Electro-Osmotic Drag Effects on Potential Step Measurements. J. Electrochem. Soc.147, 466–474. 10.1149/1.1393219
59
Schaffer T. Tschinder T. Hacker V. Besenhard J. O. (2006). Determination of Methanol Diffusion and Electroosmotic Drag Coefficients in Proton-Exchange-Membranes for DMFC. J. Power Sourc.153, 210–216. 10.1016/j.jpowsour.2005.05.079
60
Schmidt-Rohr K. Chen Q. (2008). Parallel Cylindrical Water Nanochannels in Nafion Fuel-Cell Membranes. Nat. Mater.7, 75. 10.1038/nmat2074
61
Sebastián D. Serov A. Matanovic I. Artyushkova K. Atanassov P. Aricò S. et al (2017). Insights on the Extraordinary Tolerance to Alcohols of Fe-N-C Cathode Catalysts in Highly Performing Direct Alcohol Fuel Cells. Nano Energy34, 195. 10.1016/j.nanoen.2017.02.039
62
Shao Z.-G. Wang X. Hsing I.-M. (2002). Composite Nafion/polyvinyl Alcohol Membranes for the Direct Methanol Fuel Cell. J. Membr. Sci.210, 147–153. 10.1016/s0376-7388(02)00386-1
63
Shim J. H. Koo I. G. Lee W. M. (2005). Nafion-impregnated Polyethylene-Terephthalate Film Used as the Electrolyte for Direct Methanol Fuel Cells. Electrochimica Acta50, 2385–2391. 10.1016/j.electacta.2004.10.052
64
Su D. Y. Ma J. Pu H. K. (2014). The Research of Nafion/PTFE/inorganic Composite Membrane Used in Direct Methanol Fuel Cell. Amr881-883, 927–930. 10.4028/www.scientific.net/amr.881-883.927
65
Tang H. Pan M. Jiang S. Wan Z. Yuan R. (2005). Self-assembling Multi-Layer Pd Nanoparticles onto Nafion Membrane to Reduce Methanol Crossover. Colloids Surf. A: Physicochemical Eng. Aspects262, 65–70. 10.1016/j.colsurfa.2005.04.011
66
Tschinder T. Schaffer T. Fraser S. D. Hacker V. (2007). Electro-osmotic Drag of Methanol in Proton Exchange Membranes. J. Appl. Electrochem.37, 711–716. 10.1007/s10800-007-9304-6
67
Velayutham P. Sahu A. Parthasarathy S. (2017). A Nafion-Ceria Composite Membrane Electrolyte for Reduced Methanol Crossover in Direct Methanol Fuel Cells. Energies10, 259. 10.3390/en10020259
68
Wang C.-H. Chen C.-C. Hsu H.-C. Du H.-Y. Chen C.-P. Hwang J.-Y. et al (2009). Low Methanol-Permeable polyaniline/Nafion Composite Membrane for Direct Methanol Fuel Cells. J. Power Sourc.190, 279–284. 10.1016/j.jpowsour.2008.12.125
69
Wang Z. H. Wang C. Y. (2003). Mathematical Modeling of Liquid-Feed Direct Methanol Fuel Cells. J. Electrochem. Soc.150, A508–A519. 10.1149/1.1559061
70
Wu Q. X. An L. Yan X. H. Zhao T. S. (2014). Effects of Design Parameters on the Performance of Passive Direct Methanol Fuel Cells Fed with Concentrated Fuel. Electrochimica Acta133, 8–15. 10.1016/j.electacta.2014.03.183
71
Wu Z. Sun G. Jin W. Hou H. Wang S. Xin Q. (2008). Nafion and Nano-Size TiO2-So42− Solid Superacid Composite Membrane for Direct Methanol Fuel Cell. J. Membr. Sci.313, 336–343. 10.1016/j.memsci.2008.01.027
72
Wu Z. Sun G. Jin W. Wang Q. Hou H. Chan K.-Y. et al (2007). Use of In Situ Polymerized Phenol-Formaldehyde Resin to Modify a Nafion Membrane for the Direct Methanol Fuel Cell. J. Power Sourc.167, 309–314. 10.1016/j.jpowsour.2007.02.037
73
Xu F. Innocent C. Bonnet B. Jones D. J. Rozière J. (2005). Chemical Modification of Perfluorosulfo-Nated Membranes with Pyrrole for Fuel Cell Application: Preparation, Characteri-Sation and Methanol Transport. Fuel Cells5, 398–405. 10.1002/fuce.200400077
74
Yang Y. Pintauro P. N. (2000). Multicomponent Space-Charge Transport Model for Ion-Exchange Membranes. Aiche J.46, 1177–1190. 10.1002/aic.690460610
75
Yildirim M. H. Stamatialis D. Wessling M. (2008). Dimensionally Stable Nafion-Polyethylene Composite Membranes for Direct Methanol Fuel Cell Applications. J. Membr. Sci.321, 364–372. 10.1016/j.memsci.2008.05.013
76
Yuan T. Pu L. Huang Q. Zhang H. Li X. Yang H. (2014). An Effective Methanol-Blocking Membrane Modified with Graphene Oxide Nanosheets for Passive Direct Methanol Fuel Cells. Electrochimica Acta117, 393–397. 10.1016/j.electacta.2013.11.063
77
Zakil F. A. Kamarudin S. K. Basri S. (2016). Modified Nafion Membranes for Direct Alcohol Fuel Cells: An Overview. Renew. Sustain. Energ. Rev.65, 841–852. 10.1016/j.rser.2016.07.040
78
Zawodzinski T. A. Derouin C. Radzinski S. Sherman R. J. Smith V. T. Springer T. E. et al (1993a). Water Uptake by and Transport through Nafion 117 Membranes. J. Electrochem. Soc.140, 1041–1047. 10.1149/1.2056194
79
Zawodzinski T. A. Springer T. E. Davey J. Jestel R. Lopez C. Valerio J. et al (1993b). A Comparative Study of Water Uptake by and Transport through Ionomeric Fuel Cell Membranes. J. Electrochem. Soc.140, 1981–1985. 10.1149/1.2220749
80
Zhang J. Lan F. Liang D. Xiao Y. Lu S. Xiang Y. (2011). Bulk Modification of Nafion with Purple Membrane for Direct Methanol Fuel Cell Applications. J. Membr. Sci.382, 350–354. 10.1016/j.memsci.2011.08.039
81
Zhang Z. Désilets F. Felice V. Mecheri B. Licoccia S. Tavares A. C. (2011). On the Proton Conductivity of Nafion-Faujasite Composite Membranes for Low Temperature Direct Methanol Fuel Cells. J. Power Sourc.196, 9176–9187. 10.1016/j.jpowsour.2011.07.009
Summary
Keywords
methanol, water, Nafion, fuel cells, electro-osmosis, drag coefficient
Citation
Corti HR and Trevani L (2022) Electro-Osmotic Flow of Water–Methanol Mixtures Through Nafion Membranes Revisited: Composition and Temperature Dependence. Front. Energy Res. 10:855333. doi: 10.3389/fenrg.2022.855333
Received
15 January 2022
Accepted
28 February 2022
Published
24 March 2022
Volume
10 - 2022
Edited by
José Joaquín Linares León, University of Brasilia, Brazil
Reviewed by
Vincenzo Baglio, Istituto di Tecnologie Avanzate per l’Energia “Nicola Giordano” (ITAE), Italy
Dong Jin Yoo, Jeonbuk National University, South Korea
Updates
Copyright
© 2022 Corti and Trevani.
This is an open-access article distributed under the terms of the Creative Commons Attribution License (CC BY). The use, distribution or reproduction in other forums is permitted, provided the original author(s) and the copyright owner(s) are credited and that the original publication in this journal is cited, in accordance with accepted academic practice. No use, distribution or reproduction is permitted which does not comply with these terms.
*Correspondence: Horacio R. Corti, hrcorti@tandar.cnea.gov.ar
†These authors have contributed equally to this work
This article was submitted to Fuel Cells, a section of the journal Frontiers in Energy Research
Disclaimer
All claims expressed in this article are solely those of the authors and do not necessarily represent those of their affiliated organizations, or those of the publisher, the editors and the reviewers. Any product that may be evaluated in this article or claim that may be made by its manufacturer is not guaranteed or endorsed by the publisher.