 Bing Dong
 Kang Yang2
 Junlian Yin
- 1School of Nuclear Science and Engineering, Shanghai Jiao Tong University, Shanghai, China
- 2China Nuclear Power Engineering Company, Beijing, China
When a fuel rod is damaged, determining the degree of fuel failure makes sense. The operators can decide whether to continue operating the reactor or shut it down based on the severity of the fuel failure. The isotopic ratio of two radioactive fission products (FPs) is a typical technique for evaluating the degree of fuel failure, although this is not applicable in the case of little fuel failure but large tramp uranium mass. The feedforward neural network (FFNN) has been used to identify fuel failures in order to overcome the shortcomings of the isotopic ratio method, although there is still inadequacy in the ability to distinguish between an intact fuel rod and a defective fuel rod with a small defect. In this study, we propose a cascade-forward neural network with a decision tree for fuel failure detection that performs well at classifying the degree of fuel failure and, in particular, at differentiating between an intact fuel rod and a defective fuel rod with a small size defect. The input of the neural network is the specific activity of FPs measured in the coolant. The degree of fuel failure is determined by the neural network’s output, which is labeled using one-hot encoding. The training set is constructed using the Booth-type diffusion model and the first-order kinetic model. The performance of the improved neural network is demonstrated. It is shown that the improved method is more accurate and responsive than the previous neural network when recognizing the onset of fuel failure. Finally, the most important nuclides are determined through the sensitivity analysis, and the neural network is simplified according to the importance of nuclides and the limitation of the radioactive detector in practical application.
1 Introduction
The reactor generates a substantial amount of fission products (FPs) during operation. Under normal operating conditions, the fission products are contained within the fuel cladding which prevents them from escaping into the primary coolant and maintains the coolant’s specific activity within the management limit. While the performance of the fuel rods keeps improving, the fuel cladding is inevitably defective during operation for a variety of reasons (Qin et al., 2020), including the following: 1) power ramp defects caused by stress corrosion cracking (SCC) or pellet-cladding interaction (PCI); 2) circumferential cracking caused by hydrogen embrittlement; 3) fabrication defects; and 4) fretting defects caused by interaction with the grid spacer or debris in the primary coolant (Lewis et al., 2017). When the fuel cladding is defective, FPs can migrate from the fuel cladding gap to the primary coolant, considerably increasing the specific activity of the coolant. If the specific activities or defect sizes exceed the critical values, the reactor must shut down according to the regulation (Likhanskii et al., 2006; Qin et al., 2019). Otherwise, it may increase the risks of occupational exposure and harm the safety of reactor operation (Iqbal et al., 2007; Qin et al., 2020).
In order to determine whether the fuel cladding is defective, either a chemical sampling approach from the let-down flow or the real-time online monitoring system is used to collect specific activities in the primary coolant. By analyzing the specific activities of FPs derived by sampling or online monitoring, fuel rod failures are discovered by various methodologies, such as the release-to-birth ratio method (Zanker, 1989), fitted escape rate coefficient method (Yamamoto and Morishita, 2015), and isotopic ratio method (Kalinichev et al., 2018; Li et al., 2017) (Qin et al., 2016). Generally, these strategies are developed in consideration of the FP release model or reactor operation experience. Among these strategies, the isotopic ratio method is the one that is most frequently used to detect fuel failures during reactor operation. It is based on the ratios of specific activities of two isotopic FPs, which can be used to determine whether the fuel cladding is defective (Menéndez, 2009). In addition, it can identify the degree of fuel failure if the fuel cladding is defective (Li et al., 2017). The advantage of the isotopic ratio method is its simplicity, as it allows for straightforward determination of the specific activities of FPs by analyzing the spectrum obtained from sampling or online monitoring for the primary coolant. The feature of the isotopic ratio method is that it does not require the historical operation data of sampling or online monitoring. The status of the fuel rod can be assessed by the isotopic ratio at a certain time.
The isotopic ratio method has distinct disadvantages. When the defect size is small and the mass of tramp uranium is large, it has been demonstrated that the isotopic ratio increases slowly before reaching the threshold (Dong et al., 2019). Thus, the response of the isotopic ratio method is insensitive for detecting fuel failures. Even in some circumstances, the isotopic ratio method may fail under the influence of tramp uranium. In addition, there is no single standard for the isotopes and the threshold of the isotopic ratio method (Li and Yang, 2008; Menéndez, 2009; Li et al., 2017; Lyu and Xiong, 2019).
To address the limitations of the isotopic ratio method, the neural network–based method for fuel failure detection is developed (Likhanskii et al., 2006). Artificial neural networks (ANNs) are a highly effective technique for establishing a connection between input data and output data in multidimensional space. ANNs have been extensively used in the field of nuclear engineering, particularly in fault diagnosis. Andrews et al. (1999) use ANN models to predict the cesium release fraction from a water reactor under severe accident conditions and demonstrate that the models are capable of reproducing the relationships between the release fraction and time. Guo et al. (2019) apply the deep neural network to detect the damaged fuel assembly by processing the real-time image frame and point out that the deep neural network has more advantages over the traditional computer vision method. Wang et al. (2022) use the deep convolutional neural network (CNN) to detect the system-level fault in the nuclear power plant (NPP) and demonstrate that it is able to improve the NPP fault diagnosis. Ebrahimzadeh et al. (2022) use the feedforward neural network in detection and estimation of fault sensors in the NPP and prove that it has advantages over traditional methods. Zhang et al., (2021) develop a surface crack detection method for nuclear fuel pellets based on the CNN and show that the new method improves the performance of traditional machine vision inspection systems.
In this study, a cascade-forward neural network with a decision tree is proposed for fuel failure detection, which has a good performance to classify the degree of fuel failure, particularly in distinguishing the intact fuel rod and small-size defective fuel rod. The inputs of the neural network are the radioactivity of fission products measured in the coolant. The output of the neural network is the degree of fuel failure, which is labeled using one-hot encoding. The dataset is generated by the Booth-type diffusion model and the first-order kinetic model. The performance of the improved neural network is presented in the study.
The remaining sections of this manuscript are organized as follows. Section 2 is dedicated to the improved method for fuel failure detection. Section 3 shows the performance of the improved method and results of sensitivity analysis. Finally, Section 4 concludes the study.
2 Methodology
2.1 Conceptual Framework
During normal reactor operation, the major source of specific activity in the coolant is tramp uranium, which has a relatively low level of specific activity. When the fuel cladding is defective, the FPs released from the gap in the fuel cladding dominate the specific activity, that is, in a rather high level. It is obvious that a large defect size will result in a high level of specific activity. As a result, the coolant’s specific activity serves as a fingerprint for predicting the status of fuel failure. While it should be noted that if the defect size is very small and the tramp uranium mass is considerable, the tramp uranium contribution may overwhelm the defective fuel rod contribution.
The framework for the detection approach is depicted in Figure 1, which is divided into three parts. The blue parts illustrate how the training, validation, and test datasets are generated. Due to the extremely low probability of fuel failure and pursuit of zero fuel rod failure, there is no appropriate fuel failure dataset for training the network. Thus, the dataset is generated using the FP release model, which includes the Booth-type diffusion model and first-order kinetic model, as detailed in the previous study (Dong et al., 2019). The Booth-type diffusion and first-order kinetic models are proven to be appropriate for calculating fission gas release fraction (Lewis et al., 2017). The green parts denote the establishment of a system for detecting fuel failures. The system is trained and validated on the dataset generated by the blue-outlined technique. The red parts demonstrate how the system is being used to predict the status of a fuel failure.
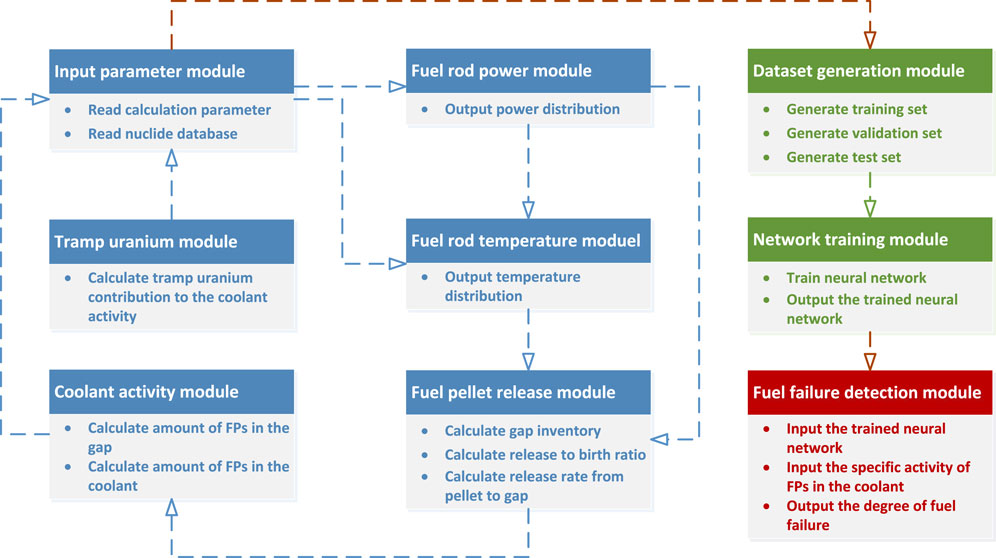
FIGURE 1. Overview of the fuel failure detection method.
2.2 Fission Product Release Model
2.2.1 Booth-type Diffusion Model
The FP release from the pellet to the gap is dominated by the diffusion process. Following the assumption from Booth, a one-dimensional diffusion equation is created considering the FP generation in the uranium grain due to fission, eliminated by the decay:
where C is the concentration of fission products in the uranium grain (m−3); D is the diffusion coefficient of fission products (m2s−1); λ is the decay constant of the fission products (s−1); and B is the production rate of the fission products m−3s−1.
Solving Eq. 1, the release-to-birth ratio of FP release can be derived:
where a is the radius of the uranium grain.
2.2.2 First-Order Kinetic Model
The FPs in the gap and coolant can be treated as a first-order rate process in which the degree of fuel failure is characterized by the escape rate coefficient νi. Then, the equilibrium equations of fission products can be established:
where i, j, and k denote the isotopes; Ng is the number of FPs in the gap; Nc is the number of FPs in the coolant; Ri is the FP release rate from the pellet to gap, which can be derived from Eq. 2; σjϕN is the FP transmutation; fikλkN is the FP decay and fik is the branching ratio; νi is the escape rate coefficient from the gap to coolant; Q/Wηi is the FP elimination due to purification; β is the FP elimination due to boron control; τσiϕ is the FP elimination due to neutron absorption; and L/W is the FP elimination due to coolant leakage; Among them, Q is the let-down flow rate (kg/s), L is the leakage flow rate (kg/s), ηi is the purification efficiency, and W is the total coolant mass (kg); tramp denotes the contribution of tramp uranium.
2.3 Structure of the Network
In this study, an improved method for fuel failure detection is proposed based on the cascade-forward neural network (CFNN). The CFNN is a type of feedforward neural network, in which there is a direct connection between every two layers of the network. It means that there is an additional connection between the input layer and output layer for a regular three-layer neural network. The advantage of the CFNN is that it accommodates the nonlinear relationship between the input and output by not eliminating the linear relationship between the two (Warsito et al., 2018). Thus, it is suitable for establishing a relationship between the specific activity in the coolant and degree of fuel failure.
Figure 2 illustrates the structure of the CFNN utilized to identify fuel failures. The network’s input is a vector containing the normalized specific activity of FPs in the coolant, and the network’s output is the degree of fuel failure, which is encoded in one-hot form. The degree is divided into six categories: degree 1 denotes an unbroken fuel cladding, whereas degrees 2–6 denote a defective fuel cladding. Correspondingly, a high degree indicates a big defect size. After going through a Softmax layer, the value of the neuron represents the probability of that degree of failure occurring.
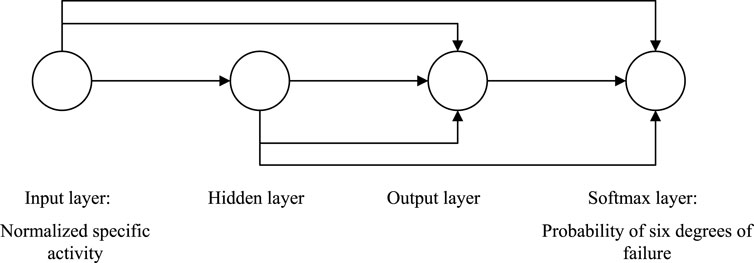
FIGURE 2. Structure of the CFNN used for fuel failure detection.
Perez and Hamawi (2017) show that typical elements in design basis source term determinations can be represented by Kr, Xe, Br, I, Rb, Cs, Sr, Ba, Mo, and Te. Among these elements, Kr, Xe, I, and Cs are most important FPs in fuel failure detection. The nuclides mainly considered in the study are Kr, Xe, I, and Cs, which have a relatively large fission yield and a relatively long half-life, including Kr-85, I-131, I-133, Xe-133, Xe-135, and Cs-137. Simultaneously, considering the decay chain and the representativeness of nuclides in each group, the generated dataset has specific activities of 23 nuclides: Br-83, Kr-85, Kr-85m, Kr-87, Kr-88, Sr-90, Te-131, Te-131m, I-129, I-131, I-133, I-134, I-135, Xe-133, Xe-133m, Xe-135, Xe-135m, Xe-138, Cs-134, Cs-134m, Cs-137, Cs-139, and Pr-143, which are used as the input of the neural network. Then, the neural networks using 23 nuclides as input are trained in this study. Table 1 shows typical samples of the input and output of the neural network.
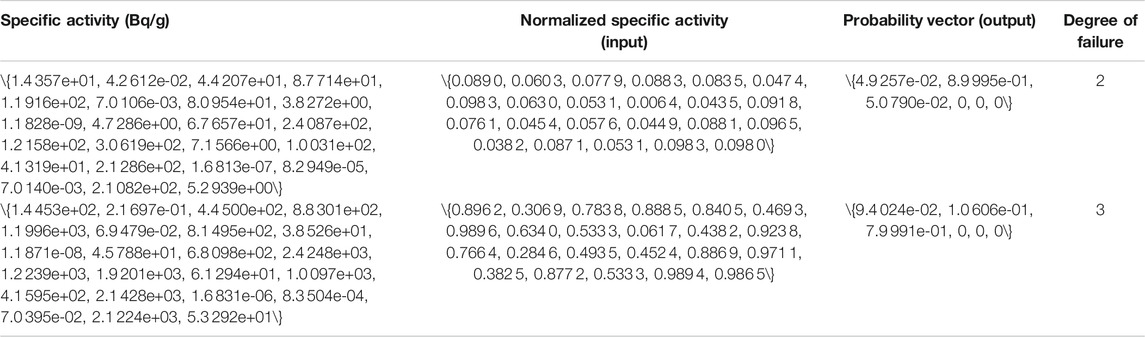
TABLE 1. Typical samples of the input and output of the neural network.
2.4 Development of the Neural Network
Prior to training the neural network, various parameters must be adjusted to make the neural network work well. The number of neurons in the hidden layer is obtained empirically using the following formula (Dong et al., 2019):
where m, n, and l are the corresponding number of neurons in the output, input, and hidden layer, respectively.
Eq. 4 is proven to be an efficient formula to determine the number of neurons in the hidden layer. Since it is shown that the neural networks with the number of hidden layer neurons around the formula all have good performance, the number of hidden layer neurons is determined directly by the formula. The number of hidden layer neurons is 11 for an input of 23 nuclides.
As Figure 2 shows, neurons pass their value to the next layers. Besides the final layer, an activation function, rectified linear unit (ReLu) function, is applied between the two layers to make the neural network present the nonlinear relationship. The ReLu function helps solve the gradient vanishing problem and increases training efficiency (Choi et al., 2021). The Softmax function is applied as the activation function in the final layer:
where xi and xj indicate neurons in the previous layer.
After applying a Softmax function, the values of the neurons are normalized to [0,1], and the summation of each value of neurons in the final layer is 1. Then, the value of neurons can represent the probability of the corresponding degree of failure. The advantage of Softmax function is that it can improve the discrimination between the output neurons and hence increase learning efficiency.
Accompanying the Softmax function, cross-entropy is selected as the loss function (de Boer et al., 2005):
where N is the total number of samples, i denotes the sample number, j denotes the neurons in the final layer,
Adam is selected as the optimizer (Kingma and Ba, 2017), and the neural network is trained with a learning rate of 0.01 balancing the convergence and training speed. The loss of training and validation is shown in Figure 3. It can be seen that the loss of training and validation almost does not decrease after 1,000 epochs. In addition, aiming to avoid the discrepancy of single training, the neural network is trained 10 times individually and averaged to inference the degree of fuel failure.
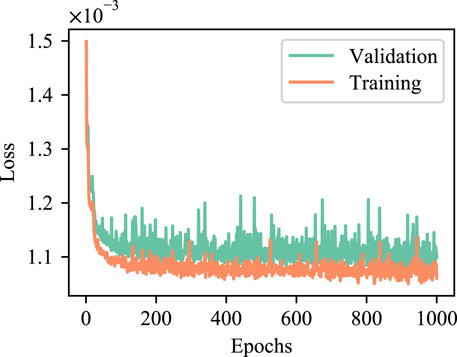
FIGURE 3. Training and validation loss over epochs.
2.5 Optimization for Small Defects
The dataset utilized to train the ANN is imbalanced, with the intact condition prevailing. As a consequence, the trained neural networks have a tendency to categorize degree 2 or 3 (small defects) as degree 1 (intact), which significantly underestimates the degree of fuel failure. To overcome this issue, a decision tree (DT) such as the classifier is developed, as shown in Figure 4.
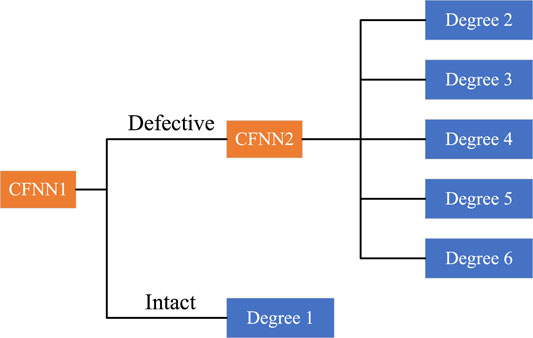
FIGURE 4. Diagram of the CFNN with the decision tree designed for fuel failure detection.
Two distinct forms of the CFNN are developed in the improved method. The CFNN1 is used for predicting whether the fuel cladding is defective. Its structure is the same as shown in Figure 2, except that the output layer contains just two neurons. If the output of the CFNN1 indicates that the fuel cladding is intact, the degree of fuel failure can be assessed to 1. Otherwise, the CFNN2 is used to predict the degree of fuel failure when the fuel cladding is defective. The output of the CFNN2 is the probability of the corresponding degree under defective condition.
2.6 Relative Importance of the Input of the Neural Network
Due to the fact that the neural network is a black-box used to make a connection between the input and output, it is incapable of explaining the mechanisms behind physical phenomena. While the output of the neural network depends on the magnitude of the weights between connections, the contribution of input variables can be determined by interpreting the weights of the trained neural network. This is meaningful information for reactor operators to select the appropriate FPs predicting the status of fuel failure.
A method to determine the relative importance of the input of the neural network is proposed first by Garson, (1991) and simplified by Gevrey et al., (2003). The method essentially involves partitioning the hidden-output connection weights of each hidden neuron into components associated with each input neuron.
For each hidden neuron, the absolute value of the input hidden layer connection weight is divided by the sum of the absolute value of the input hidden layer connection weight of all input neurons:
where W denotes the weight between neuron connections, n denotes the input layer, and l denotes the hidden layer.
Once the parameter Qnl is determined, the sum of Qnl for each hidden neuron is divided by the sum of each hidden neuron of the sum for each input neuron of Qnl. The relative importance of all output weights attributable to the given input variable is then obtained. Then, the relative importance of all output weights for a given input variable can be obtained:
Apart from the connection between the input and hidden layer, there are also connections between the input and other layers. Then, the relative importance should also include other connections and be averaged:
3 Results and Discussion
3.1 Performance of the Method
3.1.1 Accuracy of the Method
The accuracy is calculated as the ratio between the number of correct predictions to the total number of predictions. For example, when a fuel cladding shows degree 1 failure, the prediction is correct if the output of the neural network indicates a degree 1 failure. Otherwise, the prediction is wrong. The predictions are made for all samples in the test set using the trained neural network.
It has been proven that the general FFNN predicts the degree of fuel failure and performs well when the defect size is relatively large, while there will be deviations for small defects, particularly under the impact of large mass of tramp uranium. Figure 5 shows the comparison among the FFNN in the previous study, the CFNN, and the CFNN with the DT. It can be seen that the CFNN increases the accuracy from 45 to 69% for degree 2, while the CFNN with the DT further increases the accuracy to 80% for degree 2. In addition, there is a minor increase in accuracy for degrees 3–6.
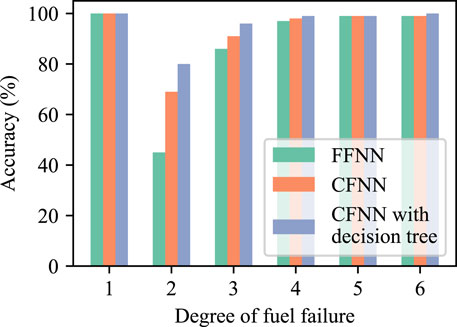
FIGURE 5. Comparison of accuracy between the previous FFNN method and the improved method.
The detailed prediction results for small defects are listed in Table 2. As can be observed, both the CFNN and CFNN with DT methods continue to underestimate the degree of fuel failure for degree 2. However, the improved method significantly lowers the underestimation rate. The underestimation phenomenon in the previous study is attributed to an imbalanced dataset, where the sample number of degree 1 is larger than that of other degrees. Supposing the neural network is trivial, it is obvious that classifying all samples into degree 1 has a higher accuracy than classifying all samples into any other degree. Then, the trained neural network has a tendency to identify degree 2 and degree 3 as degree 1, increasing the probability of correct prediction.
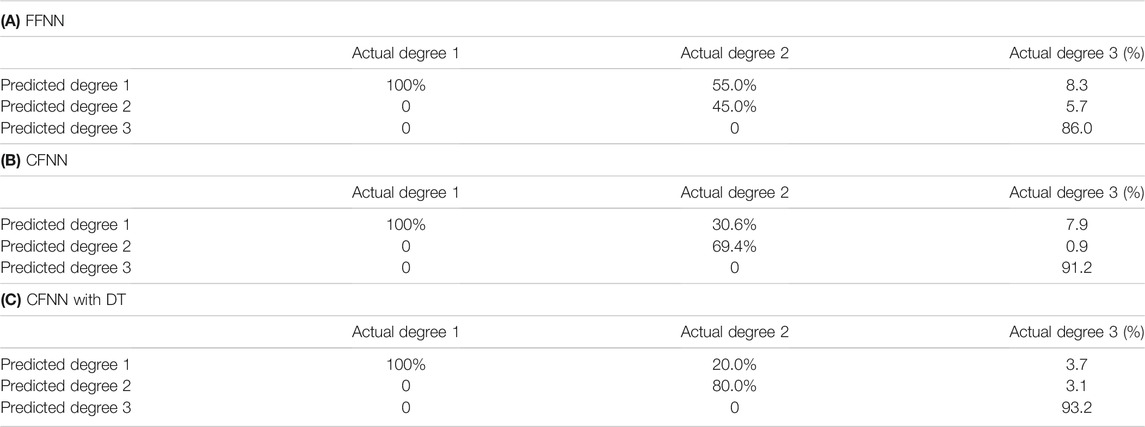
TABLE 2. Confusion matrix of neural network results for small defects in percentage.
Using a DT-like technique can address this issue. As the first step is to decide whether the fuel cladding is defective using a CFNN, the dataset needs to be divided into two categories: intact and defective. Under such condition, the dataset is balanced. After passing through the CFNN1, the samples with intact fuel cladding are classified into degree 1, and other samples with defective fuel cladding go to CFNN2. The dataset of defective fuel cladding of degrees 2–6 is also balanced. Theoretically, the CFNN1 and CFNN2 in the DT are both trained by the balanced dataset, and the degree of fuel failure should not be underestimated. From Table 2, it can be seen that some samples are still underestimated. The major reason is that the escape rate coefficient of degree 2 is extremely small
3.1.2 Responding Speed
When the fuel cladding is defective, it is necessary to rapidly detect the status of fuel failure. On the contrary, the growth in specific activity in the coolant is a gradual process. At the onset of fuel failure, the neural network lacks the confidence in predicting that the fuel cladding is defective, as illustrated in Figure 6.
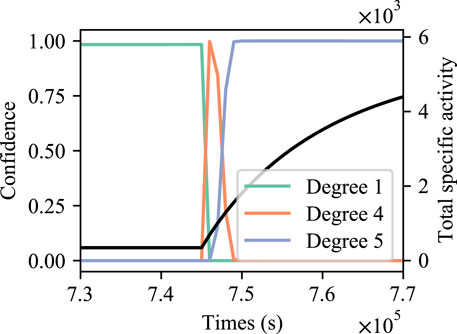
FIGURE 6. Variation of total specific activity and neural network output after fuel failure of degree 5.
Figure 7 shows the comparison of response time between the previous FFNN method and improved method. The test set is randomly sampled considering the influence of the failure onset time, the escape rate coefficient, and the tramp uranium mass. The sample space is built on 10 random defect time, 10 random tramp uranium mass, and 15 random escape rate coefficients of degrees 3–5, a total of 1,500 samples. As illustrated in Figure 7A, there is significant delay in detecting fuel failures using the previous FFNN when the defect size is small and defect occurrence is early. Under these conditions, the response of the CFNN is 15% faster than that of the FFNN. Furthermore, the response of the CFNN with DT is twice faster than that of the FFNN for degree 3 with early defect occurrence. Both the CFNN and CFNN with DT work well for late defect occurrence, with responses more than twice faster than those of the FFNN.
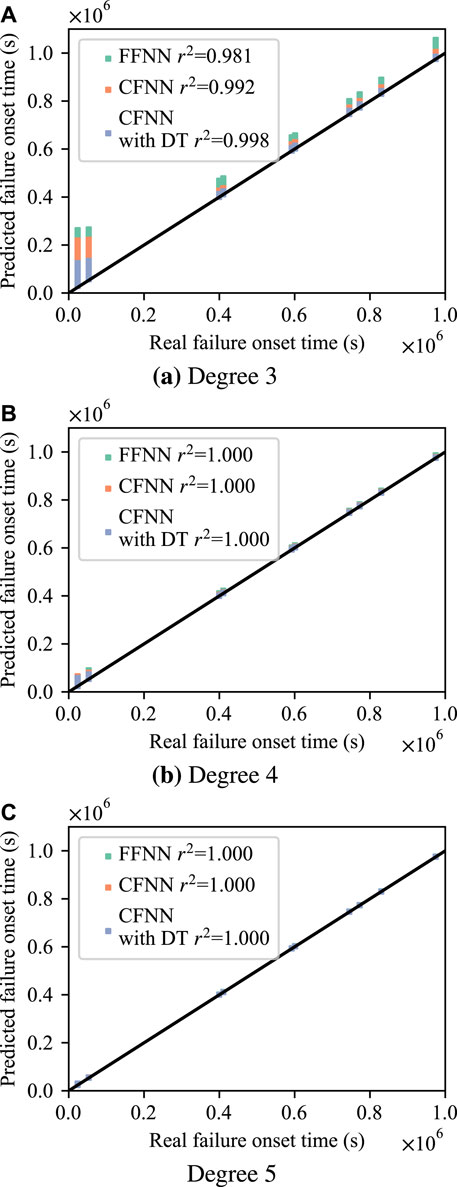
FIGURE 7. Comparison of response time between the previous FFNN method and the improved method. (A) Degree 3, (B) Degree 4, and (C) Degree 5
For degrees 4 and 5, the performance of the FFNN is adequate. The results of the CFNN and CFNN with DT are consistent with those of the FFNN and demonstrate no significant improvement in reaction speed, as shown in Figures 7B,C. That is because the degrees 4 and 5 correlate to a relatively large defect size, which induces a high increase rate of specific activity in the coolant. The neural network has a high degree of confidence in predicting the occurrence of the defect after the specific activity reaches a critical value.
Table 3 shows the confusion matrix of the neural network results of the test set. The time frame of evaluation is chosen as 48 h from the commencement of fuel failure. Since the structure of the FFNN and CFNN is relatively close, comparing Table 3A and Table 3B, it can be seen that the accuracy does not decrease, although the CFNN method responds more quickly than the FFNN method. However, the accuracy of the CFNN with DT method is worse than that of the FFNN or CFNN methods, despite its high response speed. This indicates that the CFNN with DT makes a trade-off between accuracy and speed.
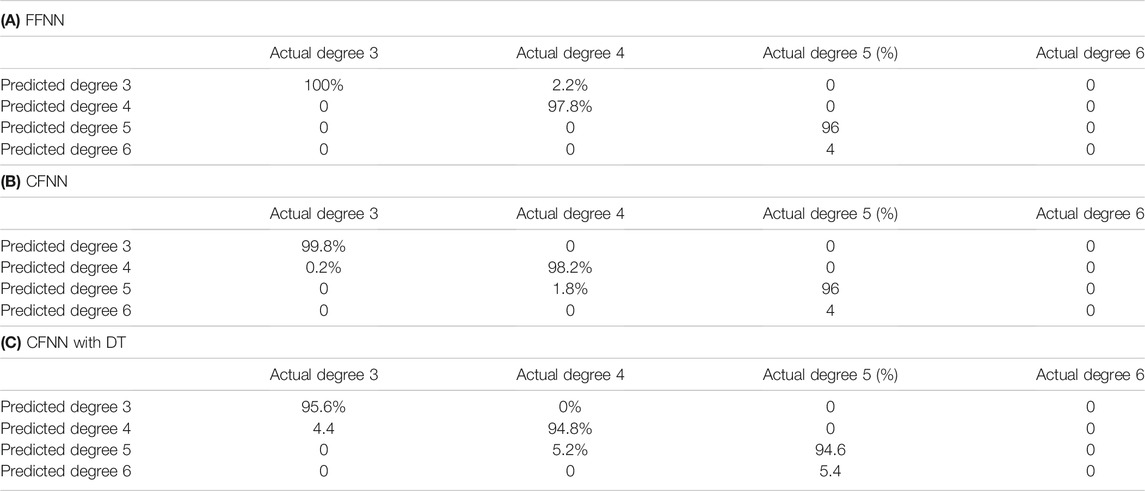
TABLE 3. Confusion matrix of neural network results of the test set in percentage.
The main reason for the fast response of the CFNN with DT method is because the first classifier of the DT is used to detect whether the fuel cladding is defective, which is a binary classification problem. In comparison to the FFNN or CFNN, which are multi-class classification problems, there is a more distinct dividing line between different classes. Since the first classifier of DT responds fast, the second classifier of DT is unable to accurately detect the degree of fuel failure at the moment of the commencement of fuel failure. The feature of the current specific activity may be similar with a minor degree of fuel failure. This phenomenon can also be found in Figure 6.
3.2 Contribution of the Nuclide
It is known that hundreds of nuclides are produced during reactor operation, and their fission yields and decay constants are significantly different, which may vary several orders of magnitude. Because using all nuclides for fuel failure detection is uneconomical and impracticable, it is vital to identify the key nuclides for predicting the status of the fuel cladding.
The neural networks in this study use 23 nuclides as the input, mainly including noble gases, iodine, and cesium. Due to their relatively large fission yield and long half-life, these types of nuclides are already frequently utilized in the isotopic ratio method for fuel failure detection. In order to evaluate the contribution of these nuclides to the determination of the degree of fuel failure and support the further selection of FPs, a sensitivity analysis is performed using the method provided in Section 2.6.
After training the neural network, the connection weights are acquired. Then, Qnl in Eq. 7 can be easily calculated. After obtaining Qnl, the contribution of the input variable can be calculated using Eq. 8. Since there are connections between the input and other layers, it should be noted that the contribution derived by Eq. 8 needs to be averaged.
The contribution of FPs derived by sensitivity analysis of 10 trained neural networks is shown in Figure 8. It can be obviously seen that the most important nuclides are I-131, Xe-133, Xe-135, and Kr-85, which is consistent with the prevalent knowledge. These nuclides are already usually used in the isotopic ratio method for fuel failure detection (Menéndez, 2009; Li et al., 2017; Lyu and Xiong, 2019). These four nuclides are critical in the fuel failure detection process. Besides these four nuclides, it can be seen that Xe-133m, Sr-90, and I-133 also have a relatively high contribution.
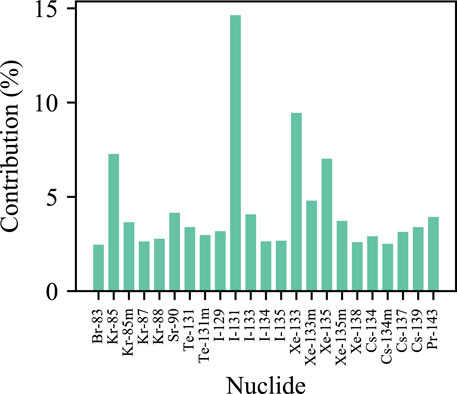
FIGURE 8. Contribution of FPs to the output of the neural network.
The previous study has shown that increasing the quantity of input nuclides can improve detection accuracy. While considering the efficiency and limitation of the detection apparatus, some nuclides may be ignored. Although the neural network can be simplified by ignoring some FPs, it is better to not ignore the aforementioned seven nuclides.
3.3 Nuclide Selection in Real Scenario
The ideal neural network should make extensive use of FP-specific activity. While due to the detection limitation of the detector, only a few nuclides can be used as the input of the neural network. Since the specific activity of FPs in the coolant is supposed to be detected by a cadmium zinc telluride (CZT) detector, the nuclides used as the input are selected based on matching the energy spectrum of the CZT detector and generated dataset. A typical spectrum of FPs derived by the CZT detector is shown in Figure 9, and the generated dataset has specific activities of 23 nuclides as stated in Section 2.3; the nuclides used as the input are selected as I-131, I-133, Xe-133, and Xe-135 combining the sensitivity analysis in Section 3.2. Then, the neural networks with an input of four nuclides are trained based on the improved method and used for practical application, which is consistent with the previous study.
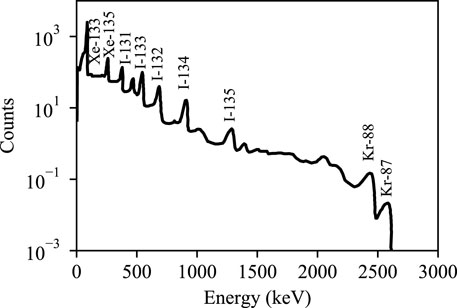
FIGURE 9. Energy spectrum of FPs obtained by a CZT detector.
4 Conclusion
In this study, an improved method based on the CFNN and DT for fuel failure detection is proposed. The method considerably improves the accuracy of fuel failure detection when the defect size of the fuel cladding is small. The CFNN with DT method increases the detection accuracy from 45 to 80% for fuel failure of degree 2. In comparison to the previous FFNN method, the response speed of the CFNN with DT method is more than twice, although at the expense of sacrificing some precision. The sensitivity analysis of the trained neural network indicates that I-131, Xe-133, Xe-135, and Kr-85 are the most important nuclides in fuel failure detection. Besides these four nuclides, Xe-133m, Sr-90, and I-133 also have a relatively high contribution to the neural network for detecting fuel failure.
Data Availability Statement
The datasets presented in this study can be found in online repositories. The names of the repository/repositories and accession number(s) can be found below: https://data.mendeley.com/datasets/tcscykf5hn/2.
Author Contributions
BD: wrote the manuscript and designed the methodology. KY: trained the neural network and revised the manuscript. WZ: provided the detector information. JY: revised the manuscript. DW: supervised and funded the project.
Funding
This study is financially supported by the National Natural Science Foundation of China (No. 11675105).
Conflict of Interest
Author KY and WZ were employed by China Nuclear Power Engineering Company.
The remaining authors declare that the research was conducted in the absence of any commercial or financial relationships that could be construed as a potential conflict of interest.
Publisher’s Note
All claims expressed in this article are solely those of the authors and do not necessarily represent those of their affiliated organizations, or those of the publisher, the editors, and the reviewers. Any product that may be evaluated in this article, or claim that may be made by its manufacturer, is not guaranteed or endorsed by the publisher.
References
Andrews, W. S., Lewis, B. J., and Cox, D. S. (1999). Artificial Neural Network Models for Volatile Fission Product Release during Severe Accident Conditions. J. Nucl. Mater. 270, 74–86. doi:10.1016/S0022-3115(98)00765-X
Choi, S. H., Choi, H. J., Min, C. H., Chung, Y. H., and Ahn, J. J. (2021). Development of De-noised Image Reconstruction Technique Using Convolutional AutoEncoder for Fast Monitoring of Fuel Assemblies. Nucl. Eng. Technol. 53, 888–893. doi:10.1016/j.net.2020.08.020
de Boer, P.-T., Kroese, D. P., Mannor, S., and Rubinstein, R. Y. (2005). A Tutorial on the Cross-Entropy Method. Ann. Oper. Res. 134, 19–67. doi:10.1007/s10479-005-5724-z
Dong, B., Xiao, W., Yin, J., and Wang, D. (2020). Detection of Fuel Failure in Pressurized Water Reactor with Artificial Neural Network. Ann. Nucl. Energ. 140, 107104. doi:10.1016/j.anucene.2019.107104
Ebrahimzadeh, A., Ghafari, M., and Moshkbar-Bakhshayesh, K. (2022). Detection and Estimation of Faulty Sensors in NPPs Based on thermal-hydraulic Simulation and Feed-Forward Neural Network. Ann. Nucl. Energ. 166, 108726. doi:10.1016/j.anucene.2021.108726
Gevrey, M., Dimopoulos, I., and Lek, S. (2003). Review and Comparison of Methods to Study the Contribution of Variables in Artificial Neural Network Models. Ecol. Model. 160, 249–264. doi:10.1016/S0304-3800(02)00257-0
Guo, Z., Wu, Z., Liu, S., Ma, X., Wang, C., Yan, D., et al. (2020). Defect Detection of Nuclear Fuel Assembly Based on Deep Neural Network. Ann. Nucl. Energ. 137, 107078. doi:10.1016/j.anucene.2019.107078
Iqbal, M. J., Mirza, N. M., and Mirza, S. M. (2007). Kinetic Simulation of Fission Product Activity in Primary Coolant of Typical PWRs under Power Perturbations. Nucl. Eng. Des. 237, 199–205. doi:10.1016/j.nucengdes.2006.06.003
Kalinichev, P., Evdokimov, I., and Likhanskii, V. (2018). A Technique for Detection of WWER Fuel Failures by Activity of Xe Radionuclides during Reactor Operation. Nucet 4, 263–270. doi:10.3897/nucet.4.31889
Kingma, D. P., and Ba, J. (2017). Adam: A Method for Stochastic Optimization. arXiv. arXiv:1412.6980 [cs]. doi:10.48550/arXiv.1412.6980
Lewis, B. J., Chan, P. K., El-Jaby, A., Iglesias, F. C., and Fitchett, A. (2017). Fission Product Release Modelling for Application of Fuel-Failure Monitoring and Detection - an Overview. J. Nucl. Mater. 489, 64–83. doi:10.1016/j.jnucmat.2017.03.037
Li, H., Fu, Y., Mao, L., and Mei, Q. (2017). “Research on Estimating Methods and Application of Fuel Rods Defect,” in Proceedings of the 2017 25th International Conference on Nuclear Engineering, Shanghai, China, July 2017 (New York, N.Y.: American Society of Mechanical Engineers (ASME)), 4. doi:10.1115/icone25-66622
Li, L., and Yang, H. (2008). Diagnosis Method for Fuel Failures in Pressurized Water Reactor Nuclear Power Plant. Nucl. Power Eng. 29, 135–139.
Likhanskii, V., Afanasieva, E., Sorokin, A., Evdokimov, I., Kanukova, V., and Khromov, A. (2006). “Failed Fuel Diagnosis during WWER Reactor Operation Using the RTOP-CA Code,” in Proceedings of the International Conference on WWER Fuel Performance, Modelling and Experimental Support, Bulgaria, 2006 (Vienna, Austria: IAEA), 6.
Lyu, W., and Xiong, J. (2019). Research and Improvement of Diagnosis Method of Fuel Failures for Pressurized Water Reactor Nuclear Power Plant. Nucl. Power Eng. 40, 43.
Menéndez, M. A. T. (2009). “Fuel Failure Detection, Characterization and Modelling: Effect on Radionuclide Behaviour in PWR Primary Coolant,” (Spain: Polytechnic University of Madrid). Ph.D. thesis.
Perez, P. B., and Hamawi, J. N. (2017). Fission Product Appearance Rate Coefficients in Design Basis Source Term Determinations - Past and Present. EPJ Web Conf. 153, 07037. doi:10.1051/epjconf/201715307037
Qin, G., Chen, X., Guo, X., and Ni, N. (2016). On-line Detection of Key Radionuclides for Fuel-Rod Failure in a Pressurized Water Reactor. Appl. Radiat. Isot. 114, 71–75. doi:10.1016/j.apradiso.2016.05.017
Qin, G., Wang, Q., Chen, X., Li, F., Li, W., and Guo, X. (2020). Development of Fuel Rod Failure Character Analysis Code for Pressurized Water Reactors. Nucl. Eng. Des. 361, 110515. doi:10.1016/j.nucengdes.2020.110515
Qin, G., Wang, Q., Xu, Y., Chen, X., Li, F., and Li, W. (2019). γ-Ray Spectral Analysis Method for Real-Time Detection of Fuel Element Failure. Ann. Nucl. Energ. 133, 221–226. doi:10.1016/j.anucene.2019.05.034
Wang, Z., Xia, H., Zhang, J., Annor-Nyarko, M., Zhu, S., Jiang, Y., et al. (2022). A Deep Transfer Learning Method for System-Level Fault Diagnosis of Nuclear Power Plants under Different Power Levels. Ann. Nucl. Energ. 166, 108771. doi:10.1016/j.anucene.2021.108771
Warsito, B., Santoso, R., Suparti, , and Yasin, H. (2018). Cascade Forward Neural Network for Time Series Prediction. J. Phys. Conf. Ser. 1025, 012097. doi:10.1088/1742-6596/1025/1/012097
Weifeng, L., and Jun, X. (2019). Research and Improvement of Diagnosis Method of Fuel Failures for Pressurized Water Reactor Nuclear Power Plant. Nucl. Power Eng. 40, 43.
Yamamoto, Y., and Morishita, K. (2015). Development of Methodology to Optimize Management of Failed Fuels in Light Water Reactors. J. Nucl. Sci. Technol. 52, 709–716. doi:10.1080/00223131.2014.979901
Zanker, H. (1989). Defective Fuel Rod Detection in Operating Pressurized Water Reactors during Periods of Continuously Decreasing Fuel Rod Integrity Levels. Nucl. Technol. 86, 239–247. doi:10.13182/NT89-A34292
Keywords: nuclear fuel, cladding defect, fuel failure detection, neural network, decision tree, fission product
Citation: Dong B, Yang K, Zhang W, Yin J and Wang D (2022) An Improved Method for PWR Fuel Failure Detection Using Cascade-forward Neural Network With Decision Tree. Front. Energy Res. 10:851848. doi: 10.3389/fenrg.2022.851848
Received: 10 January 2022; Accepted: 17 February 2022;
Published: 21 March 2022.
Edited by:
Xingang Zhao, Oak Ridge National Laboratory (DOE), United StatesReviewed by:
Wenzhong Zhou, Sun Yat-sen University, ChinaJiankai Yu, Massachusetts Institute of Technology, United States
A. Abdelghafar Galahom, Higher Technological Institute, Egypt
Serkan Akkoyun, Cumhuriyet University, Turkey
Copyright © 2022 Dong, Yang, Zhang, Yin and Wang. This is an open-access article distributed under the terms of the Creative Commons Attribution License (CC BY). The use, distribution or reproduction in other forums is permitted, provided the original author(s) and the copyright owner(s) are credited and that the original publication in this journal is cited, in accordance with accepted academic practice. No use, distribution or reproduction is permitted which does not comply with these terms.
*Correspondence: Dezhong Wang, ZHp3YW5nQHNqdHUuZWR1LmNu