 Lu Yu1,2
 Kendhl Seabright1Ishan Bajaj3
 David J. Keffer2David M. Alonso4Chien-Te Hsieh5*
 Mi Li1Hao Chen6
 Sheng Dai6,7Yasser Ashraf Gandomi8Christos T. Maravelias3,9
 David P. Harper1*
- 1Center for Renewable Carbon, Institute of Agriculture, The University of Tennessee, Knoxville, TN, United States
- 2Department of Materials Science and Engineering, The University of Tennessee, Knoxville, TN, United States
- 3Andlinger Center for Energy and the Environment, Princeton University, Princeton, NJ, United States
- 4Glucan Biorenewables LLC, Madison, WI, United States
- 5Department of Chemical Engineering and Materials Science, Yuan Ze University, Taoyuan, Taiwan
- 6Department of Chemistry, The University of Tennessee, Knoxville, TN, United States
- 7Chemical Sciences Division, Oak Ridge National Laboratory, Oak Ridge, TN, United States
- 8Department of Chemical Engineering, Massachusetts Institute of Technology, Cambridge, MA, United States
- 9Department of Chemical and Biological Engineering, Princeton University, Princeton, NJ, United States
In this work, yellow pine (YP, softwood) and switchgrass (SG, grass) lignins were extracted as a coproduct of an organosolv γ-valerolactone (GVL) biorefinery that also produces biofuels and furfural. The extracted lignins were converted to carbon precursors for synthesizing porous activated carbon electrodes for high energy-density supercapacitors. This research details the impact of lignin composition on the derived porous structures and electrochemical properties of activated carbons. Lignin precursors with various syringyl (S) to guaiacyl (G) contents were characterized using 31P nuclear magnetic resonance (NMR) and two-dimensional 1H‒13C NMR. A two-step activation process, using steam and carbon dioxide as the activating agents, enabled the formation of porous carbons structures with high surface area. The capacitive behavior of supercapacitors was systematically characterized by cyclic voltammetry, charge-discharge cycling, and electrochemical impedance spectroscopy. The specific capacitance of YP and SG capacitors reached 367 and 221 F g−1, respectively. Both types of capacitors demonstrated remarkably stable capacitance (capacitance retention >90%) along with excellent Coulombic efficiency (>99%) over 10,000 cycles. Compared to SG electrode, the better electrochemical performance achieved with YP electrodes was mainly due to shorter diffusion path, improved ionic mobility, and increased active surface area. The inexpensive lignin-based porous electrodes synthesized in this work can be used for various electrochemical devices for improved performance, decreased cost, and enhanced durability. This work also demonstrates that the selection of feedstock and appropriate processing conditions can tailor the structure of carbon composites for targeted applications. Techno-economic analysis indicates that YP and SG activated carbons can be produced at a minimum selling price of $8,493 and $6,670 per ton, respectively, which is competitive with the commercially available supercapacitor-grade activated carbons.
1 Introduction
Lignin is a natural aromatic polymer composed of phenylpropane units with various interunit linkages, such as ether and C‒C bonds (Pandey and Kim, 2011; Azadi et al., 2013; Rodríguez Correa et al., 2017). As one of the major components of terrestrial plants, about 70 million tons of lignin are produced as the by-product from pulp/paper industry annually (Gosselink et al., 2004; Liu et al., 2015). However, ca. 95% of the available lignin is combusted to generate a low-grade heat source and the remaining amount is used for preparing specialty products for various markets (Gosselink et al., 2004; Liu et al., 2015). Considering lignin’s high carbon content and unique aromatic structure, it is desirable to use lignin for synthesizing high value-added products, such as carbon fiber, carbon black, dyes, and paints (Carrott and Ribeiro Carrott, 2007). Manufacturing porous carbon structures from lignin precursors is another promising application given the important role of porous carbon electrodes for different electrochemical devices. Activated carbons (ACs) can be prepared using a variety of raw materials including peanut shell, sugarcane bagasse and corn syrup (see Supplementary Table S1). Lignin can be considered a potential precursor in preparing highly porous ACs due to its high carbon content, low cost, and large-scale availability as a major byproduct of paper and biofuel production (Souto et al., 2018).
Selecting an appropriate lignin precursor is challenging due to lignin’s highly complex structure that varies as a function of the biomass source and isolation methods adopted (Rowlandson et al., 2020). The basic constituent of lignin is phenylpropane (C6−C3), which tends to form a three-dimensional complex structure through ether or C−C bonds (Han et al., 2018). Lignin is composed of varying ratios of three aromatic monomers depending mainly on botanical origin, including p-coumaryl alcohol, coniferyl alcohol, and sinapyl alcohol (McKendry, 2002; Calvo-Flores and Dobado, 2010). According to the composition of the structural units, lignin can be classified into three broad classes: softwood, hardwood, and grass lignin.(Adler, 1977; Roberts, 1996). Normally, softwood lignin predominantly contains coniferyl alcohols (∼90%) with a minor amount of p-coumaryl alcohols (Pandey and Kim, 2011). Hardwood lignin possess similar amounts of coniferyl and sinapyl alcohol units, while grass lignin is composed of all three major units with high ratio of coniferyl and sinapyl alcohols (Kubo and Kadla, 2005). Softwood lignin has a more crosslinked network structure due to the availability of the C5 position of the coniferyl alcohol units for coupling. Hardwood and grass lignin have a more linear structure as a result of the sinapyl alcohol units that contain extra methoxy groups on the aromatic rings, which limit the formation of coupling and cross-linking branches (Kubo and Kadla, 2005; Liu et al., 2015).
For industrial-scale manufacturing of ACs, a consistent feedstock supply is essential to ensure relatively uniform product quality. High surface area ACs are commonly used for catalysis, purification, decolorization, deodorization, separation, and energy storage (Hsieh and Teng, 2000; Hsieh and Lin, 2006). The application of activated porous carbon electrodes within electric double-layer capacitors (so-called “supercapacitors”) has received a surge in attention as high surface areas (i.e., electrolyte/electrode interface) enabled through activated porous electrodes for double-layer formation and subsequent energy storage (Liu and Osaka, 1997; Qu and Shi, 1998). Many physical and chemical approaches have been reported for preparing activated carbon structures, which vary in electrode performance based upon pore size distribution, surface functional groups, and surface heterogeneity (Hsieh and Teng, 2002; Huang et al., 2020). However, there is limited understanding of the chemical and physical process to convert lignin from different precursors into ACs. Herein, we establish processing-structure-property-performance relationships (PSPP) through an efficient activation method for preparing activated carbons from different lignin precursors with enhanced electrochemical properties (e.g., surface accessibility).
In this work, a novel activation technique was developed for preparing activated carbons from two types of lignin, yellow pine (YP, softwood lignin) and switchgrass (SG, grass lignin). The influence of lignin molecular structure on both surface texture and pore size distribution of the activated carbons was systematically examined. The electrochemical performance of supercapacitors assembled with carbon electrodes was also explored using cyclic voltammetry (CV), charge-discharge cycling, and electrochemical impedance spectroscopy (EIS) in aqueous electrolytes. Techno-economic analysis was performed to assess the economic viability of the process and demonstrate the efficacy of using lignin with different chemical constituents as precursors for preparing highly porous activated carbons used as electrode material in supercapacitors.
2 Experimental
2.1 Preparation of Activated Carbons From Lignin
The YP and SG were obtained from Genera Energy LLC (Vonore, TN). Lignin was isolated using an γ-valerolactone organosolv fractionation technology described by Alonso et al. (2017) at the lab scale. YP and SG lignin were carbonized in a ceramic boat inserted in an alumina tube furnace with nitrogen gas flowing (3 L min−1) at 1,000°C for 1 h. After naturally cooling down with N2 flow, the carbonized samples were pulverized by ball-milling (PM100 RETSCH model), using 2- and 10-mm stainless steel balls in a stainless-steel container at 350 rpm for 30 min. The grounded carbon powders were separated from the grinding balls using sieves and then placed into the tube furnace for steam activation at 800°C for 1 h with a ramping rate of 10°C min−1. After steam activation, the carbon sample was placed in the furnace under CO2 atmosphere for physical activation at 800°C for 1 h to yield the final samples. Figure 1 illustrates the schematic diagram for the experimental design for the supercapacitor using two kinds of electrode materials (i.e., YP and SG), where activated carbons (YP-AC and SG-AC) were derived from different raw materials and lignin precursors.
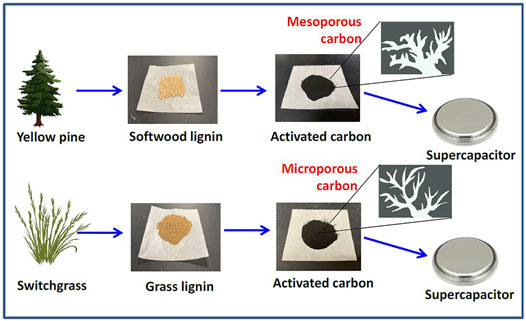
FIGURE 1. Schematic diagram for illustrating the flowchart of supercapacitor using two kinds of electrode materials, where activated carbons were derived from different raw materials and lignin precursors.
2.2 Materials Characterization
Thermogravimetric analyzer (TGA, Perkin Elmer Pyris 1) and differential scanning calorimetry (DSC, Perkin Elmer Diamond DSC) were adopted to measure thermal stability of lignin precursors in an inert nitrogen environment. The TGA analysis was conducted by heating lignin samples from 100 to 800°C at a heating rate of 10°C min−1. The DSC procedure involved three heating and cooling cycles performed at a rate of 100°C min−1. The lignin samples were initially heated for two cycles from 25 to 160°C, and then heated to 230°C.
The structural morphology images of the carbon samples were collected by using scanning electron microscope (SEM, Phenom ProX). Surface characteristics of the carbon samples were analyzed by an automated adsorption apparatus (Micromeritics Instrument Co., TriStar 3000) using N2 physisorption at -196°C. Total and mesopore surface areas of the carbon samples were calculated by using Brunauer–Emmett–Teller (BET) and Barrett–Joyner–Halenda (BJH) equations. Pore-size distributions were analyzed from the N2-adsorption branch using density functional theory (DFT) method.
Surface functional groups on the activated carbon samples were characterized by attenuated total reflectance Fourier transform infrared (FTIR) spectroscopy (Perkin Elmer, Spectrum II). FTIR spectra were collected from 4,000—600 cm−1 using 16 scans with a resolution of 4 cm−1. Additional surface chemical composition was collected by X-ray photoelectron spectroscopy (XPS, Fison VG ESCA210). Elemental (i.e., CHN) analysis of lignin samples was performed by combustion analysis (Perkin Elmer) to determine amounts of carbon, hydrogen, and nitrogen. To quantify the amount of oxygen, a differential technique was adopted where the samples were assumed to be composed of solely C, H, N, and O elements. Gel permeation chromatography (GPC) was used to determine the number average molecular weight (Mn), weight average molecular weight (Mw), and molar-mass dispersity (ÐM) index of the lignin samples. GPC analysis was conducted by dissolving lignin in tetrahydrofuran (THF) at 1 mg ml−1 and injecting into an EcoSec GPC Instrument (Tosoh), with two columns (TSKgel SuperMultipore HZ-M, 4.6 × 150 mm, 4 µm) and a guard column held at 40°C. Acetobromination of the lignin was required prior to dissolution in THF for GPC analysis (Guerra et al., 2008).
31P-NMR measurements were carried out using a Varian 400-MR spectrometer. Lignin samples, approximately 60 mg, were dissolved in 0.4 ml NMR solvent (deuterated chloroform and pyridine (1:1.6 v/v)). Then, 0.1 ml internal standard solution (21.5 mg endo-N-hydroxy-5-norbornene-2,3-dicarboximide in 1 ml NMR solvent) and 0.05 ml relaxation reagent (11.4 mg chromium (III) acetylacetonate in 1 ml NMR solvent) were added. Immediately before NMR analysis, 0.1 ml phosphorylating reagent, 2-chloro-4,4,5,5-tetramethyl-1,3,2- dioxaphospholane (Santa Cruz Biotechnology) was added to the sample. Acquisition parameters were set to collect 512 scans, with 1 s acquisition time and 5 s relaxation delay. Spectral data were analyzed using MestReNova software.
Two-dimensional (2D) 1H ‒13C NMR spectra were conducted on a Bruker Avance III 500-Hz NMR spectrometer, and spectral processing was carried out using a Bruker Topspin 3.5 software. The lignin samples (30 mg) were dissolved in 0.4 ml DMSO-d6 in an NMR tube independently. Heteronuclear single quantum coherence (HSQC) experiments were perfomed with a Bruker pulse sequence (hsqcetgpspsi 2.2) on an N2 cryoprobe (BBO 1H&19F-5mm) with the following acquisition parameters: spectra width 12 ppm in F2 (1H) dimension with 1,024 data points (acquisition time 85.2 ms), 200 ppm in F1 (13C) dimension with 256 increments (acquisition time 5.1 ms), a 1.0-s delay, a 1JC–H of 145 Hz, and 128 scans. The central DMSO-d6 solvent peak (™C/™H at 39.5/2.49) was used to calibrate the chemical shift position. Assignment and the relative abundance of lignin compositional subunits and inter-unit linkage were estimated using volume integration of contours in HSQC spectra according to published literature (Das et al., 2018). The abundances of aromatic units and side-chain linkages were presented as percentage of total SGH units and total side-chain linkages, respectively.
2.3 Electrochemical Performance
Prior to working electrode preparation, the electrode slurries were first prepared by mixing 94.0 wt% activated carbon powder, 5.0 wt% polyvinylidene fluoride (Kynar) and 1.0 wt% black carbon (Super C65) in N-methyl-2-pyrrolidone (NMP) solvent. Subsequently, the stainless-steel substrate was coated with the electrode slurry to obtain a flexible electrode with an area of 2 × 1 cm2.
Electrochemical measurements were conducted in a three-electrode system with a Pt wire as the counter electrode and an Ag/AgCl electrode as the reference electrode. Sulfuric acid (H2SO4, 1 M) was used as the electrolyte solution. The CV measurements were conducted at different scan rates (10, 30, 50, and 100 mV s−1) within the potential range of 0–1 V. The capacitance was measured by charging and discharging from 1 to 0 V at different current densities. The impedance spectra were recorded with the AC frequency ranging from 100 kHz to 1 mHz. The resulting Nyquist plots were analyzed using the Z-view software package.
3 Results and Discussion
3.1 Physicochemical Properties of Lignin
The compositional and elemental analysis of various lignin precursors are provided in the Electronic Supporting Information (see Supplementary Table S2). Supplementary Table S2 includes the purity analysis, average molecular weight, and elemental analysis. Supplementary Table S2 details that there is less than 4 and 6% of contaminants for YP and SG, respectively. Additionally, the ash contents are low, 0.02 and 0.03% for YP and SG, respectively, indicating that YP lignin has higher purity than SG lignin. GPC analysis details that YP lignin possesses similar molar-mass dispersity (ÐM) index (Mw/Mn: 3.00 (YP) and 2.96 (SG)) with SG lignin, which reveals the dispersion of the distribution of molar masses in YP and SG lignin (Kilpelaeinen et al., 1994; Kubo and Kadla, 2005). The quantitative CHN of these two lignin sources are summarized in the elemental analysis, showing that YP lignin possesses a higher carbon content than SG, whereas SG lignin has higher oxygen and nitrogen content.
Hydroxyl units are a key factor that affect the product’s thermal and physical properties, which was quantified using 31P NMR (Hosseinaei et al., 2016; Hosseinaei et al., 2017). As shown in Figure 2 and Table 1, YP and SG have similar amount of aliphatic hydroxyl groups, while SG possess a higher amount of phenolic hydroxy groups and carboxylic acid groups. The higher level of carboxylic acid in SG lignin is likely a result of higher concentration of phenolic acids (pCA and FA) being present in grasses (Hosseinaei et al., 2016). Since YP lignin predominantly contains guaiacol (G) units, the amount of p-hydroxyphenyl OH groups in SG lignin are higher than YP. To further confirm above results, we used 2D NMR analysis quantify the aromatic and aliphatic region in both lignin types, as illustrated in Figure 3. Supplementary Table S3 includes the relative abundance of lignin linkages assessed using 13C-1H NMR analysis. The results agree with 31P NMR results confirming higher degree of lignin condensation in YP relative to SG due to the presence of the C5 position of G units, which provide coupling and cross-linking sites. The linkages of methoxyl (OMe), γ-hydroxylated (Aγ), β-5′ phenylcoumaran (Bγ and Bβ) groups and β- O-4’ (Aα/Aα’) can be observed for both lignins. However, SG lignin contains resinol (Cβ and Cγ) substructures, which YP lignin does not possess.
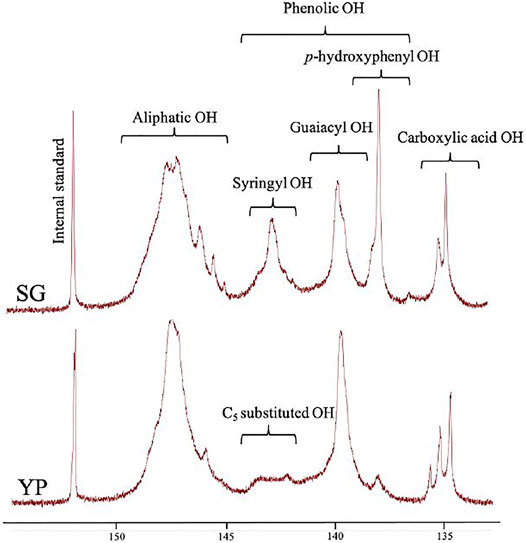
FIGURE 2. Quantitative 31P NMR spectra of SG and YP lignin samples.
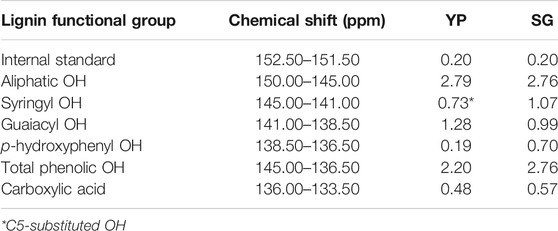
TABLE 1. Hydroxyl group contents of YP and SG lignin samples obtained by31P NMR.
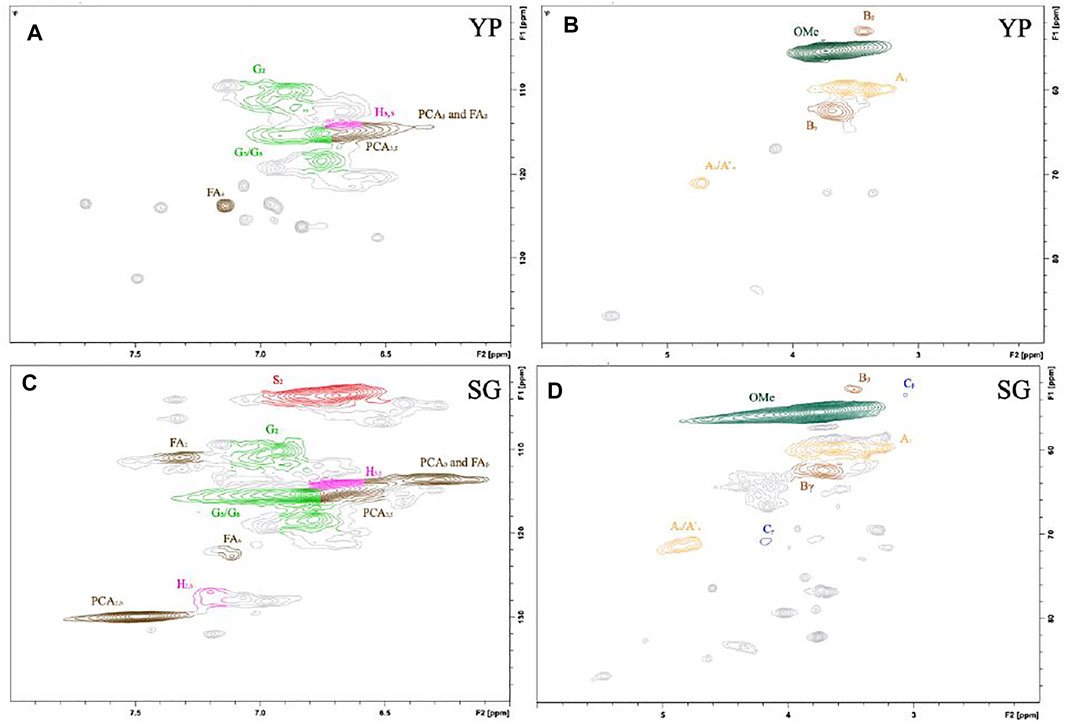
FIGURE 3. 2D13C-1H NMR spectra for different lignin precursors (A,B) YP and (C,D) SG.
Lignin’s chemical composition depends on the botanical source and isolation method. Lignin from grasses (e.g., SG) usually possesses all three units (H-, G-, and S-type), whereas softwood lignin (e.g., YP) are primarily composed of G-type units (Yoshida et al., 2004). As shown in Figure 3 S– and G-units and H-units are clearly observed in the aromatic region of the SG sample, while YP predominantly possess G-units along with a small quantity of H-units. The S-units show strong signals for C2/H2 and C6/H6 in correlation with δC/δH 103.9/6.65 (S2/6), the G-units display strong correlations at δC/δH: 110.9/7.00 (G2), 115.1/6.72and6.98 (G5), and 118.7/6.77 (G6), and the peaks of H-units are observed at 114.8/6.73 (H3,5) and 127.8/7.20 (H2,6).
Aromaticity, an indicator of a product’s quality as well as its thermal stability, was evaluated for the precursors using TGA, as shown in Figure 4A. The pyrolysis of both lignin types presents a similar trend of weight loss starting at 200°C, which corresponds to the breaking of the weaker bonds such as hydrogen bonds and C-OH binding (Liu et al., 2015). Decomposition is observed in the range of 200–300°C, which proceeded faster for SG due to its higher number of linkages. The maximal loss occurs at 380–390°C, where the cleavage of stronger bonds, such as β-O-4 linkages begins to degrade (Liu et al., 2015). The maximal decomposition temperature of YP is higher than that of SG, at 395 and 385°C respectively. This implies that YP lignin is more thermally stable compared to SG lignin with the presence of a more condensed molecular structure. Eventually, a carbon residue forms at 700°C with approximately 40 wt% fixed carbon. Figure 4B presents typical DSC curves of both lignin structures, which is used to determine the glass transition behaviors of the lignins. The glass transition temperature (Tg) of SG lignin (155°C) is higher than that of YP lignin (142°C) due to more hydroxyl groups in SG samples. Hydroxyl groups play an important role in affecting the thermal properties of lignin, especially the Tg. The existence of hydroxyl groups leads to the formation of hydrogen bonds that subsequently limits molecular movement (Kubo and Kadla, 2005; Hosseinaei et al., 2017).
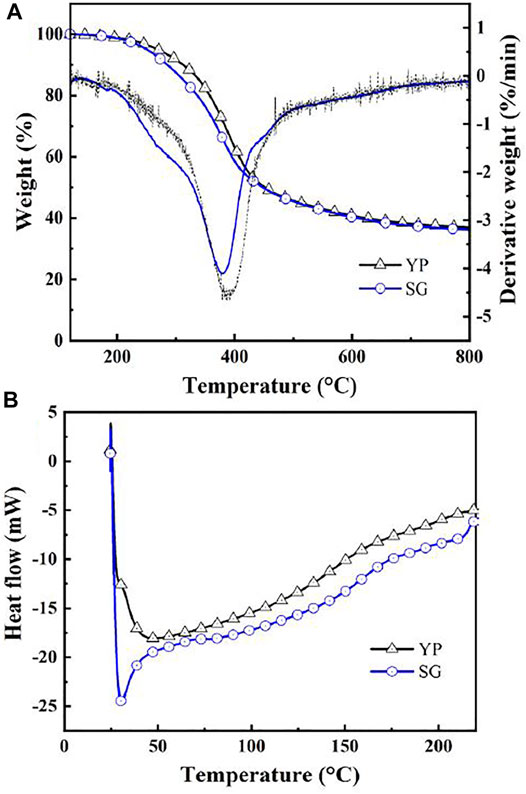
FIGURE 4. (A) TGA and (B) DSC curves of YP and SG lignin precursors.
3.2 Surface Characteristics of Activated Carbons
Figures 5A,B demonstrate SEM images of pyrolyzed lignin from YP and SG lignin (i.e., YP-py and SG-py) obtained upon thermal pyrolysis at 1,000°C. As illustrated in Figure 5, the pyrolyzed lignin exhibits contiguous morphology where the YP-py appears as flat sheets containing numerous cavities, while the SG-py is formed as curved structure. This observation reflects that lignin carbonization occurs during the pyrolysis process, inducing decomposition along with char formation. This dynamic interaction results in releasing gaseous compounds, including oxygen and hydrogen in the form of CO, CO2, H2, CH4, etc. (Rodríguez Correa et al., 2017). This promotes the formation of condensable volatiles due to free radicals generated after the cleavage of inner bonds, usually the C‒O bond in the β- O-4’ substructures (Britt, 1995). Of note, S-type lignin includes a higher amount of C‒O bonds compared to H- and G-type lignin. The quantitative CHN comparison between these two lignin structures also confirms this trend (i.e., the SG lignin contains higher O/C ratio (∼50.4%) than YP (∼44.3%), as summarized in Supplementary Table S2). This correlation implies the SG lignin is more easily decomposed compared to the YP lignin upon thermal pyrolysis. After pyrolysis, the lignin is converted into char with high carbon content and abundant surface functional groups, but limited surface area (Liu et al., 2015). As shown in Supplementary Figure S1, XPS survey-scan spectra confirms the presence of carbon (C 1s) and oxygen (O 1s) in both pyrolyzed lignin samples. In addition, it is notable that there is a small amount of inorganic impurity, which is sodium (Na 1s) peak located at ∼1,072 eV, in YP-py sample. Elemental analysis shows the O/C ratio of SG-py (∼8.1%) is lower than YP-py (∼15.2%), and there is ∼3.6% Na in YP-py. The surface area obtained by BET measurements of YP-py and SG-py samples are all negligible (YP-py: 0.02 m2 g−1 and SG-py: 0.11 m2 g−1). It is well documented that both surface area and pore volume increase as a result of the activation process (C.-T, 1998). The increase in porosity of YP-AC and SG-AC can be attributed to the opening of closed pores and/or enlarging of the micropores due to gasification of the carbon during the activation process (Kinoshita, 1988).
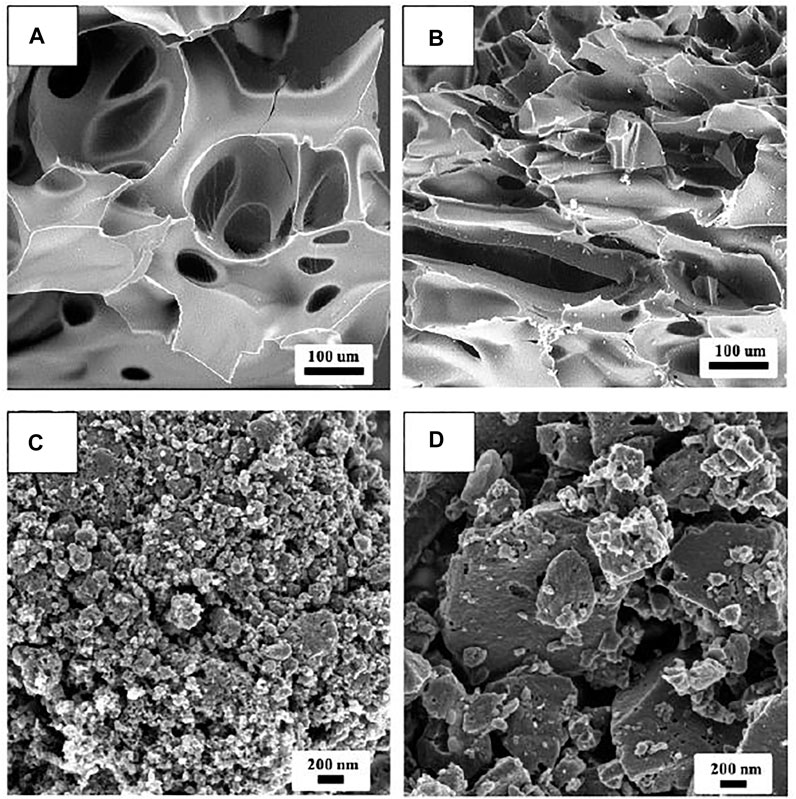
FIGURE 5. SEM images of different lignin precursors: (A) YP-py and (B) SG-py and SEM images of different ball-milled AC samples: (C) YP-AC and (D) SG-AC.
SEM images of activated carbons prepared from YP and SG lignin are illustrated in Figures 5C,D, respectively. According to Figure 5, it is obvious that the smaller carbonaceous aggregate size, and greater porosity is present with YP-AC compared with SG-AC. Supplementary Table S4 includes characteristics of different porous carbons determined from analysis of the N2 adsorption isotherms at -196°C. Based on BET measurements, the YP-AC sample possesses a specific surface area of ∼1,070 m2 g−1, which is approximately two times higher than that of SG-AC (∼507 m2 g−1). The YP-AC sample contains a higher percentage of mesopore (∼44%), whereas the SG-AC is mainly microporous due to the presence of 89% micropore volume. The DFT method was employed to analyze the full-range pore size distribution of both carbon samples, as shown in Supplementary Figure S2. The DFT analysis reveals different pore size distributions within the structure, where the YG-AC sample possesses a sharp peak at the pore size of ca. 1‒2 nm, and a smaller but broad distribution ranging up to 50 nm, while the SG-AC sample exhibits one major lump at ca. 1–2 nm. Since both carbon samples were thermally treated through a similar pyrolysis and two-step activation method, this variation in the morphology of the activated porous electrodes implies that surface area, porosity, and pore size distribution is strongly dependent on the lignin nature.
Physical activation usually involves three mechanisms, including surface burn-off, pore deepening, and pore widening during the carbon gasification (i.e., activation process). For the YP carbon with high O/C ratio, it is more prone to surface burn off and the oxidation reaction induced by the oxygen functional groups that facilitate the pore widening by destroying the microporous structures (Teng and Hsieh, 1998). On the other hand, the extent of carbon agglomeration in YP-py is less than that in SG-py, indicating more surface area of YP-py is accessible to CO2/H2O upon activation. More pores could be evenly widened and the closed micropores are allowed to be opened during gasification (Teng et al., 1996). In addition, it has been demonstrated that the presence of Na has a significant catalytic effect during the activation, (Rodrguez-Mirasol et al., 1993; Liu et al., 2015), which contributes to the high surface area of YP-AC. As for the SG carbon, with relatively low O/C ratio, the accessibility of the activation agents, H2O and CO2, increases with the extent of the burn-off and subsequently results in a parallel reaction step with pore deepening and pore widening. The difference between the YP and SG chars results in different porosities as well as pore size distributions. Therefore, the O/C ratio, char structure, and inorganic impurities are key factors that lead to highly porous ACs.
Elemental analysis shows that the YP-AC and SG-AC contain high O/C atomic ratios of 7.3 and 10.5%, respectively. This observation reveals that both produced ACs possess high oxidation levels (i.e., many oxygen functionalities attached to porous carbon). XPS spectra (see Figure 6A,B) were obtained to confirm the presence of surface functional groups on the carbons. The full spectra are presented in Figure 6A with the typical C 1s and O 1s peaks located at ∼285 and ∼531 eV, respectively. The C 1s peak (shown in Figure 6B) was split into three peaks located at 284.6 ± 0.1 eV (C=C or C–C), 286.5 ± 0.1 eV (C-O) and 288.9 ± 0.1 eV (C=O or O-C=O). This result is further confirmed by FTIR spectra, which are displayed in Figure 6C,D. The peak occurring at ca. 1,540 cm−1 is assigned to the presence of C=C stretching (Tang et al., 2012). The strong peaks in the range of 800–1,300 cm−1 are due to stretching of the C‒O and–COOH bonds (Yang et al., 2012; Russo et al., 2014; Vinayan et al., 2016). The transmittance peak appears at around 1740 cm−1, mainly originating from the C=O stretch in various functional groups (i.e. ketones, carbonyls, esters, carboxylic acid groups, etc.) (Periasamy et al., 2009; Kharangarh et al., 2018). Based on the FTIR spectra, oxygen functional groups exist on both activated carbons samples, attached to edge or basal plane of carbons.
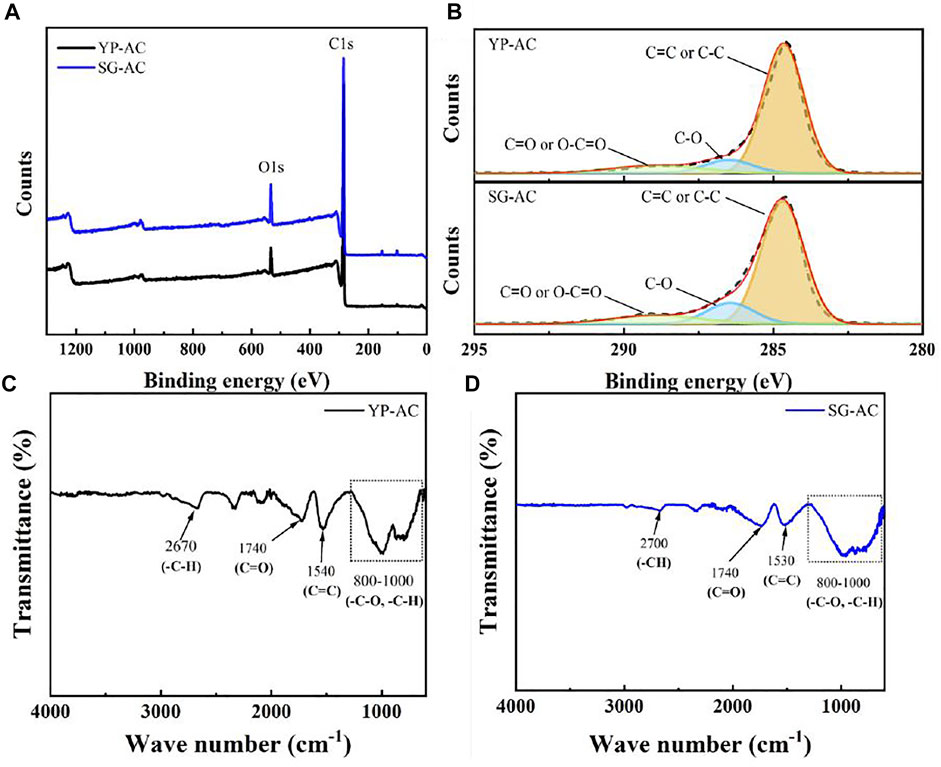
FIGURE 6. (A) Survey-scan XPS spectra of YP-AC and SF-AC samples, (B) C 1s peak of YP-AC and SG-AC samples. FTIR spectra of activated carbons (C) YP-AC and (D) SG-AC.
3.3 Electrochemical Performance of Supercapacitors
Typical CV curves of capacitors assembled with YP and SG carbons were recorded within the potential range of 0–1 V at various sweep rates as illustrated in Figure 7A,B. As shown in Figure 7, the voltammograms of the carbon electrodes display an obvious pair of redox peaks at 0.3–0.5 V. The CV profiles demonstrate a pseudo capacitance behavior where the induced current increases with increasing sweep rate. Additionally, a rectangular voltammogram, in which the current quickly reaches and maintains a relatively constant magnitude (Figure 7) upon reversal of the potential sweep can be maintained, although it shows current leakage at such high sweep rates (e.g., 100 mV s−1) for both capacitors. The current density of the supercapacitors assembled with the YP carbon electrode was higher compared to that of SG electrodes due to larger available surface area of the YP carbon structure, enabling 1) the formation of electric double-layer and 2) the redox reaction in the presence of oxygen functionalities.
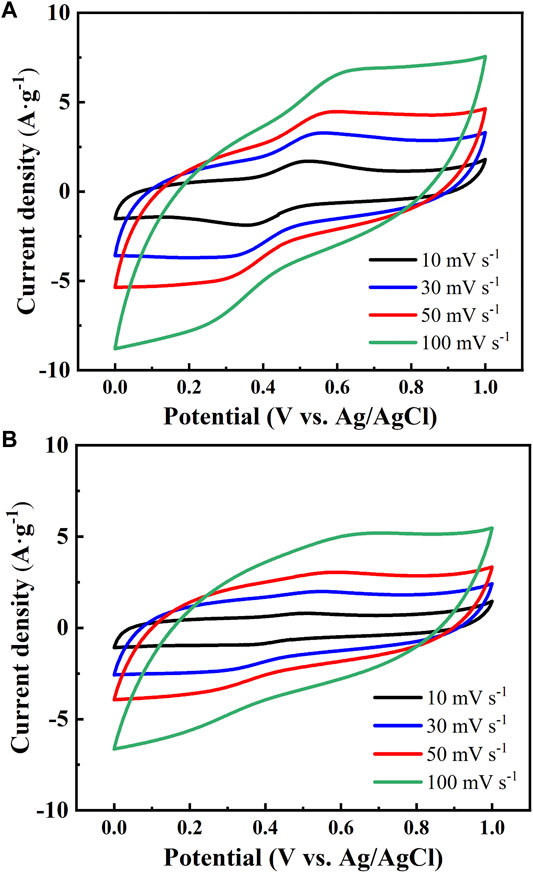
FIGURE 7. Cyclic voltammetry profiles of (A) YP-AC and (B) SG-AC electrodes in 1 M H2SO4 at different scan rates.
The formation of carbon electric double layer with acidic electrolyte and subsequent charge/discharge processes can be formulated using equation (R1) (Zheng et al., 1997; Hsieh and Teng, 2002):
Here, C* is the active carbon sites, H+ represents the protons, and the double layer where the charges accumulated separately on two sides of the interface is shown as//. It formulates a physical adsorption process induced by electrostatic forces between the carbon substrate and the protons. The pseudocapacitance, originated from the oxygen functional groups with electron-accepting properties, such as carbonyl and quinone groups, also induces redox reactions during the electron transfer process (Hsieh and Teng, 2002; Conway, 2013):
where CxO* represents carbonyl and quinone groups. Since YP carbon has higher porosity with an increased oxidation level, it provides more hydrophilic sites accessible for the double-layer formation and redox reaction, promoting the progress of (R1) and (R2) reactions.
Figure 8A,B show typical charge-discharge profiles of YP and SG capacitors at 0.5 and 2.5 mA cm−2, respectively. The YP capacitor exhibits higher capacitance for both charge and discharge cycles and demonstrates reduced ‘IR drop’ at the beginning of discharge. Such a small “IR drop” is mostly due to higher ionic conductivity and lower diffusion resistance of the electrolyte within the porous carbon structure (Conway, 2013). Also, as shown in Figure 8, one charge-discharge plateau at 0.4–0.5 V, attributed to the pseudocapacitance from the redox reaction step (R2). The variation of specific capacitance with discharge current density, from 0.1 to 2.5 mA cm−2, is depicted in Figure 8C. At 0.1 mA cm−2, the specific capacitances of YP and SG were ∼367 and 221 F g−1, respectively. The specific capacitance was found to decrease with increasing discharge current, which displays a trend confirmed by other research (Hsieh et al., 2010).
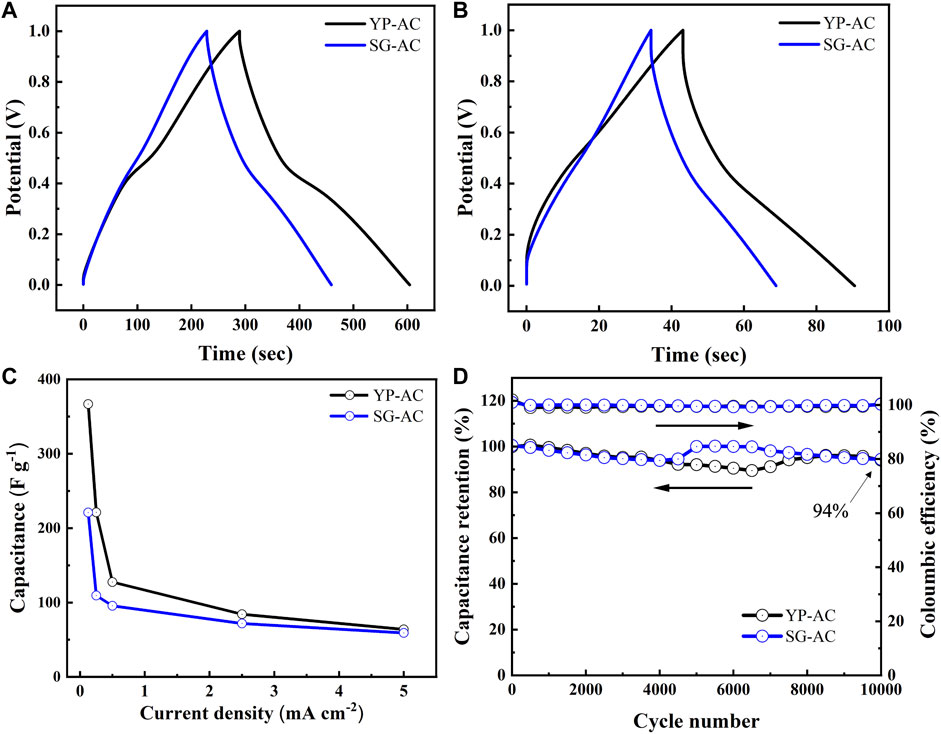
FIGURE 8. Charge-discharge curves of different capacitors at (A) 0.5 and (B) 2.5 mA cm−2, (C) variation of specific capacitance with current density, and (D) cyclic performance of different capacitors at 10 mA cm−2.
To assess the stability of as-prepared porous electrodes, extended charge-discharge cycling was performed at 10 mA cm−2. The capacitors equipped with YP-AC and SG-AC electrodes were charged and discharged between 0 and 1 V repeatedly, as shown in Figure 8D. Analyzing the variation of discharge capacitance with cycle number revealed that the YP capacitor has superior and stable capacitance (capacitance retention >90%) and exhibits excellent Coulombic efficiency (>99%) over long-term cycling (>10,000 cycles). The weakening of the Faraday reactions after long-term cycling is one of the reasons that cause the slight decrease of capacitance retention (∼94%) after 10,000 cycles. We also noticed that both capacitors show the trend during cycling: the capacitance first decreases then increases. We speculate that this phenomenon results from the electrodes needing time to fully wet the complex porous structures, especially at fast charge and discharge rates. YP-AC electrode took a longer time than SG-AC, as the surface area of YP-AC is doubled that of SG-AC.
The EIS technique was employed to analyze the electrochemical behavior of the capacitors assembled with various lignin-based electrodes. The impedance spectra of different capacitors are shown as Nyquist plots in Figure 9A. As illustrated in Figure 9, the high-frequency intersection with the real axis represents the electrolyte resistance (RE), followed by a single quasi-semicircle in the high-frequency region (100 kHz - 1 Hz). The semicircle in the high-frequency region is due to combined effect of interfacial resistances (between activated carbon composites and current collector (RI//CI)), as well as the charge transfer impedance (RCT//CDL, a double-layer capacitance in parallel with a resistance) (Kinoshita, 1988). The EIS spectra also include a linear regime in the low frequency region corresponding to the capacitive response of the porous carbons (McCreery et al., 1994). The equivalent circuit model used for simulating the impedance behavior of the capacitors is shown in the inset of Figure 9A. The Z-view software package was adopted for fitting the EIS spectra with the equivalent circuit model. The overall resistance, so-called “equivalent series resistance”, RES (= RE + RI + RCT), was composed of the electrolyte resistance, interfacial impedance, and charge transfer resistance. The RES values were 28.7 and 24.8 Ω for YP and SG capacitors, respectively. The slightly higher RES value of YP electrode is attributed to higher surface area and more complex porous structure, resulting in the high resistance for charge transfer within the pore structure.
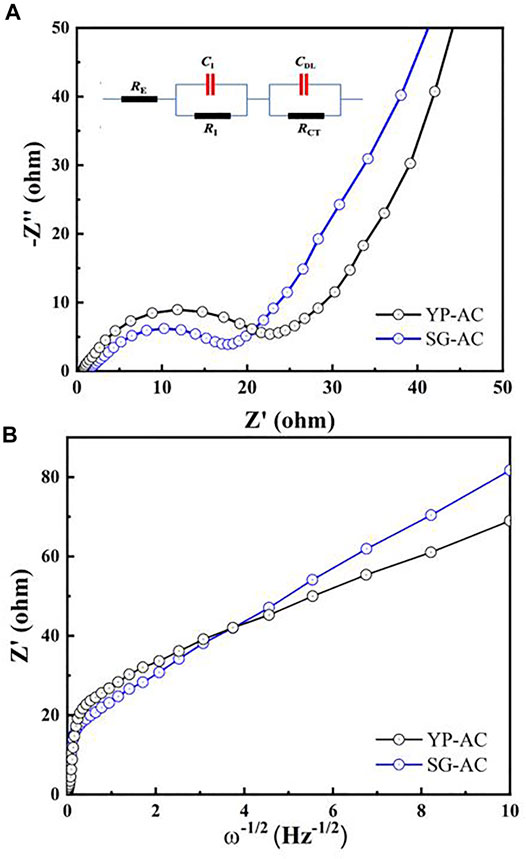
FIGURE 9. (A) Nyquist plots of different capacitors at OCV, where an equivalent circuit was proposed for describing the impedance behavior within the frequency range between 100 kHz and 1 Hz. (B) Randles plots of different capacitors at open circuit voltage.
As shown in Figure 9A, the Nyquist plot displays an inclined line at low frequencies (<1 Hz), resulting from the solid-state diffusion process of protons within the porous electrodes. Meanwhile, Warburg impedance (ZD) in the electrodes can be formulated as ZD = kW ω−1/2 (1 − j), based on semi-infinite diffusion model. Here, kW represents the Warburg coefficient and ω (= 2πƒ) is the angular frequency (f). Figure 9B presents the “Randles plot”, Re Z’ versus ω−1/2, for both capacitors. The diffusion coefficients (D) determined from the kW value were 4.77 × 10⁻¹⁰ and 2.16 × 10⁻¹⁰ cm2 s−1 for the YP and SG capacitors, respectively, detailing the D value of YP capacitor was more than two times higher than that of SG. This finding reveals that the ionic diffusion resistance is significantly alleviated for the YP electrodes, leading to fast redox reaction (i.e., R2) and rapid formation of electric double-layer (i.e., R1) in the mesoporous carbon. Accordingly, the unique pore texture of the YP structure significantly facilitates the electrochemical reactions. Shorter diffusion path, along with increased mesopores and surface area available for energy storage with the YP carbon structure, were the major contributing factors for the improved performance.
3.4 Techno-Economic Analysis
To demonstrate the economic feasibility of the approach, the minimum selling price (MSP) of activated carbons produced by using YP and SG as feedstocks is estimated. Four steps are taken to perform techno-economic analysis.
3.4.1 Process Synthesis
First, a process is designed to convert biomass to activated carbons. The process consists of eight areas as shown in Figure 10, resulting in the production of cellulose, furfural, and activated carbons. Fractionations were performed in 1 L reactors with 30% biomass loading scale. The purpose of the biomass fractionation area (A100) is to isolate the solid cellulose fraction from the dissolved hemicellulose and lignin fractions. The liquid fraction from A100, containing C5 sugars and lignin is sent to lignin recovery area (A200). While GVL solubilizes lignin, by adding water lignin is precipitated, while the C5 sugars remain soluble. The liquid stream containing C5 sugars from A200 is concentrated and sent to furfural production area (A300) for converting it to furfural. The effluent stream from the furfural production reactor contains water, GVL, and furfural. To obtain pure furfural as an additional co-product, it needs to be separated from GVL and water. Furfural and water are readily separated from the high-boiling point GVL (208°C), facilitated by the low boiling point of the furfural/water azeotrope. Separation of furfural and water is similar to the distillation step currently used in the commercial production of furfural (Zeitsch, 2000). More details regarding the areas A100, A200, and A300 were previously reported by Alonso et al. (Alonso et al., 2017).
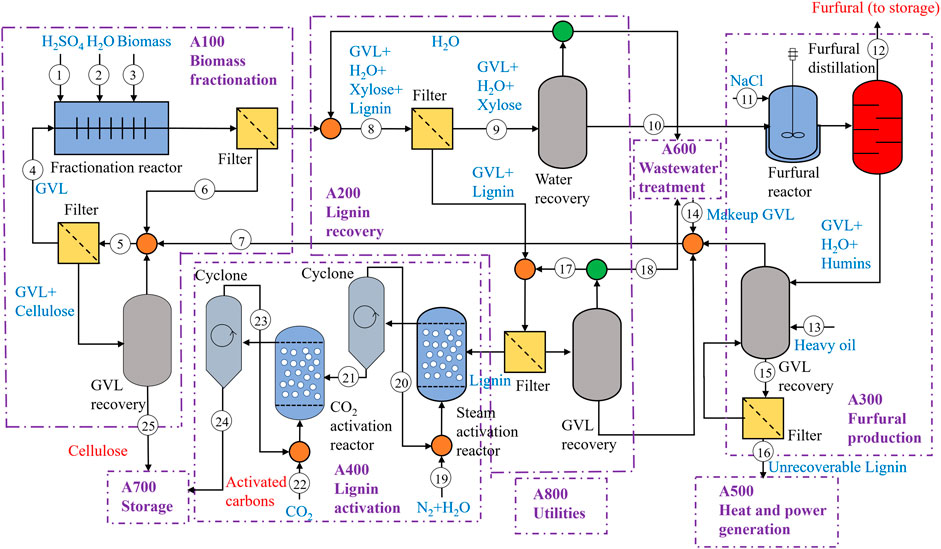
FIGURE 10. Simplified process flow diagram to produce activated carbons, furfural, and cellulose from biomass.
Lignin recovered from A200 is sent to the lignin activation area (A400), where it is reduced to activated carbons. Lignin is carbonized in a nitrogen atmosphere at 1,000°C and 1 bar. We assumed that an air separation unit is installed onsite for supplying the required N2. The required mass ratio of N2/lignin is 11 for both YP and SG lignin. The reactor effluent contains components in solid and gas phases, which are separated by a cyclone. The activation takes place in a mixed atmosphere of steam and nitrogen in a reactor operating at 800°C and 1 bar. The required mass ratio of gas to inlet solid is 13 for SG and 14.4 for YP lignin. The solids from the second activation reactor are further reduced in the presence of CO2 in the third reactor operating at 800°C and 1 bar. We assume that the required amount of CO2 is available for purchase. The mass ratio of solid to gas required for SG and YP lignin are 2.9 and 2.2, respectively. According to the process described 1 MT of YP is converted to 521 kg of cellulose (70% pure), 40 kg of activated carbons, and 50 kg of furfural (99% pure) and 1 MT of SG is converted to 410 kg of cellulose (83% pure), 55 kg of activated carbons, and 149 kg of furfural (99% pure).
Ancillary areas including heat and power generation (A500), wastewater treatment (A600), storage (A700), and utilities (A800) are included in the design. Unrecoverable lignin and natural gas required to meet the process heating and electricity requirements are combusted in A500. Most of the heating demand is met from the evaporators used to recover GVL and distillation columns and the electricity demand is met from the compressors and the air separation unit. The process wastewater streams are treated by anerobic and aerobic digestion in A600. Area A700 is used to store bulk chemicals. Area A800 includes a cooling water system, chilled-water system, process water manifold, and power systems.
3.4.2 Process Modeling
Second, based on experimental results, Aspen Plus process models are developed to estimate material and energy flows. The base design considers annual production rate of 5.5 kton of activated carbons. This production rate is chosen to mitigate the risks associated with initial investment scale and ensure that only a fraction of the current market volume of supercapacitor-grade carbon is produced. The NRTL model is used as the thermodynamic model used for the simulation. The material flow information for the main streams and energy consumption in each process areas are given in Supplementary Table S5 and the process flow diagram of the Aspen Plus model is shown in Supplementary Figure S3.
Next, the total energy requirements of the process are estimated after heat integration is performed. The heating, cooling, and power requirements of the process with YP as the feedstock are 10.8, 17.1, and 3.5 MW, respectively. When SG is used as the feedstock, the heating, cooling, and power requirements are 8 MW, 12.4 MW, and 2.5 MW, respectively. A part of the heating and electricity requirements are satisfied by combusting biomass residues and the remaining are satisfied by natural gas.
3.4.3 Estimating Capital and Operating Costs
Third, the capital costs as well as the variable and fixed operating costs are estimated. All equipment costs are adjusted to a common year (2019) using appropriate cost indices. The installed costs of all the areas except A400 are estimated based on the article by Alonso et al. (Alonso et al., 2017) using appropriate scaling factors. Detailed installed equipment costs of A400 are given in Supplementary Table S6 and a summary of the capital costs of different areas are provided in Supplementary Table S7. Total capital investment (TCI) is obtained by adding equipment installed costs to the costs associated with warehouse, site development, piping, office construction, project contingency, etc. (Davis et al., 2018). A summary of different components of TCI is given in Supplementary Table S8. The TCI of YP and SG biorefineries are estimated to be $229 million and $189 million, respectively. The main reason for the higher TCI of the YP-based biorefinery is the lower yield of activated carbons. The annual fixed operating costs accounting for salaries, maintenance, and insurance are estimated to be $9.3 million and $8.5 million for YP and SG biorefineries, respectively. Based on the raw material prices listed in Supplementary Table S9, the annual variable operating costs of YP and SG biorefineries are estimated to be $15.2 million and $12.1 million, respectively. The main reason for the higher TCI and operating costs of the YP-based biorefinery is the lower yield of activated carbons. Thus, to obtain the produce the same amount of activated carbon, YP-based biorefinery requires larger equipment and more energy to process higher material flows.
3.4.4 Process Economics
Fourth, a discounted cash flow analysis is used to determine the minimum selling price of activated carbons, under the financial assumptions given in Supplementary Table S10. The internal rate of return has been set at 30% instead of the typical 10% to reflect the higher risk of investing in a new technology. We assume that cellulose and furfural can be sold as coproducts. In recent years, cellulose price has varied between $700 - $900 per ton (Itlia, 2015). Because of the initial technical risk, a lower selling price of $700/ton is used for the SG-based cellulose. Since cellulose produced using YP is 70% pure, a selling price of $600/ton is assigned. Furfural price has ranged between $1,000-1800 per ton in the recent years (CN Chemicals, 2016). In our analysis, the price of furfural is fixed to $1,000 per ton, which is competitive in the current market. All coproducts (cellulose and furfural) are treated using a market value allocation approach in a consistent manner with the NREL’s studies (Biddy et al., 2016).
The results of the analysis are shown in Figure 11. The process areas for biomass fractionation, lignin recovery, and heat and power generation are the major cost contributors. The revenues from the production of cellulose and furfural significantly reduce the MSP of activated carbons. The activated carbons from YP and SG can be produced at an MSP of $8,493 and $6,670 per ton, respectively. Notably, the current selling price of supercapacitor-grade activated carbon is $13600/ton (Weinstein and Dash, 2013). The activated carbons produced, especially from YP lignin, demonstrated remarkable electrochemical performance.49 This illustrates that the proposed strategy of utilizing a lignin stream to produce activated carbons is promising and provides an opportunity for successful translation to an economically viable commercial process. The impact of the prices of cellulose and furfural on the MSP of activated carbons (shown in Figure 12) was also studied. If the price of cellulose is varied between $500-$1,000/ton and the furfural price varies in the range of $1,000-$1,500/ton, the MSP of YP and SG activated carbons range from $2,666-9,793/ton and $3080-8,162/ton, respectively. Because of the higher yield of furfural from SG, the furfural price impacts the MSP of SG activated carbons to a higher degree than YP-ACs.
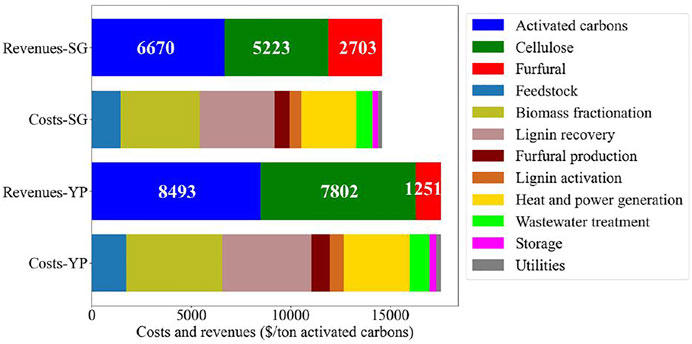
FIGURE 11. Cost breakdown by process area for SG and YP-based biorefineries.
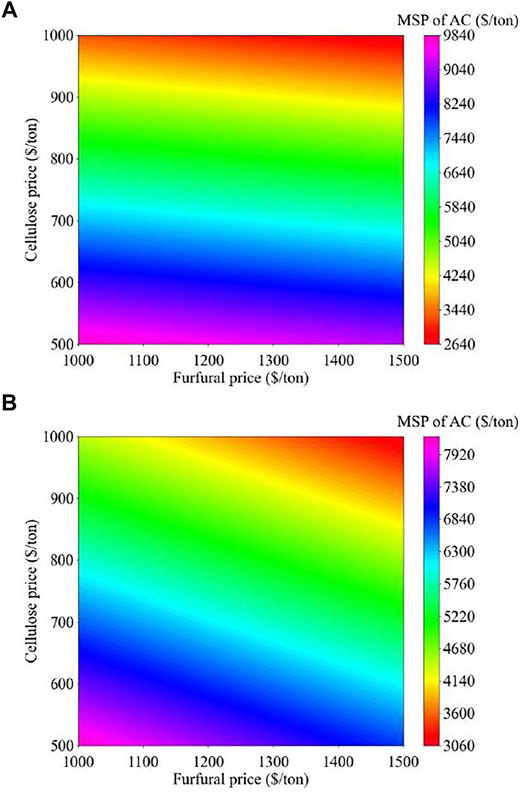
FIGURE 12. Impact of furfural and cellulose price on the MSP of activated carbons produced in (A) YP and (B) SG-based biorefineries.
4 Conclusion
This research employed two types of lignin (YP and SG) as the precursors for synthesizing porous activated carbon electrodes for supercapacitors. The pyrolysis and activation of lignin feedstocks results in porous activated carbons, with surface area and pore size distributions that can be tailored by feedstock choice and processing conditions. The structure of the ACs dictates adsorptive capacity and the diffusion rates of penetrating ions, which are reflected in the electrochemical performance of these materials as supercapacitors. 2D 1H‒13C NMR were used to characterize the S/G/H alcohol units of lignin-based electrodes, which are important indices in evaluating biochar structures and pore characteristics of the activated carbons. The different O/C ratios, carbon aggregations, and inorganic impurities between the YP and SG chars were determined to be critical factors inducing differing porosities and pore size distributions through a two-step activation process. Higher O/C ratios, less extent of carbon aggregations, and presence of inorganic impurities were easier to achieve for highly porous activated carbon structures. Based on the electrochemical performance of as-prepared electrodes, the specific capacitances of YP and SG capacitors reached 367 and 221 F g−1, respectively. The YP capacitor displayed stable capacitance (the capacitance retention: > 90%) and excellent Coulombic efficiency (>99%) over 10,000 cycles. Analyzing the Randles plots, the apparent D values, was determined to be 4.77 × 10⁻¹⁰ and 2.16 × 10⁻¹⁰ cm2 s−1 for the YP and SG capacitors, respectively. This remarkable performance improvement of the YP carbon electrodes was likely the result of a shorter diffusion path and higher available active surface area for energy storage. Techno-economic analysis indicates that YP and SG capacitors can be produced at a minimum selling price of $8,493 and $6,670 per ton, respectively, which is competitive with the price of commercially produced supercapacitors. The novel lignin-based activated porous carbon electrodes developed in this work paves the way for engineering inexpensive and high-performance electrode materials for various electrochemical energy devices.
Data Availability Statement
The raw data supporting the conclusions of this article will be made available by the authors, without undue reservation.
Author Contributions
Conceptualization, LY, C-TH, DA, IB, DH; methodology, LY, KS, IB, C-TH, ML, SD, YG, CM, DH; validation, LY, KS, IB, ML, HC.; formal analysis, LY, IB, C-TH, ML; resources, DK, SD, CM, DH; data curation, KS, DH.; writing—original draft preparation, LY, IB; writing—review and editing, KS, DK, DA, C-TH, ML, HC, SD, YG, DH; visualization, LY, IB; supervision, DH, DK, SD, CM; project administration, DH; funding acquisition, DH, DA, CM, SD. All authors have read and agreed to the published version of the manuscript.
Funding
This research was supported by a grant from the U.S. Department of Energy BioEnergy Technologies Office through the Biomass Research and Development Initiative award DE-EE0008353.0000. LY received partial support from the Center for Materials Processing, a Tennessee Higher Education Commission (THEC). DH acknowledges support from the USDA National Institute of Food and Agriculture, Hatch Project 1012359.
Conflict of Interest
Author D. M. A. is employed by Glucan Biorenewables LLC.
The remaining authors declare that the research was conducted in the absence of any commercial or financial relationships that could be construed as a potential conflict of interest.
Publisher’s Note
All claims expressed in this article are solely those of the authors and do not necessarily represent those of their affiliated organizations, or those of the publisher, the editors and the reviewers. Any product that may be evaluated in this article, or claim that may be made by its manufacturer, is not guaranteed or endorsed by the publisher.
Supplementary Material
The Supplementary Material for this article can be found online at: https://www.frontiersin.org/articles/10.3389/fenrg.2022.849949/full#supplementary-material
References
Adler, E. (1977). Lignin Chemistry?past, Present and Future. Wood Sci. Technol. 11, 169–218. doi:10.1007/bf00365615
Alonso, D. M., Hakim, S. H., Zhou, S., Won, W., Hosseinaei, O., Tao, J., et al. (2017). Increasing the Revenue from Lignocellulosic Biomass: Maximizing Feedstock Utilization. Sci. Adv. 3, e1603301. doi:10.1126/sciadv.1603301
Azadi, P., Inderwildi, O. R., Farnood, R., and King, D. A. (2013). Liquid Fuels, Hydrogen and Chemicals from Lignin: A Critical Review. Renew. Sustain. Energ. Rev. 21, 506–523. doi:10.1016/j.rser.2012.12.022
Biddy, M. J., Davis, R., Humbird, D., Tao, L., Dowe, N., Guarnieri, M. T., et al. (2016). The Techno-Economic Basis for Coproduct Manufacturing to Enable Hydrocarbon Fuel Production from Lignocellulosic Biomass. ACS Sustain. Chem. Eng. 4, 3196–3211. doi:10.1021/acssuschemeng.6b00243
Britt, P. F., Buchanan, A. C., Thomas, K. B., and Lee, S.-K. (1995). Pyrolysis Mechanisms of Lignin: Surface-Immobilized Model Compound Investigation of Acid-Catalyzed and Free-Radical Reaction Pathways. J. Anal. Appl. Pyrolysis 33, 1–19. doi:10.1016/0165-2370(94)00846-s
Calvo-Flores, F. G., and Dobado, J. A. (2010). Lignin as Renewable Raw Material. ChemSusChem 3, 1227–1235. doi:10.1002/cssc.201000157
Carrott, S. P. J. M., and Ribeiro Carrott, M. M. (2007). Lignin--from Natural Adsorbent to Activated Carbon: A Review. Bioresour. Technol. 98, 2301–2312. doi:10.1016/j.biortech.2006.08.008
CN Chemicals (2016). CCM: Furfural: export price Falls to Record Low in May 2016. [Online]. Kcomber Inc. Available: http://www.cnchemicals.com/Press/87387-CCM:%20Furfural:%20export%20price%20falls%20to%20record%20low%20in%20May%202016.html (Accessed June 2021).
Conway, B. E. (2013). Electrochemical Supercapacitors: Scientific Fundamentals and Technological Applications. Ottawa, Ontario: Springer US.
Das, L., Li, M., Stevens, J., Li, W., Pu, Y., Ragauskas, A. J., et al. (2018). Characterization and Catalytic Transfer Hydrogenolysis of Deep Eutectic Solvent Extracted Sorghum Lignin to Phenolic Compounds. ACS Sustain. Chem. Eng. 6, 10408–10420. doi:10.1021/acssuschemeng.8b01763
Davis, R. E., Grundl, N. J., Tao, L., Biddy, M. J., Tan, E. C., Beckham, G. T., et al. (2018). Process Design and Economics for the Conversion of Lignocellulosic Biomass to Hydrocarbon Fuels and Coproducts: 2018 Biochemical Design Case Update; Biochemical Deconstruction and Conversion of Biomass to Fuels and Products via Integrated Biorefinery Pathways (No. NREL/TP-5100-71949). Golden, CO: National Renewable Energy Lab (NREL).
Gosselink, R. J. A., De Jong, E., Guran, B., and Abächerli, A. (2004). Co-ordination Network for Lignin-Standardisation, Production and Applications Adapted to Market Requirements (EUROLIGNIN). Ind. Crops Prod. 20, 121–129. doi:10.1016/j.indcrop.2004.04.015
Guerra, A., Lucia, L. A., and Argyropoulos, D. S. (2008). Isolation and Characterization of Lignins from Eucalyptus Grandis Hill Ex Maiden and Eucalyptus Globulus Labill. By Enzymatic Mild Acidolysis (EMAL). Holzforschung 62, 24–30. doi:10.1515/hf.2008.004
Han, J., Jeong, S.-Y., Lee, J. H., Choi, J. W., Lee, J.-W., and Roh, K. C. (2018). Structural and Electrochemical Characteristics of Activated Carbon Derived from Lignin-Rich Residue. ACS Sustain. Chem. Eng. 7, 2471–2482. doi:10.1021/acssuschemeng.8b05351
Hosseinaei, O., Harper, D. P., Bozell, J. J., and Rials, T. G. (2016). Role of Physicochemical Structure of Organosolv Hardwood and Herbaceous Lignins on Carbon Fiber Performance. ACS Sustain. Chem. Eng. 4, 5785–5798. doi:10.1021/acssuschemeng.6b01828
Hosseinaei, O., Harper, D. P., Bozell, J. J., and Rials, T. G. (2017). Improving Processing and Performance of Pure Lignin Carbon Fibers through Hardwood and Herbaceous Lignin Blends. Int. J. Mol. Sci. 18, 1410. doi:10.3390/ijms18071410
Hsieh, C.-T., and Lin, Y.-T. (2006). Synthesis of Mesoporous Carbon Composite and its Electric Double-Layer Formation Behavior. Micropor. Mesopor. Mater. 93, 232–239. doi:10.1016/j.micromeso.2006.02.017
Hsieh, C.-T., and Teng, H. (2000). Influence of Mesopore Volume and Adsorbate Size on Adsorption Capacities of Activated Carbons in Aqueous Solutions. Carbon 38, 863–869. doi:10.1016/s0008-6223(99)00180-3
Hsieh, C.-T., and Teng, H. (2002). Influence of Oxygen Treatment on Electric Double-Layer Capacitance of Activated Carbon Fabrics. Carbon 40, 667–674. doi:10.1016/s0008-6223(01)00182-8
Hsieh, C.-T., Chen, W.-Y., and Cheng, Y.-S. (2010). Influence of Oxidation Level on Capacitance of Electrochemical Capacitors Fabricated with Carbon Nanotube/Carbon Paper Composites. Electrochim. Acta 55, 5294–5300. doi:10.1016/j.electacta.2010.04.085
Huang, J. B., Patra, J., Lin, M. H., Ger, M. D., Liu, Y. M., Pu, N. W., et al. (2020). A Holey Graphene Additive for Boosting Performance of Electric Double-Layer Supercapacitors. Polymers (Basel) 12, 765. doi:10.3390/polym12040765
Itlia, C. (2015). The International Cellulose Market. [Online]. Tecniche Nuove Spa. Available at: https://www.paperindustryworld.com/the-international-cellulose-market/(Accessed, June 2021).
Kharangarh, P. R., Umapathy, S., and Singh, G. (2018). Thermal Effect of Sulfur Doping for Luminescent Graphene Quantum Dots. ECS J. Solid State. Sci. Technol. 7, M29–M34. doi:10.1149/2.0041803jss
Kilpelaeinen, I., Sipilae, J., Brunow, G., Lundquist, K., and Ede, R. M. (1994). Application of Two-Dimensional NMR Spectroscopy to Wood Lignin Structure Determination and Identification of Some Minor Structural Units of Hard- and Softwood Lignins. J. Agric. Food Chem. 42, 2790–2794. doi:10.1021/jf00048a026
Kubo, S., and Kadla, J. F. (2005). Hydrogen Bonding in Lignin: A Fourier Transform Infrared Model Compound Study. Biomacromolecules 6, 2815–2821. doi:10.1021/bm050288q
Liu, X., and Osaka, T. (1997). Properties of Electric Double‐Layer Capacitors with Various Polymer Gel Electrolytes. J. Electrochem. Soc. 144, 3077–3071. doi:10.1149/1.1837960
Liu, W.-J., Jiang, H., and Yu, H.-Q. (2015). Thermochemical Conversion of Lignin to Functional Materials: a Review and Future Directions. Green. Chem. 17, 4888–4907. doi:10.1039/c5gc01054c
McCreery, R. L., Cline, K. K., Mcdermott, C. A., and Mcdermott, M. T. (1994). Control of Reactivity at Carbon Eletrode Surfaces. Colloids Surf. A. 93, 211–219. doi:10.1016/0927-7757(94)02899-0
McKendry, P. (2002). Energy Production from Biomass (Part 2): Conversion Technologies. Bioresour. Techn. 83, 47–54. doi:10.1016/s0960-8524(01)00119-5
Pandey, M. P., and Kim, C. S. (2011). Lignin Depolymerization and Conversion: A Review of Thermochemical Methods. Chem. Eng. Technol. 34, 29–41. doi:10.1002/ceat.201000270
Periasamy, A., Muruganand, S., and Palaniswamy, M. (2009). Vibrational Studies of Na2SO4, K2SO4, NaHSO4 and KHSO4 Crystals. Rasayan J.Chem. 2, 981–989. Available at: http://rasayanjournal.co.in/vol-2/issue
Qu, D., and Shi, H. (1998). Studies of Activated Carbons Used in Double-Layer Capacitors. J. Power Sourc. 74, 99–107. doi:10.1016/s0378-7753(98)00038-x
Roberts, J. C. (1996). “The Chemistry of Lignin and its Removal,” in The Chemistry of Paper. Manchester, UK: The Royal Society of Chemistry, 26–51.
Rodrguez-Mirasol, J., Cordero, T., and Rodriguez, J. (1993). Activated Carbons from Carbon Dioxide Partial Gasification of eucalyptus Kraft Lignin. Energy Fuels 7, 133–138.
Rodríguez Correa, C., Stollovsky, M., Hehr, T., Rauscher, Y., Rolli, B., and Kruse, A. (2017). Influence of the Carbonization Process on Activated Carbon Properties from Lignin and Lignin-Rich Biomasses. ACS Sustain. Chem. Eng. 5, 8222–8233. doi:10.1021/acssuschemeng.7b01895
Rowlandson, J. L., Edler, K. J., Tian, M., and Ting, V. P. (2020). Toward Process-Resilient Lignin-Derived Activated Carbons for Hydrogen Storage Applications. ACS Sustain. Chem. Eng. 8, 2186–2195. doi:10.1021/acssuschemeng.9b05869
Russo, P., Hu, A., Compagnini, G., Duley, W. W., and Zhou, N. Y. (2014). Femtosecond Laser Ablation of Highly Oriented Pyrolytic Graphite: A Green Route for Large-Scale Production of Porous Graphene and Graphene Quantum Dots. Nanoscale 6, 2381–2389. doi:10.1039/c3nr05572h
Souto, F., Calado, V., and Pereira, N. (2018). Lignin-based Carbon Fiber: a Current Overview. Mater. Res. Express 5, 1–30. doi:10.1088/2053-1591/aaba00
Tang, L., Ji, R., Cao, X., Lin, J., Jiang, H., Li, X., et al. (2012). Deep Ultraviolet Photoluminescence of Water-Soluble Self-Passivated Graphene Quantum Dots. ACS Nano 6, 5102–5110. doi:10.1021/nn300760g
Teng, H., and Hsieh, C.-T. (1998). Influence of Surface Characteristics on Liquid-phase Adsorption of Phenol by Activated Carbons Prepared from Bituminous Coal. Ind. Eng. Chem. Res. 37, 3618–3624. doi:10.1021/ie970796j
Teng, H., Ho, J.-A., Hsu, Y.-F., and Hsieh, C.-T. (1996). Preparation of Activated Carbons from Bituminous Coals with CO2 Activation. 1. Effects of Oxygen Content in Raw Coals. Ind. Eng. Chem. Res. 35, 4043–4049. doi:10.1021/ie960170d
Vinayan, B. P., Zhao-Karger, Z., Diemant, T., Chakravadhanula, V. S. K., Schwarzburger, N. I., Cambaz, M. A., et al. (2016). Performance Study of Magnesium-Sulfur Battery Using a Graphene Based Sulfur Composite Cathode Electrode and a Non-nucleophilic Mg Electrolyte. Nanoscale 8, 3296–3306. doi:10.1039/c5nr04383b
Weinstein, L., and Dash, R. (2013). Supercapacitor Carbons. Mater. Today 16, 356–357. doi:10.1016/j.mattod.2013.09.005
Yang, Z., Yao, Z., Li, G., Fang, G., Nie, H., Liu, Z., et al. (2012). Sulfur-Doped Graphene as an Efficient Metal-free Cathode Catalyst for Oxygen Reduction. ACS Nano 6, 205–211. doi:10.1021/nn203393d
Yoshida, T., Oshima, Y., and Matsumura, Y. (2004). Gasification of Biomass Model Compounds and Real Biomass in Supercritical Water. Biomass Bioenergy 26, 71–78. doi:10.1016/s0961-9534(03)00063-1
Zeitsch, K. J. (2000). The Chemistry and Technology of Furfural and its Many By-Products. Köln, Germany: Elsevier.
Keywords: lignin, economic analysis, γ-valerolactone, activated carbon, supercapacitors
Citation: Yu L, Seabright K, Bajaj I, Keffer DJ, Alonso DM, Hsieh C-T, Li M, Chen H, Dai S, Gandomi YA, Maravelias CT and Harper DP (2022) Performance and Economic Analysis of Organosolv Softwood and Herbaceous Lignins to Activated Carbons as Electrode Materials in Supercapacitors. Front. Energy Res. 10:849949. doi: 10.3389/fenrg.2022.849949
Received: 06 January 2022; Accepted: 03 February 2022;
Published: 07 March 2022.
Edited by:
Xiaojun Shen, Dalian Institute of Chemical Physics (CAS), ChinaReviewed by:
Kunfeng Chen, Shandong University, ChinaMaria Gonzalez Alriols, University of the Basque Country, Spain
Yun Ji, University of North Dakota, United States
Copyright © 2022 Yu, Seabright, Bajaj, Keffer, Alonso, Hsieh, Li, Chen, Dai, Gandomi, Maravelias and Harper. This is an open-access article distributed under the terms of the Creative Commons Attribution License (CC BY). The use, distribution or reproduction in other forums is permitted, provided the original author(s) and the copyright owner(s) are credited and that the original publication in this journal is cited, in accordance with accepted academic practice. No use, distribution or reproduction is permitted which does not comply with these terms.
*Correspondence: Chien-Te Hsieh, Y3Roc2llaEBzYXR1cm4ueXp1LmVkdS50dw==; David P. Harper, ZGhhcnBlcjRAdXRrLmVkdQ==