 Paloma Taltavull de La Paz
 Francisco Juárez Tárrega
 Zhenyu Su
 Paloma Monllor
- 1Department of Applied Economic Analysis, University of Alicante, Alicante, Spain
- 2ECOVISI Research Group, University of Alicante, Alicante, Spain
- 3Department of Economics, Xi’an Jiaotong-Liverpool University, Suzhou, China
- 4Department of Physiology, University of Valencia, Valencia, Spain
This study estimates housing quality and features explaining energy poverty in Spain and its regions. By using the EU-SILC dataset for 2008–2019, it calculates the hidden links between energy poverty indicators and housing features, controlled by other variables such as type of household, poverty, and housing tenancy. Confirmatory factor analysis is used to identify the role of different dimensions in explaining energy poverty at the household level. The empirical evidence finds three hidden factors associating energy poverty with poverty, poor housing quality, and housing size and outskirts location. These three factors enable classifying households accordingly, revealing their distribution across Spain and three of its 17 Spanish regions: Madrid, Cataluña, and Valencian Community. Findings indicate how the impact of energy poverty differs by region, rejecting the general hypothesis that all households in poverty live in poor housing because they cannot afford the maintenance costs, thus causing energy poverty. Results suggest that energy poverty due to poor housing quality and location affects many households that are not necessarily poor, with different impacts depending on location. The association between energy poverty and larger houses located on the outskirts represents new evidence in the literature and is one of the contributions of this study, together with the methodology for classification. Results suggest that retrofitting investment would be crucial in reducing energy poverty problems in Spain.
Introduction
Academics have addressed the problem of energy poverty since the 1990s. Seminal research (Boardman, 1991) has raised awareness of this new form of poverty, which has been echoed in rich literature during the present decade. The analyses determining the extent of and reasons for its existence in broader regions (Thomson and Snell, 2013) have demonstrated that energy poverty has a strong impact on households with some members over 60 years, families with children, disabled or chronically ill persons (O’Neill et al., 2006, pp. 8–9, cited in; Boardman, 2012, p. 23), which constitute the most vulnerable groups. Energy poverty is also related to household income inequality (e.g., Igawa and Managi, 2022).
Literature has documented the significant impact of energy poverty on vulnerable households. It is the determining reason for its inclusion as a priority target in two out of the 17 Sustainable Development Goals (Poverty and Affordable and Clean Energy) adopted by the United Nations in 2015. The European Union (EU) also highlighted it as a relevant problem (EU, 2020) and has begun its monitoring by creating the EU Energy Poverty Observatory (EPOV).
As research has investigated this form of poverty, it has become clear that it is difficult to measure and define it precisely. The accepted definition of energy poverty is “the situation in which a household finds it difficult or impossible to secure adequate heating in the home at an affordable price” [European Fuel Poverty and Energy Efficiency Consortium (EPEE), 2009] or “when a household is unable to ensure a sufficient level and quality of domestic energy services for its social and material needs” (Bouzarovski, 2018).
Although the origin seems clear, the causes are still under debate. The difficulty lies in defining when and how energy poverty occurs. Boardman’s 10% rule associates energy poverty with low income and households experiencing deprivation (Boardman, 1991)1. The general concept of energy poverty, based on the households’ income and living conditions perspective (energy expenses or income focus), is that households fall into this form of poverty when their energy costs are higher than other basic needs costs (O’Neill et al., 2006, EPOV), leaving them unable to cover the latter with their current resources2.
The existing studies assert that such a relationship is far from unique. Energy poverty results from a wide spectrum of situations, from housing features and conditions to short- and medium-term changes in energy market conditions, being strongly driven by low income or vulnerable situations on the one hand (Boardman, 2012; Castaño Rosa et al., 2020) or a lack of adequate infrastructure on the other hand (the latter being more common in emerging and developing countries (Ahmed and Gasparatos, 2020; Israel-Akinbo et al., 2018; Olang et al., 2018; Sokołowski, 2019). The need to identify and define policy solutions to energy poverty has led to official institutions generalizing the definition of energy poverty based on income as the best measure, providing a manageable tool to identify energy poverty and define measures to alleviate it (e.g., with LIHC and LILEE measures in the UK or with the energy poverty indicator or EPEE indicator in the EU).
The mechanism explaining the appearance of energy poverty associated with a lack of income is as follows: when income is insufficient to cover energy costs, households commonly react by reducing energy consumption, which, consequently, forces them to live in environments with inadequate warmth, cooling, lighting, and energy to power appliances, among other factors. In other words, the way for households to reduce energy costs is to reduce energy consumption (when the bill rises relative to their income, known as self-restriction of energy), which represents a reaction that increases energy poverty. The issue is that such a reaction would have limited visibility, creating situations in which energy poverty is a hidden reality for families and invisible in society. This is referred to as “hidden energy poverty,” first defined by Tirado-Herrero (2017, p. 1021) as those households with “very low actual energy consumption” and by recent contributions applying different methodologies to identify it (Betto et al., 2020; Karpinska and Śmiech, 2020; Quishpe et al., 2019). Analyzing two Austrian cities, Eisfeld and Seebauer (2022) highlighted that hidden energy poverty resulting from energy self-restriction would result from two sources: poverty or low income and housing conditions.
In addition, households cannot avoid fulfilling the existing energy market conditions, with no possibility of having an influence other than self-restricting energy consumption. Households are energy-price-acceptant; they represent a captive demand in this sector and will fall irremediably into energy poverty if market conditions dramatically change. An example is when the energy sector/market structure generates disproportionately high energy costs that cannot be avoided (defined as “trapped in the heat” by Tirado-Herrero and Urge-Wortzats, 2014), resulting in payment arrears or reduced consumption of essential goods and services.3 When such change happens, households (not necessarily poor ones) can meet increasing energy payments while minimizing their consumption and falling into energy poverty despite being able to pay their energy bills. Such decisions are considered confined to the household domain, which would vary over time and in different geographical settings, and culturally sensitive, as energy service expectations are subjective and socially constructed (Simcock et al., 2016; Bouzarovski, 2018). That is why measuring energy poverty is quite complex.
The difficulty in identifying energy poverty and its different sources has led it to be considered a multidimensional form of poverty. A rich literature has been developed providing different types of measures, including indexes [Multidimensional Energy Poverty Index (MEPI)], references for classification (EU, LILEE), and observatories (Thomson and Bouzarovski, 2018).
The role of housing conditions is one of the dimensions considered a catalyst for explaining energy poverty when interacting with low income and energy prices (Boardman, 1991; Tirado-Herrero et al., 2014). The literature agrees that high energy bills can also arise from excessive consumption or inefficient energy use in the case of low energy efficiency in buildings.4 The association between housing energy efficiency and energy poverty has been increasingly analyzed in recent literature. Son and Yoon (2020) indicated that household size and the type of housing (quality) are essential factors that influence electricity consumption and, thus, the energy bill burden. When housing quality is high, reducing energy bills does not necessarily imply a cold environment, and higher efficiency would guarantee lower energy costs and an adequate temperature. Any investment in energy building retrofitting will reduce energy poverty problems (Tady and Lee, 2019) through two channels: reducing energy consumption through a more balanced energy-consumption scheme at home (Wilkinson and Sayce, 2020) and improving households’ health and welfare levels by consuming the amount of energy needed but with more efficiency, thus reducing energy bills. In these cases, lower energy bills are not a sign of energy poverty, and then the building energy efficiency should be a piece of essential information to classify households within this type of poverty (Eisfeld and Seebauer, 2022).
As the role of energy efficiency in buildings has been recognized as a reason for excessive energy consumption and the potential for cold environments in deprived housing, only a little research has focused on identifying how building quality would explain this type of poverty (see Streimikiene, 2019). Incentive policies for investment in energy rehabilitation are the most widely accepted as they improve energy efficiency and reduce energy poverty in both the EU (EU, 2020) and other countries (Warren-Myers et al., 2020), especially applied in social housing (Tardy and Lee, 2019).
Most current research has three goals: identifying energy poverty, quantifying it, and finding hidden energy poverty. Researchers have mainly focused on the assessment of energy expenditures to reveal situations of energy poverty (Betto et al., 2020), estimate expected consumption by type of household and dwelling (Karpinska and Śmiech, 2020; Porto Valente et al., 2022), or try to find direct empirical evidence of the self-limitation of energy consumption (Eisfeld and Seebauer, 2022), thus working on bridging the gap in the identification of energy poverty and its specific factors. A large part of the research has built multidimensional indexes to measure this type of poverty, but fewer studies have analyzed geographical differences or estimated the incidence of energy poverty. Defining fuel poverty more precisely is necessary to correctly design measures to alleviate it (Villalobos et al., 2021).
This research contributes to the energy poverty debate concerning hidden energy poverty by adding evidence of its existence and drivers and quantifying its incidence. The empirical evidence provided here fills the existing gap in the literature concerning the distinction between energy poverty due to lack of income and housing features and their differences by region and housing tenure. The analysis is made in two steps. The first step estimates measures based on common factors capturing the hidden association between energy poverty and housing features related to the construction quality and location. In the second step, the extent of energy poverty across the population is quantified, as well as the effect of the tenure status. Accordingly, the research questions addressed in this study are as follows: 1) whether hidden energy poverty is a consequence of housing quality signals other than the economic conditions of the households and 2) whether different housing-tenancy arrangements are a source of differentiation among households that affect the likelihood of falling into energy poverty and its differences among regions. The questions raised in this article and the empirical results thus contribute to the existing literature.
In line with part of the recent literature, this study uses the EU Statistics on Income and Living Conditions (EU-SILC) information for the Spanish case, from which it combines the available indicators in common measures spanning a period from 2008 to 2019. This combination of results in quantifying underlying factors enables energy-poverty identification based on several variables other than poverty, facilitating the exploration of their relationship with the degree of low building quality and household tenure.5 The main contribution of this study is twofold. First, it discriminates between the different sources of energy poverty and identifies the type of hidden energy poverty, correspondingly revealing precise policy measures. The finding of an association between energy poverty and larger houses located in the suburbs constitutes new evidence in the existing literature, signaling the share of stock to be energy renovated to reduce energy poverty. The methodology employed in this research (to the best of our knowledge) has not been used before to analyze energy poverty. Then, it is also a second contribution; it is replicable and transferable to any other country/region worldwide.
This study is organized as follows: Section 2 summarizes recent literature; Section 3 explains the data and the methodology used to extract the energy-poverty measures; Section 4 presents and discusses the results; and Section 5 provides conclusions.
Theoretical Basis
The energy poverty literature has significantly increased since 2019, covering most of the research topics mentioned above. Regarding the aims of the present study, contributions related to measuring (hidden) energy poverty, geographical differences, and the incidence analysis are considered.
Most energy poverty definitions are based on the form of measurement to clarify the scope of energy poverty. Boardman (1991, p. 21) proposed that “a household is in energy poverty when it has to spend more than 10% of its income on all domestic energy use, including appliances, to heat the household to a level sufficient for health and comfort” (Healy and Clinch, 2004; EPEE, 2009; Liddle et al., 2010; Moore, 2012; Schuessler, 2014; Walker and Day, 2012). This is known as the “10% Boardman rule,” under which energy poverty occurs when a household is “unable to obtain an adequate amount of energy services for 10% of disposable income” (Boardman, 1991). The rule recognizes that not all households have to make the same effort to pay for their energy needs, with a more severe effect on lower-income households (Boardman, 2012, p. 50).
Since this first definition, the idea that energy poverty is a multidimensional problem has gained traction among researchers, supporting the idea that energy poverty has several definitions and components. According to Tirado-Herrero et al. (2014), the multidimensional reasons underpinning energy poverty are a combination of three factors defined at the household level, reflecting the supply and demand perspectives: family income, energy prices, and the energy efficiency of the house and its equipment. Regarding the supply side, energy prices seem to have a significant effect on energy poverty; they are defined according to existing regulations, the mix of generation from different energy sources, and the role of sustainable and clean energy production, among other market structures and international tensions. In contrast, from a demand-side perspective, energy poverty comes from excess energy consumption and poverty. If a household inhabits an inefficient dwelling, the energy needed to cover its demand is larger than average, requiring a higher income. These three components have helped understand how the phenomenon of energy poverty emerges and provides starting points for the definition of public policies to address this problem by discriminating its drivers into two groups: 1) the supply features of energy infrastructure, management system, and market-driven changes and 2) the demand conditions that reveal those households vulnerable to energy poverty.
The three-component scheme allows us to understand how energy poverty occurs but requires a careful analysis to reach precise approaches to identifying when a household is “energy-poor.” Institutions have generally adopted the three-dimensional perspective to directly measure energy poverty (Boardman, 2012) by combining indicators from demand and supply in the calculation. For instance, England’s LIHC (low income, high cost) indicator considers a household to be energy-poor if it has to cover above-average (medium) national energy costs or if, in the case of covering the energy bill, the household’s residual income remains below the official poverty line. However, households are only considered energy-poor under the LIHC if it is possible to reduce their energy poverty by increasing their energy efficiency. The LIHC thus redefines the “real problem” of energy poverty by assimilating it into the existence of energy-inefficient households (Department of Energy and Climate Change [U.K.], 2016). The Low-Income Low Energy Efficiency (LILEE) is a new metric for energy poverty in England that considers a household to be energy-poor if it is living in a property with an energy efficiency rating in bands D to G (FPEER metrics) and if its disposable income, after housing costs and energy needs, would be below the poverty line (Department for Business, Energy and Industrial Strategy, 2021, p. 3).
The role of energy efficiency in buildings in explaining energy poverty has also been adopted by the EU, which defined it as the “results from a combination of low income, high expenditure of disposable income on energy and poor energy efficiency, especially as regards the performance of buildings.”6 Such measures emphasize the relevance of energy efficiency in the home and the possibility of finding multiple cases in which energy poverty is associated with various dimensions. The European Fuel Poverty and Energy Efficiency (EPEE) project adopted the conventional definition (EPEE, 2009), also nuancing that “a household is considered under energy poverty if it has higher than typical energy costs and would have disposable income below the poverty line after covering energy costs.” This concept captures the fact that energy poverty is distinct from general poverty: not all poor households are poor in energy terms, and some households are generally not considered poor but could be pushed into energy poverty if they have high energy costs. Therefore, energy poverty is a problem that overlaps with low-income households facing high energy costs (EPEE, 2009).
Recent literature has focused on three main branches of energy poverty: building multidimensional indexes to capture the different influences causing energy poverty, analyzing the demand features increasing the risk of energy poverty, and identifying hidden energy poverty.
The Multidimensional Energy Poverty Index (MEPI) has been built using different methodologies and variables. The first definitions were used to evaluate economic development and account for eight dimensions, grouped into three categories (Israel-Akinbo et al., 2018; Olang et al., 2018; Ahmed and Gasparatos, 2020). Seuret-Jimenez et al. (2020) proposed a composite indicator based on transport, electricity, and cooking energy to evaluate the lack of energy affordability in some Mexican regions. Khana et al. (2019) included four indicators in their multidimensional energy poverty index: percentage of the population with access to the electricity grid, access to modern cooking systems, total energy supply per capita, and total energy consumption per capita. Other streams of research have combined previous indicators to obtain the MEPI. For instance, Aguilar et al. (2019) combined the simple indicators (10% indicator, LIHC, AFCP) to classify households suffering from energy poverty, one of the few examples of research estimating the energy poverty incidence in the population, along with Faiella and Lavecchia (2021), who added to the official measure in Italy through an estimation of the heating expenditure needed for a minimum comfort level, finding an incidence of 11.7% of energy poverty.
Energy poverty and energy inefficiency are the two indicators used by Pysar et al. (2018). The Index for Evaluation of Vulnerability to Energy Poverty (Castaño-Rosa et al., 2020) uses four indicators: monetary poverty, energy consumption, comfort, and health-related quality of life. Charlier and Legendre (2019), Gouveia et al. (2019), and Mattioli et al. (2019) are additional examples of multidimensional indexes of energy poverty.
Sokolwski (2019) represented an example of index combination. They sought to identify households suffering energy poverty by combining two objective indicators [“low income-high costs” (LIHC) and “high share of energy expenditure in income” (high costs)] with three subjective self-reported indicators [“inability to keep home adequately warm” (not warm enough), the “presence of leaks, damp or rot” (poor quality in housing), and the “inability to pay utility bills” (bill difficulties)]. A household will suffer from energy poverty (in their view) if at least two indicators are positive.
There is considerable debate regarding whether a multidimensional index can capture energy poverty situations adequately. Mashhoodi et al. (2019) and Thomson et al. (2017) stressed the complexity of the social character of energy poverty, whereas Bouzarovski (2018) argued that its multidimensional nature makes it challenging to capture through a single indicator. There is also much debate around its definition and methodological calculation (März, 2018; Papada and Kaliampakos, 2018; Primc et al., 2021) and its ability to address energy poverty problems (Faiella and Lavecchia, 2021).
The demand features have been less analyzed in the literature. The main goal is to identify the risk factors that are associated with energy poverty situations in the long term, such as household composition, the age and health status of its members, and social conditions (unemployed or retired people, or both) (Bollino and Botti, 2017; Bouzarovski and Tirado-Herrero, 2017; Primc et al., 2019; Oliveras et al., 2021).
Spatial and regional singularities and differences in energy poverty are another topic in the literature for which specific small-scale evidence has been provided. Bouzarovski (2018, p. 5) pointed out that the place (territory) where a person lives is at least as relevant as the socioeconomic group to which they belong; thus, variables concerning geographical factors can have a significant impact on fuel poverty levels. Liu and Judd (2019) tested the differences in the case of Australia. Petrova et al. (2013) provided an example in Ukraine. Scarpellini et al. (2019) proposed a measure of the spatial socioeconomic impact of energy poverty using media coverage and economic-financial indicators at the territorial level in Italy, whereas Besagni and Borgarello (2019) related socioeconomic and geographical approaches using four different methods to approach energy poverty incidence in Italian regions. Robinson et al. (2019) covered the case of England using global principal component analysis and local geographically weighted PCA to a suite of neighborhood-scale vulnerability indicators to identify the most important factors for energy poverty in different locations. Mashhoodi et al. (2019) analyzed the case in the Netherlands using semiparametric geographically weighted regression analysis, finding that two out of six determinants of energy poverty are spatially homogeneous, suggesting that energy poverty differs depending on the regional area. Sanchez-Guevara et al. (2019) assessed and compared the case of Madrid and London at the microlevel using GIS. Quishpe et al. (2019) estimated MEPI for Ecuador based on Living Conditions Survey data, confirming that energy poverty incidence is concentrated below the 40th percentile for household income, with significant differences between urban and rural areas. Further, Kyprianou et al. (2019) compared energy measures in five EU countries, whereas Primc et al. (2019) presented evidence of 28 EU countries from the macro-level perspective.
Such variability and the unobservable self-restriction in energy consumption are considered to drive hidden energy poverty (Eisfeld and Seebauer, 2022). The hidden energy poverty concept was created to address the limitations of the expenditure method (based on income as a primary reference) to measure energy poverty (Oliveira et al., 2021). Recent literature is applying different methodologies to highlight its existence, mostly based on conventional energy poverty measures; for example, Betto et al. (2020) used different income levels as a metric to approach energy poverty in the Italian population. Excessive energy consumption related to the median is conceptualized as a sign of hidden energy poverty. Karpinska and Smiech (2020) estimated the expected energy costs in a micro dataset of 11 European countries and concluded that 23.5% of the population is exposed to hidden energy poverty.
Housing Features
The different dimensions suggest that energy poverty affects households because of their income level and other hidden circumstances. The literature associates property ownership with higher income and tenancy with lower income. However, there is no clear evidence of this situation in countries with higher property-ownership rates where most of the population owns their homes across almost all income statuses. The tenure structure is usually created over long periods, and many homeowners may have seen their situation deteriorate and fall into poverty after buying their homes. In those cases, becoming a homeowner in the past would be crucial for households to protect themselves from extreme poverty (homelessness) when they become less wealthy, but in the new situation, covering energy bills can lead to households falling under the poverty line. This would be the case for households with income coming from low pensions. Although it seems obvious, only a few papers have identified tenancy as one of the origins of energy poverty. Tenancy has been introduced to analyze the health consequences of energy poverty (Carrere et al., 2021) or as an extra attribute (Tirado-Herrero, 2017; Aristondo and Onaindia, 2018a).
Some empirical evidence (Taltavull de La Paz et al., 2016) has suggested that sources other than poverty can explain energy poverty, related to the type and composition of the household, the way of life and the type of housing, and the existence of barriers (legal, among others). For example, Taltavull de La Paz et al. (2016, p. 17) empirically demonstrated different exposures to energy poverty depending on the type of tenure and the economic cycle or location (Quishpe et al., 2019). Other studies have examined the association between vulnerability and energy poverty; for example, Moore (2012) assessed energy poverty based on vulnerability, whereas Recalde et al. (2019) and Castaño-Rosa et al. (2020) calculated an energy poverty vulnerability index.
Thomson and Snell (2013) assessed energy poverty in European countries by creating a measure based on the EU-SILC survey. Using logistical regression, they found a more significant impact of energy poverty in southern and eastern European countries, mainly due to differences in housing conditions; they also linked it to the primary energy-efficiency policies in the EU. Since this research, the use of EU-SILC as a dataset to analyze energy poverty has become popular among many studies analyzing different countries’ situations.
Tirado-Herrero’s dimensions7 enable understanding the conditions for reducing energy poverty. In this context, the present paper hypothesizes that a household could become energy-poor due to the following: 1) a persistent socioeconomic situation (poverty); 2) changes in income (fall), unbalancing the household budget, and forcing the household to prioritize housing-cost payments; 3) energy price policy rules (determining the bill based on other energy costs beyond consumption); and 4) lack of insulation or low building quality. Those reasons can be non-exclusive in generating energy poverty, and their combination is challenging to identify (Wilkinson and Sayce, 2020). As energy expenses are essential, households could be considered a “captive audience” of the energy market, with no reaction capacity to increased energy prices or in poverty due to economic conditions, thus worsening the energy-poverty problem among the population (Halkos and Gkampoura, 2021).
Some studies in the energy literature have identified several relationships between energy poverty and housing, and most have emphasized analyzing social-housing issues (Jenkins et al., 2011). Boardman (2012, pp. 138–140) stated that most energy-poor households correspond to tenants paying rent at market prices, as opposed to those with a lower rent through social intervention. This author claimed that most energy poverty is found in the private sector rather than in the low-income rented sector, with private rented households showing a more significant likelihood of becoming energy-poor due to a lack of insulation in their houses. A large proportion of homeowners also follow a similar pattern, with a high percentage of older outright homeowners who, despite being rich in assets (house), are income- and energy-poor, together with some younger households with pending mortgage payments. The socioeconomic literature has paid little attention to the links between the type of housing tenancy and energy poverty, with tenancy appearing as a feature only in research analyzing the health effects of energy poverty (Braubach and Fairburn, 2010). Maxim et al. (2017) asserted that tenure status affects households through two channels: a lack of interest in investing in energy efficiency (in the case of tenants) and insufficient financial means due to mortgage payments (in the case of homeowners).
Other groups of households likely to be energy-poor are older-aged and younger households, and there is also discrimination by gender. Elderly owners can be described as “rich in property but poor in income” because they depend on low current pensions. This group is willing to reduce energy consumption to save income, thus falling into energy poverty (DellaValle, 2019). Low energy bills resulting from this behavior have been shown to indicate the existence of “hidden energy poverty” (Betto et al., 2020). Gender discrimination also is found in energy poverty. Studies have evidenced that the main effect of gender is on health (Carrere et al., 2021) and the labor market, with Nguyen and Su (2021) demonstrating that a reduction in energy poverty is associated with an increase in the number of female workers.
In the specific Spanish case, considerable recent evidence of energy poverty has been reported. Most research has focused on the health consequences of energy poverty (Carrere et al., 2021) and inequality (Aristondo and Onaindia, 2018a; 2018b); other studies have proposed a measure using a vulnerability index (Castaño-Rosa et al., 2020) and in comparison with other European countries (Recalde et al., 2019).
In summary, the general consensus is that energy poverty is difficult to identify with the current techniques (and the available data) because hidden fuel poverty has added to the set of causes identified in the empirical evidence. The literature above demonstrates that energy poverty is a multidimensional problem that is challenging to identify using just one indicator. Therefore, the present study focuses on capturing the signals of its existence to identify its sources and potential hidden energy poverty. As the first hypothesis, we consider that defaulting on energy payments is not the only requisite for the energy-poor as poor people may still be paying high energy bills to avoid low energy consumption at home. As the reaction to significant energy costs is heterogeneous, we hypothesize that households with high energy costs are not necessarily poor because groups at different income levels can fall into energy poverty due to other features, such as the type of housing or household. This study considers that reasons other than poverty associated with housing issues could explain energy poverty. As energy poverty is not directly observable, using household perceptions as a signal is crucial to understanding its existence. This is the main reason for using EU-SILC data. We propose in our paper that energy poverty cannot be approached from the simple income-measure perspective and that households can suffer (hidden) energy poverty due to variables other than income. In other words, they may not necessarily be poor or have an income level close to the poverty line. Energy poverty can arise when the house is considered too cold (winter) or too hot (summer), and such household perceptions are not observed in other surveys.
Following previous evidence, this study uses EU-SILC data for Spain at a regional level to test two other hypotheses. The first concerns whether and how housing-deprivation signals are linked to energy poverty, whereas the second tests the role of housing tenancy in energy poverty. Testing these two hypotheses is achieved by identifying to what extent each dimension is associated with energy poverty.
To the best of our knowledge, these aspects have not been covered in the literature; accordingly, the present study aims to fill this gap by identifying the role of different dimensions in explaining energy poverty and revealing why hidden energy poverty exists.
Model, Materials, and Methodology
The analysis of energy poverty seeks to identify whether or not a household is determined to be energy-poor due to one or more of the three dimensions defined in the literature (EPEE, 2009; Tirado-Herrero et al., 2014): lack of income, housing features, and energy costs. As energy costs as such are missing in the EU-SILC dataset, we hypothesize that they are reflected in the responses referring to utility bills8 and captured by the question about whether the utility-cost coverage is a burden on the household budget and whether or not there have been delays in payments. This variable can be considered a measure of the payment difficulties for energy at home, indirectly associated with an increase in energy costs. As defaulting on energy payments would lead to less energy consumption in the home (or as households may reduce energy consumption due to high energy bills), we adopt the general interpretation that such responses are a sign that highlights the existence of energy poverty.
Note that the EU-SILC is a self-reporting survey, meaning that some preference bias cannot be avoided in the analysis, which cannot be controlled. The literature suggests that the “true self” is fundamentally good (Newman et al., 2014) and suitable for the analysis, so we acknowledge that a positive bias exists in our findings due to the latter, which could reduce the perceived effect of energy poverty. We control the analysis for several indicators, including the type of household, gender, the perception of housing grants, and the region, to reduce the effect of such bias.
Some variables are built from the EU-SILC data to perform the analysis. The poverty-line variable is calculated first by estimating a yearly income distribution (each year from 2005 to 2019), as 60% of the median yearly income (i.e., the poverty line without considering imputed rents); based on this, the poverty variable is calculated by classifying households as poor or non-poor.
Following the literature, this study considers that a sign of energy poverty is when the household gives a negative answer to whether or not they can afford to keep the dwelling at an adequate temperature during the winter months.9
The EU-SILC survey provides variables capturing household responses that reveal latent energy-poverty signs. Two are relevant in the present study. The first is the lack of housing quality associated with poor structure or construction materials, reflected in leaks, noise from the exterior, or any other manifestation of poor insulation that leads to more significant energy consumption than an efficient home. The second is the situation of larger homes (single-family houses or rural houses) that are isolated and associated with more energy consumption due to the lack of protection from other buildings, as well as gardens or outdoor spaces that require lighting or energy consumption for other reasons. Technical (construction) specifications support that such homes are heavy energy consumers in both cases, leading such households to be potentially energy-poor. Note that the first case (poor quality) is defined in Tirado-Herrero’s (2017) reasons for energy poverty. The existing literature does not formally identify the relationships among these household conditions, and the theoretical principles supporting the existence of energy poverty based on these are theoretical. This study provides empirical evidence to support such theories.
This study quantifies the mechanism(s) underlying the three hypotheses regarding energy poverty by identifying the unobserved (latent) factors that underpin its complexity using the observed data contained in the EU-SILC survey for Spain and its regions.
The Analysis Testing These Hypotheses Involves Three Steps
1. Estimating the underlying mechanism(s) associating energy-poverty indicators with those dimensions referencing income, poverty, and housing features, thus identifying the variables operating together to reveal the existence of energy poverty. The calculation results enable computing a value for individual households to measure the level of energy poverty for each.
2. Calculating the impact of each type of energy poverty and their interactions and make-up in the Spanish regions.
3. Estimating the role of tenancy on estimated measures of energy poverty.
The first step involves energy-poverty identification through performing a confirmatory factor analysis (CFA) to capture the unobservable association between the selected variables that lead to energy poverty. The analysis thus reveals the unobserved structure of the data underlaying the extracted latent factors that explain the complexity of energy poverty and, once the factors have been estimated, examines and confirms their validity. In order to perform the CFA, the first step is developed through exploratory factor analysis (EFA). The second step is confirmatory by estimating the SME model.
EFA and CFA Analysis
EFA analysis (Matsunaga, 2010) begins by extracting factors based on a list of variables chosen from the EU-SILC data following their interpretation according to the three main concepts causing energy poverty as discussed above (housing features, poverty, and energy costs). The variables chosen are shown in Table 1 (first column). For robustness, the analysis is estimated twice: first, using the whole dataset (from 2008 to 2019)10 and the 20 common variables recorded systematically in the EU-SILC survey and, second, for Spanish regions individually.11
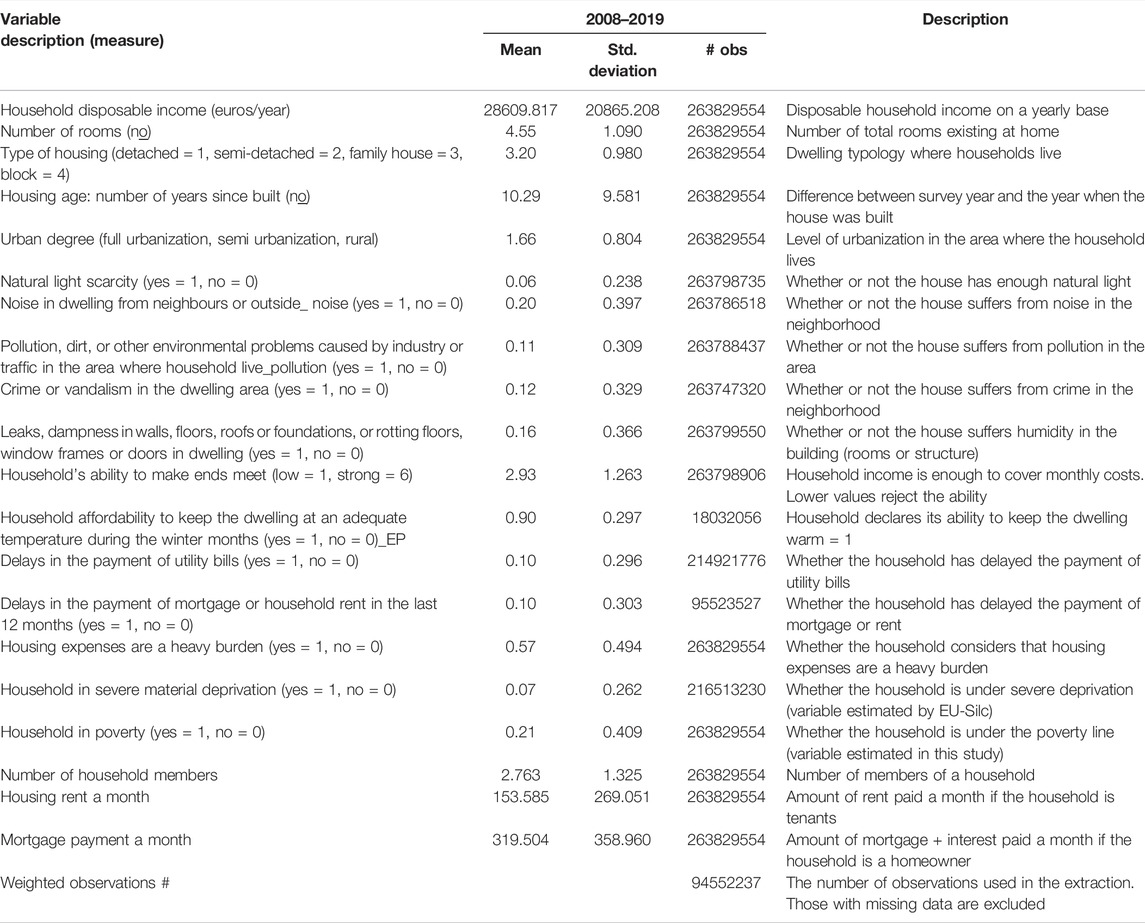
TABLE 1. Basic EU-SILC statistics.
The steps followed to fulfill the methodology requirements (Matsunaga, 2010) are as follows. First, the variables chosen cover the relevant aspects of energy poverty suggested by the literature and avoid missing key information to maximize the validity of the energy-poverty scale. Second, the sample size is large enough in the dataset to guarantee the stability of the extracted component patterns. Third, we perform EFA analysis at national and regional levels to estimate the unknown structure of the data by determining the number of underlying factors explaining it, the extraction method applied is principal component analysis (PCA), and the matrix is rotated using Varimax. As conditions for extraction validity, the factors should fulfill Kaiser’s criterion (having an eigenvalue more significant than 1 and keeping a minimum of 5% of the variance). Regarding retaining factors, we apply the rules of thumb (Hair et al., 1998, p. 112) that there should be at least three items with significant loadings (in the rotated solution) and that each loading should be greater than 0.3 in absolute terms.12 The rotated factor patterns are expected to be a latent structure explaining sources of energy poverty.
Technically, factor analysis examines the interrelationships among different variables (taken simultaneously) and explains them by extracting their common underlying dimensions (Kline, 2005, 2016). Its main attractiveness in multidimensional research is identifying latent and non-observable dimensions existing in the data and its ability to parametrize them in individual variables called common factors. Each variable xi is influenced by a bundle of latent common factors shared with other variables (Eq. 1):
where
xi = ith standardized variable;
αij = standardized multiple regression coefficient of variable i on common factor j; Fj = common factor j; ηi = standardized regression coefficient of variable i on unique factor i; Ui = the unique factor for variable i;
m = number of common factors.
The factor is a linear combination of loadings that maximize the predicted variance of all variables and can be extracted from the group of related variables. The extraction of factors in Eq. 2 is made by rotating the underlying matrix in Eq. 1 as follows:
where
Fi = estimated ith factor;
k = number of variables.
Loadings squared (in orthogonal factors, after rotation) are the amount of variance in one variable explained by that factor. The number of factors obtained is the minimum number that captures the most variance.
CFA tests the ability of the estimated EFA model by examining whether the extracted underlying structure fits the data adequately enough according to the accepted standards (Kline, 2005). The extracted factors are confirmed using structural equation modeling (SEM) to determine the adequacy of model fit to the data. Essentially, the formal CFA tests whether latent variables appropriately fit a set of related variables. Having X = (x1…xn) and η=(η1…ηq), the expression would be (Marsh et al., 2020)
The observed independent variables X determine the latent mechanism, and these are considered hidden variables in an equation reflecting a causal association with the dependent variable Y = (y1…ym). Here, ζ and ε are errors among variables. Note that B is the matrix of factor loadings, which should be consistent with those estimated in the EFA model, and Ξ is the matrix of independent variables coefficients adjusted to the existence of the effect of the factors.
Following the hypothesis set above, a household is energy-poor if it cannot maintain the dwelling at an adequate temperature with the available resources. This opinion is self-reported in one of the survey’s questions (Table 1 in bold). Energy poverty would result from the decision to prioritize housing costs over utility bills, which severely affects households under the poverty line, forcing them to reduce energy consumption due to lower residual income. However, energy bills also affect other households not under the poverty line, limiting their purchasing capacity.
Energy poverty is examined by parameterizing a set of variables that capture the existence of cold rooms in the house, humidity in the dwelling or building, difficulty in paying bills, average income, and other dwelling characteristics (quality and location). Subsequently, we explore their hidden association with other variables related to housing quality and control by family size, income, and other key variables. A total of 20 variables are used in this step of the analysis.
Results consistently reveal three factors associating energy at the household level, using the whole dataset or the regional samples. For example, the impact on households of the three types of energy poverty is shown here for three of the 17 Spanish regions: Madrid, Cataluña, and Valencian Community. These three areas are selected because there are climatic differences (Madrid is more homogeneous in the type of the climatic area, whereas the latter two are Mediterranean regions with different climatic areas from the coast to the interior) and they represent the three regions with the highest population concentration in the country (Instituto Nacional de Estadística, 2021).
Results and Discussion
The results for the whole of Spain yield six factors that combine the 20 selected variables typically used in the literature (by regression methods), obtaining new independent (factor) variables. The rotation process was acceptable (Bartlett’s test of sphericity, Kaiser–Meyer–Olkin [KMO] test = 0.688); the factors extracted accounted for 54.26% of the total variance after rotation, and they were analyzed and identified.
Three out of the six factors extracted referred to energy poverty (Table 2), and all three were consistent with the reasons explained above.
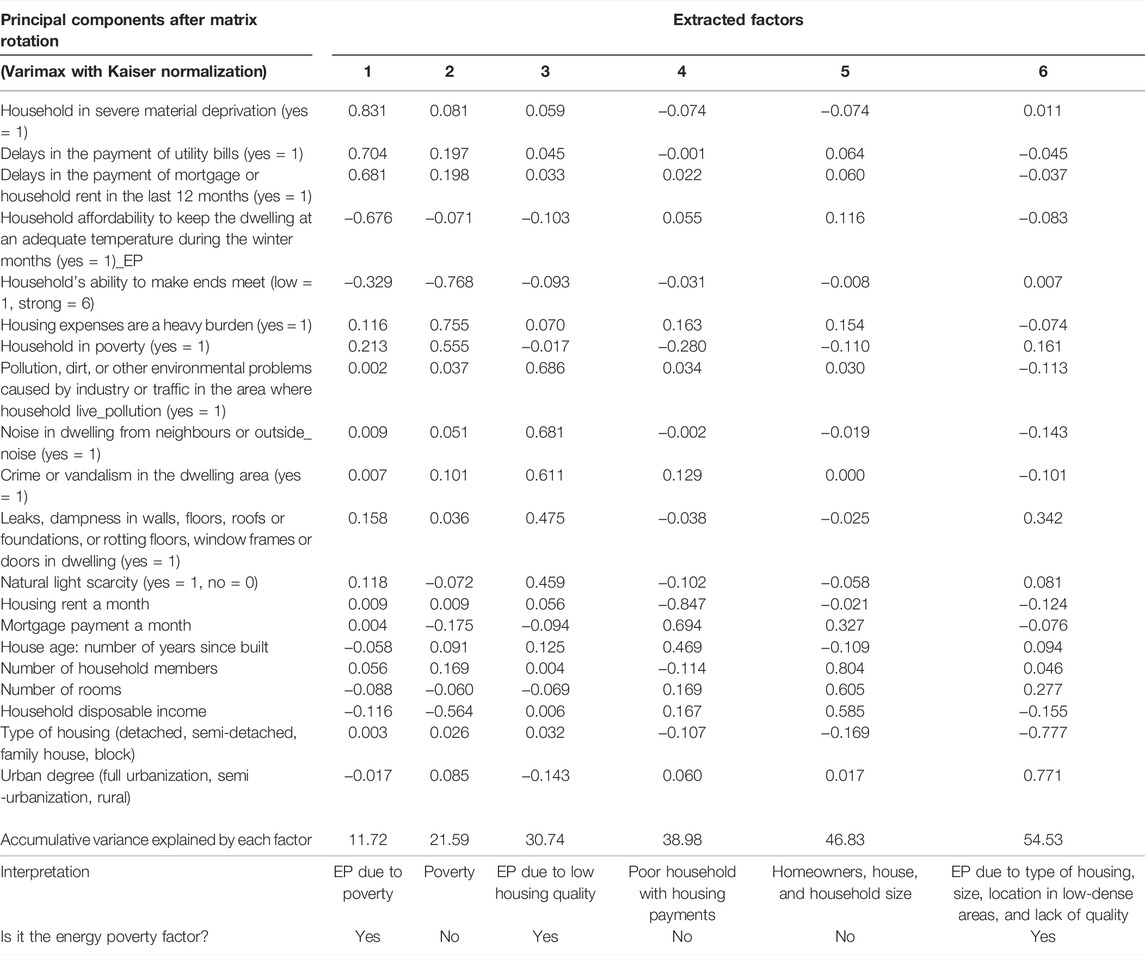
TABLE 2. Energy poverty factors Spain.
The results of the EFA are confirmed by a CFA with statistically significant parameter estimation. The estimations support the relevance of the three factors, as shown in Figure 1.
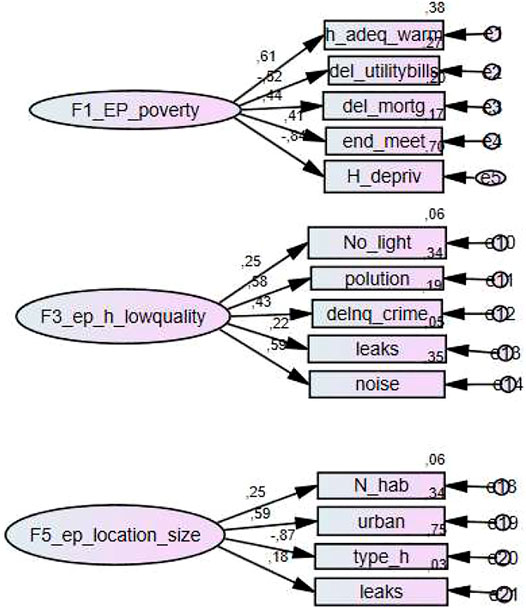
FIGURE 1. CFA estimation of three EP factor models.
The interpretation of this outcome is as follows. The first energy factor extracted refers to the role of poverty in explaining the low temperature in the dwelling (component 1), which is by definition a description of why energy poverty occurs. This component is called “EP [energy poverty] due to poverty” because it associates the failure of the household to keep the housing warm with delays in utility bills and housing cost payments. The factor classifies these issues with those households in material deprivation and poverty (the latter shows a loading lower than 0.3 but close to it, so we can use it for interpretation).
The second factor of interest is component 3, which refers to the housing-quality characteristics within which leaks and lack of light generate more electricity needs to make the house livable. The large loadings for the particular negative housing features suggest that this factor is capturing low housing quality and how it increases the need for energy, so we name this factor “EP due to poor quality.”
The third factor associated with energy poverty is component 6, which refers to the type of house, having more rooms (larger size), having leaks and humidity problems, being dependent on the location, and being located in low urbanized areas (outskirts or in rural areas).13 The definition of the variables here is crucial: the type of house has a negative effect, suggesting that dwellings in a block reduce the effect of this factor (as well as the energy poverty it represents) so that the factor is associated with single-family or detached dwellings. Thus, a negative loading means that single-family houses have a larger effect in this factor. The urban degree has a value of 1 for full urbanization and 3 for fully rural, so a positive loading suggests that location on the outskirts positively affects this factor. These features significantly affect home’s electricity requirements due to location and size, and this factor has been called “EP due to size and location.”
The latter two energy poverty factors are not related to poverty or deprivation. The remaining extracted factors (components 2, 4, and 5) do not affect energy consumption, reflecting instead poverty (component 2), a poor household with housing-payment issues (component 4), and homeowner type (component 5).
The resulting factors are independent variables, distributed as a normal zero average. Figure 2 shows the three distributions.14

FIGURE 2. Distribution of energy poverty factors scores.
Each factor score is generated at the household level and used as a classification element, similar to an index with zero means. Regarding the composition, for factors 1 and 3, values greater than zero indicate worsened situations (of poverty and excessive expenses due to poor housing quality relative to income), which creates energy poverty, whereas values below zero show households in the opposite case. For factor 6, positive values indicate large houses in low-density locations with more substantial energy needs to cover the lack of housing quality and poor insulation. Considering that a household is energy-poor in any of the dimensions when the value of each factor is larger than zero, it is possible to classify them according to the dimensions, as shown in Table 3. This extraction reveals the extent of energy poverty among the Spanish population and enables the quantification of its main sources.
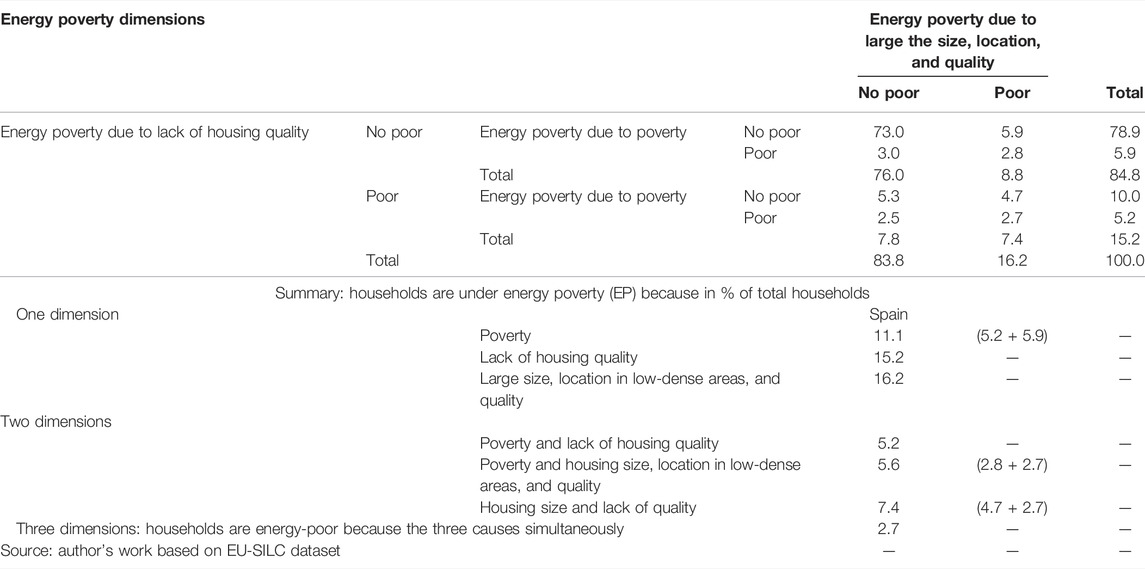
TABLE 3. Household distribution for energy poverty dimensions Spain 2008–2019 (% of total households).
Table 3 shows Spanish households’ distribution under each energy poverty category. Results reveal that 11.1% of all Spanish households are in energy poverty because they are poor, 15.2% because of a lack of housing quality, and 16.2% because of the home they live in, in a low-density single-family-home area and with quality issues. Households under the poverty line and with low housing quality suffering from energy poverty account for 5.2% of the total, whereas 5.6% live in larger homes and away from urban-dense areas. The combination of considerable size and low housing quality leading to energy poverty represents 7.4% of total households. Finally, 27% of households are energy-poor because of the three dimensions simultaneously.
These figures suggest that energy poverty results from a combination of technical and location issues and a lack of economic capacity (such as poverty or reduced income), with the latter not being the most important reason in explaining energy poverty.
Energy Poverty by Spanish Regions
The estimation is replicated for each Spanish region to find the factors revealing the existence of energy poverty among households. The technique estimates each region in the pool and extracts the number of factors in equilibrium. Some regions show seven rather than six factors, but in all cases, the three energy-poverty factors can be clearly identified with the same definition as in the Spanish case. Table 4 summarizes the extraction in each of the 17 regions. In all cases, the KMO test shows an acceptable matrix rotation and interpretation, and Bartlett’s test of sphericity supports the robustness of the factor extraction.
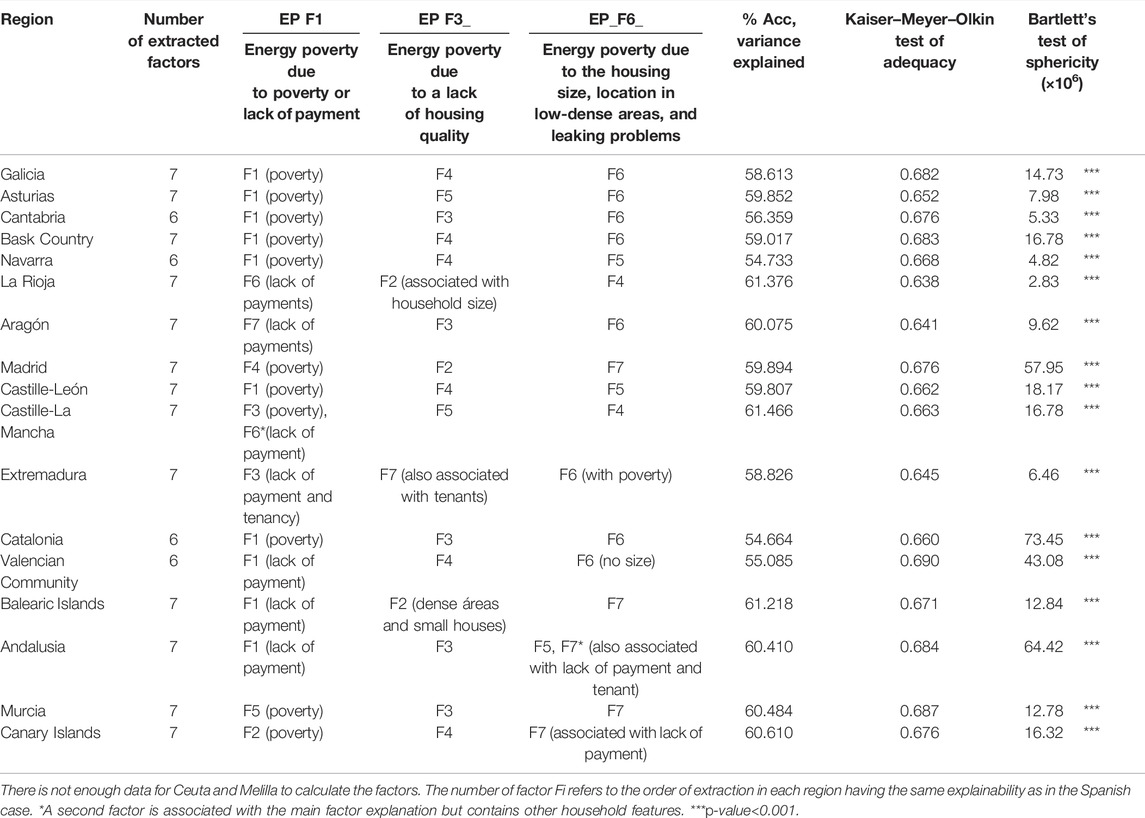
TABLE 4. Energy poverty factor extracted by Spanish regions basic statistics.
The results confirm15 that the regions exhibit three factors: one associating energy poverty with poverty (or defaulting on energy payments), the second with poor housing quality, and the third with location, house size, and lack of quality.
The regions in which poverty is the first factor associated with energy poverty are Galicia, Asturias, Cantabria, Bask Country, Navarra, Madrid, Castille-León, Catalonia, Murcia, and the Canary Islands. Those in which energy poverty is associated with difficulties in paying bills, both utilities and housing, although not in poverty, are La Rioja, Aragón, Extremadura, Valencian Community, Balearic Islands, and Andalusia. Castille-La Mancha presents two factors capturing both aspects individually.
All regions consistently show a significant factor indicating more considerable energy needs due to the poor housing quality (second energy-poverty factor). In three out of 17 regions, this energy-poverty factor is also associated with another extra feature, such as paying rents (Extremadura), the household size (La Rioja), or dense areas and smaller houses (Balearic Islands), which highlights a more precise effect of energy poverty in these locations.
The third energy-poverty factor extracted explains the existence of significant energy needs due to the housing size, location in low-density areas, and structural issues (leaks) in the building; it is also consistently extracted in every region. As before, four regions show extra variables that complement the reasons for the existence of energy poverty. The third energy-poverty factor is associated with poverty in Extremadura, with defaulting on energy payments in the Canary Islands, and is not associated with size in Valencian Community (i.e., this factor is related to location in low-density areas and humidity problems, but not to housing size in the latter region). Andalusia shows two factors in this category (defaulting on energy payments and tenancy), suggesting that rented and low-rent households (but not in poverty) have a more significant likelihood of becoming energy-poor.
Estimating the number of households associated with each type of energy poverty is straightforward. Table 5 contains this information for the three central Spanish regions mentioned above.
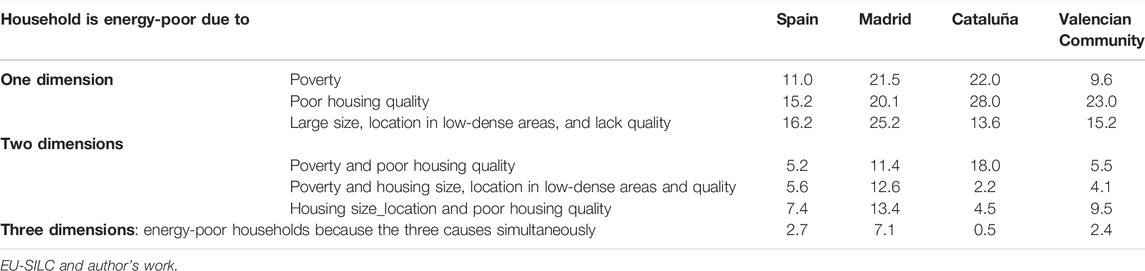
TABLE 5. Households under energy poverty (EP) (in % of total households).
The impact of energy poverty differs by region. Regarding single dimensions of energy poverty, Madrid and Cataluña show larger figures than the national mean: 21.5% and 22%, respectively, of households are energy-poor because they are poor, 20.1% and 28% of households are energy-poor because of poor quality housing, and 25% in Madrid are energy-poor because of the size, location, and structural issues in the home. Valencian Community exhibits a lower weight for energy-poor households because they are poor (9.6% of households). The second reason (poor quality housing) strongly affects all three selected regions, whereas the last one (size, location, and structural issues) is more relevant in Madrid.
These figures are not mutually exclusive; thus, the two dimensions of energy poverty analysis combined enable a better focus on the impact. At the Spanish level, nearly 5.2%–5.6% of households are energy-poor because they are poor and live in poor housing, or they are poor and live on the outskirts in larger houses with a lack of quality. The former is the main reason in the analyzed regions associated with poverty, indicating that households under the poverty line are likely to be located in dense areas and poor-quality buildings. Cataluña presents a more significant proportion of its households in this category, whereas Madrid has more energy-poverty problems with its de-centralized households (12.6% are poor and live in larger houses in low-density areas). Again, energy poverty associated with poor housing and size/outskirts location is larger at all territorial levels except for Cataluña. A total of 7.4%, 13.4%, and 9.5% of households in Spain, Madrid, and Valencian Community, respectively, show signs of energy poverty due to the housing quality and features, although they are not poor. Finally, the proportion of energy-poor households because of all three dimensions is 2.7% in Spain, with a stronger proportion in Madrid (7.1%) and the lowest proportion (0.5%) in Cataluña.
The two-dimension results reject the hypothesis accepted in the literature that households are energy-poor because they are poor and cannot maintain the house at a proper temperature. The relevance of the latter group of results suggests that energy retrofitting in the housing stock would significantly reduce energy-poverty problems in the three selected regions.
However, solving poor households’ energy poverty would be challenging due to their lack of financial capacity for renovation, requiring public policy to define precise instruments for increasing housing energy efficiency in households under the poverty line.
The extracted non-poverty factors are not correlated with payment delays (nor with vulnerability), suggesting that households under these kinds of energy poverty are using more than average resources to cover their energy costs due to the housing quality, features, and location, thus reducing their consumption of other basic needs.
As the empirical evidence suggests, the reasons explaining energy poverty have multiple dimensions that vary spatially. Results confirm the notion that multidimensional features of energy poverty suggest a complex problem that needs to be solved. In this context, the analysis developed in this study enables identifying those society segments requiring intervention and how to design policy tools. The findings confirm the vital role of energy-efficiency retrofitting in improving energy efficiency in houses/buildings to reduce energy poverty.
Energy Poverty and Tenancy: The Role of Homeownership
The final evidence presented in this study is the association between energy poverty and housing tenancy. Some regional factors imply that energy poverty appears at the tenant level. Table 6 presents the percentage of households under the three categories of energy poverty, ordered by tenancy type.
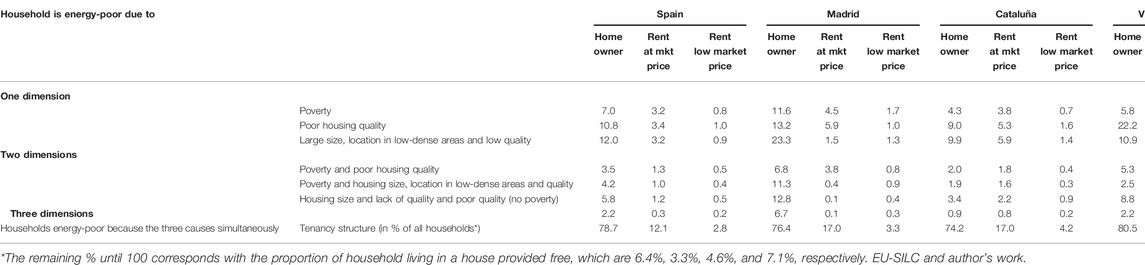
TABLE 6. Households are under energy poverty (EP) by type of tenancy (in % of total households).
Unsurprisingly, the results suggest a concentration of energy poverty in the homeowner group (the largest group by tenancy in Spain), especially in those households where energy poverty comes from a lack of housing quality and size plus location. As shown in Table 6, the proportion of homeowners is three times that of tenants at the national level, with different distribution patterns at a regional level. In Spain, 1.8% of homeowners suffer energy poverty due to poor housing quality, compared to 12% due to large size and outskirts location. Regarding energy poverty among tenants, the aggregate data indicates that nearly 3.2%–3.4% out of the 12% of households are in the rental market and are energy-poor.
The Madrid region’s distribution is consistent with the previous results, with almost one-third of total households being homeowners and energy-poor due to size/location reasons. The role of housing quality appears in the two-dimension energy-poor household distribution, with a large proportion of poor households living in Madrid’s outskirts (11.3%), as well as non-poor and living in low-quality housing or for size/location reasons (12.8%). Thus, those households living in houses on the outskirts of Madrid and who are homeowners represent the largest group suffering from energy poverty. Most tenants paying the market rent in this region appear to be associated with poverty and low quality, supporting the hypothesis of concentration in high-density areas and poor-quality homes.
The distribution in Cataluña is different. Households in this region show a lower extent of the energy-poverty problem, affecting a reduced proportion than the national mean for homeowners. However, tenants seem to mainly suffer from energy-poverty problems due to poverty (4.5%), poor housing quality (5.2%), and size/location variables (5.9%). The two-dimension perspective reveals a low percentage of households, suggesting that energy poverty is significantly associated with building quality and location rather than poverty.
Poor housing quality is the primary source of energy poverty in Valencia Community, affecting 22.2% of households who are also homeowners. Almost all poor households suffer from energy poverty because the house is of poor quality (5.3%), whereas non-poor households suffer from energy poverty because they live in large houses in low-density areas with structural issues (8.8% of total households).
The relevance of these effects requires confirming the association between tenancy and the estimated measures of energy poverty. A pooled regression model is applied to identify whether the type of tenancy contributes to the probability of becoming energy-poor (see Table 7).16

TABLE 7. Energy poverty factors, type of house and tenancy Spanish regions pool.
Results show statistically significant parameters relating each tenancy type to the probability of becoming energy-poor in each of the three categories. In all three equations, the parameter of being a homeowner is positive but shows a lower effect compared to tenants, indicating that the latter contributes to the probability of being energy-poor almost twice as much as homeowners. Thus, the likelihood of tenants being energy-poor is high in Spain, with similar effects for each energy-poverty cause. In contrast, homeowners are much more likely to be energy-poor when their home is poor in quality or on the outskirts rather than when they are under the poverty line.
Conclusion
This article presents an estimation of energy poverty in Spanish regions. Using EU-SILC data for 2005–2019, households in energy poverty have been calculated using CFA methodology by extracting three factors that reveal latent energy-poverty patterns associated with poverty, poor housing quality, and the house location (away from dense urban areas) and the size of the housing. The extracted factors enabled classifying the households, providing a measure of the extent of the energy-poverty problem and its association with housing tenancy in the whole of Spain and specifically in three main regions (Madrid, Cataluña, and Valencian Community). The findings reveal that sources other than poverty have a more significant impact on energy poverty. Most households suffering from (hidden) energy poverty are not poor but live in houses of poor quality, in low-density areas, with houses larger than average, in single-family units, and with some structural problems such as leaks and humidity. These households are devoting extra resources to cover energy bills and possibly reducing other primary consumption. In particular, those living in low-density areas have to cover an increasing amount of energy costs and other expenses (e.g., commuting costs). Poverty is the source of around 30% of the total energy poverty identified by CFA, affecting 11% of total households in Spain, 21.5% in Madrid, 22% in Cataluña, and 9.6% in Valencia Community.
The hypothesis that energy poverty is mainly caused because households are in poverty and living in poor housing is rejected by the results presented herein. The findings show that less than the average (5.2% of total households in Spain) are poor and live in poor housing, whereas most households in energy poverty are not poor but live in low-quality houses or large homes located in low-density areas (2.7% in Spain, 7.1% in Madrid, 0.5% in Cataluña, and 2.4% in Valencia Community). Thus, poor housing quality is also one of the main reasons for energy poverty in Spain, strongly suggesting that energy-renovation policy measures for buildings in Spain would have an important positive effect on reducing energy poverty.
The analysis also calculates energy-poor household distribution among tenancy types. Unsurprisingly, the most affected group is homeowners, with a concentration of energy-poor households on the city outskirts (Madrid and Valencian Community), suggesting that these households have larger electricity bills (due to structural issues) and commuting costs, which likely reduces their resources for basic needs coverage.
As the empirical evidence suggests, energy poverty has multiple dimensions that vary spatially, confirming the notion of a complex problem that needs to be solved. However, the analysis presented in this study enables identifying society segments requiring intervention and provides insights regarding designing policy tools. The findings confirm the vital role of energy retrofitting in improving energy efficiency in houses/buildings to reduce energy poverty.
Data Availability Statement
Publicly available datasets were analyzed in this study. This data can be found here: https://ec.europa.eu/eurostat/web/microdata.
Author Contributions
These authors have contributed equally to this work.
Conflict of Interest
The authors declare that the research was conducted in the absence of any commercial or financial relationships that could be construed as a potential conflict of interest.
Publisher’s Note
All claims expressed in this article are solely those of the authors and do not necessarily represent those of their affiliated organizations or those of the publisher, the editors, and the reviewers. Any product that may be evaluated in this article, or claim that may be made by its manufacturer, is not guaranteed or endorsed by the publisher.
Acknowledgments
The authors declare that the research was conducted in the absence of any commercial or financial relationships that could be construed as a potential conflict of interest. The authors acknowledge the support of The Ombudsman of the Valencia Community (Syndic de Greuges) for this research and the comments from two anonymous referees who have contributed to improving this paper.
Footnotes
1Several problems are associated with energy poverty increasing households’ vulnerability or stressing social effects, including wellbeing issues, worsened health, lower labor productivity, social exclusion, low educational attainment, and increasing social expenses in the health system, among others (WHO, 1987; Healy, 2003; Lidell and Morris, 2010; Papada and Kalimpakos, 2018; Recalde et al., 2019; Castaño-Rosa et al., 2020; Oliveras et al., 2021).
2https://energy-poverty.ec.europa.eu/.
3In such a case, the household would be understood to be in poverty due to the energy poverty situation.
4The energy efficiency of a building is the extent to which the energy consumption per square meter of the floor area of the building measures up to established energy consumption benchmarks for that particular type of building under defined climatic conditions (UNIDO, Sustainable Energy Regulation and Policymaking Training Manual, Module 18).
5Tenure, in the context of housing consumption, refers to the legal arrangements under which individuals have the right to live in a house or apartment. Two are the main: rent or homeownership.
6The EU Winter Package adopted the definition of the three-dimension perspective. https://ec.europa.eu/energy/topics/markets-and-consumers/energy-consumer-rights/energy-poverty_en.
7Also adopted by most research in this field, including the EU Observatory and Okushima (2017) in Japan.
8The EU-SILC survey identifies the components of expenses to be included under utility bills when the survey asks for self-reported arrears, including water, sewage removal, refuse removal, electricity supply, and heating costs. The extended use of arrears in utility bills in examining energy poverty is due to the main components of these bills, namely, electricity supply and heating costs. The consensus is that the utility-bill payment is delayed because of the electricity and heating costs and not water costs. In the absence of precise information regarding energy costs, this variable considers payment problems associated with energy payments.
9That is, when the answer is yes to the questions included in the EU-SILC survey. There is no other way to identify the potential existence of energy poverty with quantitative methods as the perception includes heterogeneous household components.
10Although the full dataset is used (2005–2019), the lack of information in some variables led to reducing the sample to 2008–2019.
11The analysis is also carried out including five specific variables contained in the 2012-EU-SILC extension devoted to energy poverty, with the factor extracted valid only for 2012. For space limitation, the second extraction is not reported here. The factors extracted for 2012 also identify three energy-poverty factors (associated with poverty, housing quality, and size) in nine out of 17 regions and four energy-poverty factors in the other eight regions.
12However, the literature allows flexibility in the latter condition for interpretability criteria. See the debate about the minimum value of loadings as “the role of loading should be conceived as “validity coefficients” explaining whether the factor reflects indeed the phenomenon of interest” (Steinmetz, 2019).
13This factor explains households living in a single-family home, in low-density areas, with associated problems with leaks.
14Factor 3 presents a double maximum in its value distribution, although the test considers it normally distributed with no apparent effect on the results.
15The detailed results are available on request.
16The model estimated is
References
Ahmed, A., and Gasparatos, A. (2020). Multi-dimensional Energy Poverty Patterns Around Industrial Crop Projects in Ghana: Enhancing the Energy Poverty Alleviation Potential of Rural Development Strategies. Energy Policy 137, 111123. doi:10.1016/j.enpol.2019.111123
Aristondo, O., and Onaindia, E. (2018b). Counting Energy Poverty in Spain between 2004 and 2015. Energy Policy 113, 420–429. doi:10.1016/j.enpol.2017.11.027
Aristondo, O., and Onaindia, E. (2018a). Inequality of Energy Poverty between Groups in Spain. Energy 153, 431–442. doi:10.1016/j.energy.2018.04.029
Besagni, G., and Borgarello, M. (2019). The Socio-Demographic and Geographical Dimensions of Fuel Poverty in Italy. Energy Res. Soc. Sci. 49, 192–203. doi:10.1016/j.erss.2018.11.007
Betto, F., Garengo, P., and Lorenzoni, A. (2020). A New Measure of Italian Hidden Energy Poverty. Energy Policy 138, e111237. doi:10.1016/j.enpol.2019.111237
Bollino, C. A., and Botti, F. (2017). Energy Poverty in Europe: A Multidimensional Approach. PSL Q. Rev. 70 (283), 473–507.
Bouzarovski, S. (2018). “Energy Poverty Policies at the EU Level,” in Energy Poverty (Cham: Palgrave Macmillan). doi:10.1007/978-3-319-69299-9_3
Bouzarovski, S., and Tirado Herrero, S. (2017). The Energy Divide: Integrating Energy Transitions, Regional Inequalities and Poverty Trends in the European Union. Eur. Urban Regional Stud. 24 (1), 69–86. doi:10.1177/0969776415596449
Braubach, M., and Fairburn, J. (2010). Social Inequities in Environmental Risks Associated with Housing and Residential Location-Aa Review of Evidence. Eur. J. Public Health 20, 36–42. doi:10.1093/eurpub/ckp221
Carrere, J., Peralta, A., Oliveras, L., López, M. J., Marí-Dell’Olmo, M., Benach, J., et al. (2021). Energy Poverty, its Intensity and Health in Vulnerable Populations in a Southern European City. Gac. Sanit. 35, 438–444. doi:10.1016/j.gaceta.2020.07.007
Castaño-Rosa, R., Solís-Guzmán, J., and Marrero, M. (2020). Energy Poverty Goes South? Understanding the Costs of Energy Poverty with the Index of Vulnerable Homes in Spain. Energy Res. Soc. Sci. 60, e101325. doi:10.1016/j.erss.2019.101325
Charlier, D., and Legendre, B. (2019). A Multidimensional Approach to Measuring Fuel Poverty. Energy J. 40 (2), 27–53. doi:10.5547/01956574.40.2.bleg
DellaValle, N. (2019). People's Decisions Matter: Understanding and Addressing Energy Poverty with Behavioral Economics. Energy Build. 204, 109515. doi:10.1016/j.enbuild.2019.109515
Department for Business (2021). Annual Fuel Poverty Statistics in England, 2021. (2019 data), March 4. Available at: https://assets.publishing.service.gov.uk/government/uploads/system/uploads/attachment_data/file/966509/Annual_Fuel_Poverty_Statistics_LILEE_Report_2021__2019_data_.pdf.Energy & Industrial Strategy [UK]
Department of Energy & Climate Change (UK) (2016). Cutting the Cost of Keeping Warm – A New Fuel Poverty Strategy for England. Consultation Document URN 12D/100. July 2014. Available at: https://www.gov.uk/government/uploads/system/uploads/attachment_data/file/335099/fuel_poverty_consultation.pdf.
Eisfeld, K., and Seebauer, S. (2022). The Energy Austerity Pitfall: Linking Hidden Energy Poverty with Self-Restriction in Household Use in Austria. Energy Res. Soc. Sci. 84, 102427. doi:10.1016/j.erss.2021.102427
European Fuel Poverty and Energy Efficiency [Epee], (2009). European Fuel Poverty and Energy Efficiency Project. Available at:https://www.precarite-energie.org/IMG/pdf/EPEE_Project_presentation.pdf.
European Union (2020). Commission Recommendation (EU). 2020/1563 of October 14, 2020. Available at: https://www.interregeurope.eu/powerty/news/news-article/11957/recommendation-eu-2020-1563-energy-poverty.
Faiella, I., and Lavecchia, L. (2021). Energy Poverty. How Can You Fight it, if You Can't Measure it? Energy Build. 233, 110692. doi:10.1016/j.enbuild.2020.110692
Gouveia, J. P., Palma, P., and Simoes, S. G. (2019). Energy Poverty Vulnerability Index: A Multidimensional Tool to Identify Hotspots for Local Action. Energy Rep. 5, 187–201. doi:10.1016/j.egyr.2018.12.004
Hair, J. F., Anderson, R., Tatham, R., and Black, W. (1998). Multivariate Data Analysis. 5th ed. Upper Saddle River, NJ: Prentice-Hall.
Halkos, G. E., and Gkampoura, E. C. (2021). Evaluating the Effect of Economic Crisis on Energy Poverty in Europe. Renew. Sustain. Energy Rev. 144, e110981. doi:10.1016/j.rser.2021.110981
Healy, J. D., and Clinch, J. P. (2004). Quantifying the Severity of Fuel Poverty, its Relationship with Poor Housing and Reasons for Non-investment in Energy-Saving Measures in Ireland. Energy Policy 32, 207–220. doi:10.1016/s0301-4215(02)00265-3
Healy, J. D. (2003). Excess Winter Mortality in Europe: a Cross Country Analysis Identifying Key Risk Factors. J. Epidemiol. Community Health 57 (10), 784–789. doi:10.1136/jech.57.10.784
Herrero, S. T. (2017). Energy Poverty Indicators: A Critical Review of Methods. Indoor Built Environ. 26, 1018–1031. doi:10.1177/1420326x17718054
Igawa, M., and Managi, S. (2022). Energy Poverty and Income Inequality: An Economic Analysis of 37 Countries. Appl. Energy 306, 118076. doi:10.1016/j.apenergy.2021.118076
Instituto Nacional de Estadística (2021). Spanish Statistical Institute, Demographic Population Results. Available at: www.ine.es.
Israel-Akinbo, O. S., Snowball, J., and Fraser, G. (2018). An Investigation of Multidimensional Energy Poverty Among South African Low-Income Households. South Afr. J. Econ. 86 (4), 468–487.
Jenkins, D., Middlemiss, L., and Pharoah, R. (2011). A Study of Fuel Poverty and Low-Carbon Synergies in Social Housing. UKERC and NESTA Report. Available at: http://eprints.whiterose.ac.uk/79391/1/FuelPovertyReport220711.pdf (Accessed November 5, 2014).
Karpinska, L., and Śmiech, S. (2020b). Invisible Energy Poverty? Analysing Housing Costs in Central and Eastern Europe. Energy Res. Soc. Sci. 70, 101670. doi:10.1016/j.erss.2020.101670
Kline, R. B. (2016). Principles and Practice of Structural Equation Modeling. 4th ed. New York, NY: Guilford Press.
Kline, R. B. (2005). Principles and Practice of Structural Equation Modelling. 2nd ed. New York, NY: Guilford Press.
Liddell, C., and Morris, C. (2010). Fuel Poverty and Human Health: a Review of Recent Evidence. Energy Policy 38 (6), 2987–2997. doi:10.1016/j.enpol.2010.01.037
Liddle, C., Morris, C., McKenzie, P., and Rae, G. (2010). Defining Fuel Poverty in Northern Ireland: A Preliminary Review (Commissioned Report). Belfast: The University of Ulster. Available at: https://pure.ulster.ac.uk/en/publications/defining-fuel-poverty-in-northern-ireland-a-preliminary-review-3.
Liu, E., and Judd, B. (2019). Regional Variations in the Experiences of Energy Poverty across Australia. Energy Build. 196, 293–298. doi:10.1016/j.enbuild.2019.05.023
Marsh, H. W., Guo, J., Dicke, T., Parker, P. D., and Craven, R. G. (2020). Confirmatory Factor Analysis (CFA), Exploratory Structural Equation Modeling (ESEM), and Set-ESEM: Optimal Balance between Goodness of Fit and Parsimony. Multivar. Behav. Res. 55, 102–119. doi:10.1080/00273171.2019.1602503
März, S. (2018). Assessing the Fuel Poverty Vulnerability of Urban Neighbourhoods Using a Spatial Multi-Criteria Decision Analysis for the German City of Oberhausen. Renew. Sustain. Energy Rev. 82, 1701–1711. doi:10.1016/j.rser.2017.07.006
Mashhoodi, B., Stead, D., and van Timmeren, A. (2019). Spatial Homogeneity and Heterogeneity of Energy Poverty: A Neglected Dimension. Ann. GIS 25 (1), 19–31. doi:10.1080/19475683.2018.1557253
Matsunaga, M. (2010). How to Factor-Analyze Your Data Right: Do's, Don'ts, and How-To's. Int. J. Psychol. Res. 3, 97–110. doi:10.21500/20112084.854
Mattioli, G., Philips, I., Anable, J., and Chatterton, T. (2019). Vulnerability to Motor Fuel Price Increases: Socio-Spatial Patterns in England. J. Transp. Geogr. 78, 98–114. doi:10.1016/j.jtrangeo.2019.05.009
Maxim, A., Mihai, C., Apostoaie, C. M., and Maxim, A. (2017). Energy Poverty in Southern and Eastern Europe: Peculiar Regional Issues. Eur. J. Sustain. Dev. 6, 247. doi:10.14207/ejsd.2017.v6n1p247
Mendoza Aguilar, J., Ramos-Real, F. J., and Ramírez-Díaz, A. J. (2019). Improving Indicators for Comparing Energy Poverty in the Canary Islands and Spain. Energies 12 (11), 2135. doi:10.3390/en12112135
Moore, R. (2012). Definitions of Fuel Poverty: Implications for Policy. Energy Policy 49, 19–26. doi:10.1016/j.enpol.2012.01.057
Newman, G. E., Bloom, P., and Knobe, J. (2014). Value Judgments and the True Self. Pers. Soc. Psychol. Bull. 40, 203–216. doi:10.1177/0146167213508791
Nguyen, C. P., and Su, T. D. (2021). Does Energy Poverty Matter for Gender Inequality? Global Evidence. Energy Sustain. Dev. 64, 35–45. doi:10.1016/j.esd.2021.07.003
Okushima, S. (2017). Gauging Energy Poverty: A Multidimensional Approach. Energy 137, 1159–1166. doi:10.1016/j.energy.2017.05.137
Olang, T. A., Esteban, M., and Gasparatos, A. (2018). Lighting and Cooking Fuel Choices of Households in Kisumu City, Kenya: A Multidimensional Energy Poverty Perspective. Energy Sustain. Dev. 42, 1–13. doi:10.1016/j.esd.2017.09.006
Oliveras, L., Peralta, A., Palència, L., Gotsens, M., López, M. J., and Artazcoz, L. (2021). Energy Poverty and Health: Trends in the European Union before and during the Economic Crisis, 2007–2016. Health and Place 67, 102294.
O’Neill, T., Jinks, C., and Squire, A. (2006). Heating Is More Important Than Food: Older Women’s Perceptions of Fuel Poverty. J. Hous. Elder. 20, 95–108.
Papada, L., and Kaliampakos, D. (2018). A Stochastic Model for Energy Poverty Analysis. Energy Policy 116, 153–164. doi:10.1016/j.enpol.2018.02.004
Petrova, S., Gentile, M., Mäkinen, I. H., and Bouzarovski, S. (2013). Perceptions of Thermal Comfort and Housing Quality: Exploring the Microgeographies of Energy Poverty in Stakhanov, Ukraine. Environ. Plan. A 45 (5), 1240–1257. doi:10.1068/a45132
Primc, K., Dominko, M., and Slabe-Erker, R. (2021). 30 Years of Energy and Fuel Poverty Research: A Retrospective Analysis and Future Trends. J. Clean. Prod. 301, 127003. doi:10.1016/j.jclepro.2021.127003
Primc, K., Slabe‐Erker, R., and Majcen, B. (2019). Energy Poverty: A Macrolevel Perspective. Sustain. Dev. 27 (5), 982–989. doi:10.1002/sd.1999
Pysar, N., Dergacheva, V., Dergacheva, V., Bandura, A., and Pásztorová, J. (2018). Composite Fuel Poverty Index as a Means to Assess Energy Security of the Country. EA-XXI 169, 50–56. doi:10.21003/ea.v169-10
Quishpe, P., Taltavull de La Paz, P., and Juárez Tárrega, F. (2019). Energy Poverty in Ecuador. Sustainability 11 (22), 6320.
Recalde, M., Peralta, A., Oliveras, L., Tirado-Herrero, S., Borrella, C., Palència, L., et al. (2019). Structural Energy Poverty Vulnerability and Excess Winter Mortality in the European Union: Exploring the Association between Structural Determinants and Health. Energy Policy 133, e11086. doi:10.1016/j.enpol.2019.07.005
Robinson, C., Lindley, S., and Bouzarovski, S. (2019). The Spatially Varying Components of Vulnerability to Energy Poverty. Ann. Am. Assoc. Geogr. 109 (4), 1188–1207. doi:10.1080/24694452.2018.1562872
Sanchez-Guevara, C., Núñez Peiró, M., Taylor, J., Mavrogianni, A., and Neila González, J. (2019). Assessing Population Vulnerability towards Summer Energy Poverty: Case Studies of Madrid and London. Energy Build. 190, 132–143. doi:10.1016/j.enbuild.2019.02.024
Scarpellini, S., Alexia Sanz Hernández, M., Moneva, J. M., Portillo-Tarragona, P., and Rodríguez, M. E. L. (2019). Measurement of Spatial Socioeconomic Impact of Energy Poverty. Energy policy 124, 320–331. doi:10.1016/j.enpol.2018.10.011
Schuessler, R. (2014). Energy Poverty Indicators: Conceptual Issues-Part I: The Ten-Percent-Rule and Double Median/mean Indicators ZEW – Leibniz Centre for European Economic Research Discussion Papers, 14-037.
Seuret-Jimenez, D., Robles-Bonilla, T., and Cedano, K. G. (2020). Measurement of Energy Access Using Fuzzy Logic. Energies 13 (12), 3266. doi:10.3390/en13123266
Simcock, N., Walker, G., and Day, R. (2016). Fuel Poverty in the UK: Beyond Heating? Ppp 10, 25–41. doi:10.3351/ppp.0010.0001.0003
Sokołowski, M. M. (2019). When Black Meets Green: A Review of the Four Pillars of India’s Energy Policy. Energy Policy 130, 60–68.
Son, H., and Yoon, S. (2020). Reducing Energy Poverty: Characteristics of Household Electricity Use in Vietnam. Energy Sustain. Dev. 59, 62–70. doi:10.1016/j.esd.2020.08.007
Steinmetz, H. (2019). Re: What Is the Acceptable Range for Factor Loading in SEM? Available at: https://www.researchgate.net/post/What-is-the-acceptable-range-for-factor-loading-in-SEM/5dd4dba6f8ea52229d719872/citation/download.
Taltavull de La Paz, P., Juárez, F., and Monllor, P. (2016). Fuel Poverty: Evidence from Housing Perspective. SSRN J. doi:10.2139/ssrn.2839389
Tardy, F., and Lee, B. (2019). Building Related Energy Poverty in Developed Countries - Past, Present, and Future from a Canadian Perspective. Energy Build. 194, 46–61. doi:10.1016/j.enbuild.2019.04.013
Thomson, H., Bouzarovski, S., and Snell, C. (2017). Rethinking the Measurement of Energy Poverty in Europe: A Critical Analysis of Indicators and Data. Indoor Built Environ. 26 (7), 879–901. doi:10.1177/1420326X17699260
Thomson, H., and Bouzarovski, S. (2018). Addressing Energy Poverty in the european union: State of Play and Action. Manchester: EU Energy Poverty Observatory.
Thomson, H., and Snell, C. (2013). Quantifying the Prevalence of Fuel Poverty across the European Union. Energy Policy 52, 563–572. doi:10.1016/j.enpol.2012.10.009
Tirado-Herrero, S., Jiménez-Meneses, L., López-Fernández, J. L., Martín-García, J., and Perero-Van-Hove, E. (2014). Pobreza energética en España. Análisis de tendencias. Madrid: Asociación de Ciencias Ambientales.
Villalobos, C., Chávez, C., and Uribe, A. (2021). Energy Poverty Measures and the Identification of the Energy Poor: A Comparison between the Utilitarian and Capability-Based Approaches in Chile. Energy Policy 152, 112146. doi:10.1016/j.enpol.2021.112146
Walker, G., and Day, R. (2012). Fuel Poverty as Injustice: Integrating Distribution, Recognition and Procedure in the Struggle for Affordable Warmth. Energy Policy 49, 69–75. doi:10.1016/j.enpol.2012.01.044
Warren-Myers, G., Hurlimann, A., and Bush, J. (2020). Advancing Capacity to Adapt to Climate Change: Addressing Information Needs in the Australian Property Industry. Jerer 13 (3), 321–335. doi:10.1108/jerer-03-2020-0017
Wilkinson, S. J., and Sayce, S. (2020). Decarbonising Real Estate. Jerer 13, 387–408. doi:10.1108/jerer-11-2019-0045
Keywords: household conditions survey, housing tenancy, energy efficiency, panel, energy poverty, panel and factor analysis
Citation: Taltavull de La Paz P, Juárez Tárrega F, Su Z and Monllor P (2022) Sources of Energy Poverty: A Factor Analysis Approach for Spain. Front. Energy Res. 10:847845. doi: 10.3389/fenrg.2022.847845
Received: 03 January 2022; Accepted: 12 May 2022;
Published: 29 June 2022.
Edited by:
Fateh Belaid, King Abdullah Petroleum Studies and Research Center (KAPSARC), Saudi ArabiaReviewed by:
Luciano Lavecchia, Bank of Italy, ItalySalvador Cruz Rambaud, University of Almeria, Spain
Copyright © 2022 Taltavull de La Paz, Juárez Tárrega, Su and Monllor. This is an open-access article distributed under the terms of the Creative Commons Attribution License (CC BY). The use, distribution or reproduction in other forums is permitted, provided the original author(s) and the copyright owner(s) are credited and that the original publication in this journal is cited, in accordance with accepted academic practice. No use, distribution or reproduction is permitted which does not comply with these terms.
*Correspondence: Paloma Taltavull de La Paz, cGFsb21hQHVhLmVz
†These authors have contributed equally to this work