- 1Department of Electrical Engineering, Faculty of Engineering, Aswan University, Aswan, Egypt
- 2Department of Electrical Engineering, College of Engineering, Qassim University, Unaizah, Saudi Arabia
- 3Department of Electrical Engineering, Hawassa University, Awasa, Ethiopia
In this paper, the three newly published Multi-Objective Bonobo Optimizer (MOBO) variants are assessed and evaluated using statistical analysis for solving the multi-objective optimization of Distributed Generation (DG) into distribution systems. The main objectives of the study are to minimize system loss and enhance voltage profile. While the first variant, MOBO1, depends on the sort and grid-index approach, the second variant, MOBO2, relies on the Non-dominated Sorting Genetic Algorithm-II (NSGA-II) algorithm technique. The last variant, MOBO3, is inspired by the Multi-objective Evolutionary Algorithm based on Decomposition (MOEA/D). The three MOBO algorithms are compared to themselves and to other algorithms solving the same optimization problem. These algorithms include the MOJAYA, Multi-Objective Artificial Ecosystem-Based Algorithm (MOAEO), Multi-Objective Gravitational Search Algorithm (MOGSA), and Multi-Objective Particle Swarm Optimization (MOPSO). The 33-bus and 85-bus radial distribution systems are used test systems for solving the optimal allocation of single- and three-DG units operating at unity power factor. In order to find the best compromise solution, the Pareto Optimal front method is adopted with the help of a fuzzy-based function. The obtained results show the effectiveness of the MOBO variants compared with other algorithms in terms of different statistical parameters and multi-objective performance metrics such as diversity, hypervolume, spacing, and set coverage. While the MOBO algorithm reduces power loss and TVD by 39.59 and 68.31% for a single DG, they are reduced to 58.13 and 88.44% for three DG units allocated to the 33-bus distribution system, respectively. On the other hand, the MOBO algorithm reduces power loss and TVD by 37.28 and 66.84% for a single DG, respectively, they are decreased to 46.35 and 82.53% for three DG units assigned to the 85-bus distribution system. Among the three MOBO variants, it is found that the MOBO1 is superior for a single-DG allocation, while the MOBO3 is the best for the allocation of three-DG units.
Introduction
Distributed Generations (DGs) are fast gaining popularity due to their efficacy in reducing system capital costs and resolving capacity issues. They also require little space, are quick to build, and cut greenhouse gas emissions. Increased demand, liberalization of the electricity market, and worries about greenhouse emissions have contributed to a recent surge in interest in DGs. Traditional energy sources like thermal and hydropower facilities have many constraints like high building costs and long-distance transmission; they are complex and inefficient. DG sizing and allocation are critical to system efficiency, dependability, and power quality. Inappropriate DG allocation increases system losses and thus total cost. Determining the optimal size and location of the DG is critical. Single or multi-objective functions can solve optimization difficulties. There are two ways to tackle multi-objective issues. First, using weighting factors, turn the multi-objective problem into a single-objective problem with a single dependant solution. Even a tiny change in the parameter’s weight affects the DG’s size and placement forecast. The second strategy is to create non-dominated Pareto-optimal solutions using meta-heuristic algorithms.
The primary purpose of the multi-objective optimization (MOO) method is to discover diverse Pareto-optimal solutions to help the decision-maker (DM) select the most acceptable option among many practical and optimum alternatives. The researchers used to transfer the MOO problem into a single-objective optimization (SOO) problem in the past. The global criterion technique (Bechikh et al., 2018) converts MOO problems into SOO problems by minimizing the distance between various reference sites and viable destination places. The aggregated sum technique turns a MOO problem into an SOO problem using the DM weights and then solves it with a single-objective optimizer (Abdel Aleem et al., 2020). While it is straightforward to use, it has two shortcomings: difficulty selecting proper weights and inability to discover non-convex portions of the Pareto-front. Traditionally, MOO approaches attempted to reduce MOO problems to SOO problems. However, in most real-world MOO issues, appropriate solutions are rarely discovered using these conventional approaches, as the objectives frequently conflict.
Numerous Multi-objective Evolutionary Algorithms (MOEAs) and nature-inspired metaheuristic algorithms have been created during the last three decades to handle real-world MOO issues. In (Zitzler and Thiele, 1999), the authors proposed the Strength Pareto Evolutionary Algorithm (SPEA), an external repository of previously discovered Pareto-optimal solutions. The method assigns fitness values to individuals based on Pareto dominance, and these fitness values are computed only from the external archive’s non-dominated solutions. Then, clustering limits the number of non-dominated solutions saved in an external archive without compromising the Pareto-front properties. The Pareto Archived Evolutionary Strategy (PAES) established a novel adaptive grid approach with a low computing cost (Knowles and Corne, 2000). To increase convergence, a version of the Non-dominated Sorting Genetic Algorithm (NSGA-III) algorithm based on fine final level selection is proposed (Gu et al., 2021). The solutions in the critical layer are sorted first using a dominant relation. Then, an index and favor convergence is used to analyze an individual’s convergence for various conditions. Additionally, the strategy simplified the computing process. By applying decomposition techniques, the Multi-objective Evolutionary Algorithm based on Decomposition (MOEA/D) (Qiao and Ma, 2020) decomposes the voltage/Var MOO problem into a series of subproblems involving scalar optimization. Then, an evolutionary algorithm is utilized to simultaneously optimize these subproblems. MOEA/D requires fewer computational resources than NSGA-II.
DG integrated with distribution systems has been widely investigated based on the objective function and optimization approaches (Eid and Abdel-Akher, 2017; Eid et al., 2021a; Hassan et al., 2021). The MOO methods are adopted in different problems regarding the distribution systems when integrated with DG units. Most of the studies optimize DG units to enhance the performance of the distribution systems by reducing the system losses, total voltage deviation, or increasing the system stability. In order to achieve two or more of those objectives simultaneously, the MOO algorithms optimally choose the best location and size of DG units attached to the distribution systems. Different efforts in the literature have been made for optimal allocations of renewable energy resources into distribution systems. The author in (Eid, 2021) adopted the MO particle swarm optimization (MOPSO) to optimally allocate a single-DG to reduce the power loss, TVD, and enhance the system stability. Both aggregated sum and POF techniques are adopted for MOO. The authors (Eid and El-kishky, 2021) have applied the MO Archimedes optimization algorithm (AOA) for energy loss minimization during the 24 h operation of distribution systems integrated with DG units and its results were better than that for the PSO and Atom Search Optimization (ASO) algorithms. The Marine Predator Algorithm (MPA) was applied on two standard test systems, 69-bus and 118-bus distribution networks (Eid et al., 2021b) for the optimal allocation of both active and reactive energy resources to prove its efficiency and scalability. The Chaotic Improved Honey Bee Mating Optimization (CIHBMO) algorithm (Niknam, 2011) controls the daily volt/var for distribution systems integrated with DG units. The algorithm optimizes the DGs to reduce the generation cost, energy loss, and TVD. The fuzzy-based function is used to find the best compromise solution (BCS) from the Pareto Optimal Front (POF). The POF with a fuzzy-based function is used to find the optimal size and location of multiple DG units into different distribution systems using an Enhanced Artificial Ecosystem-Based Optimization (EAEO) (Eid et al., 2020) algorithm. The objectives included minimizing the system loss, TVD and enhancing the system stability. The DG units are optimized at unity and optimal power factors. The improved Genetic Algorithm (GA) is used (Meena et al., 2018) to allocate distributed energy resources with existing voltage regulation schemes for annual energy loss and voltage deviation minimizations under different scenarios. The aggregated sum technique was adopted for solving the MOO problem. Microgrids’ economic and emission control were optimized by allocating different energy sources optimally (Kharrich et al., 2021a), (Kharrich et al., 2021b) using different optimization algorithms and techniques. The authors (Abdelsalam, 2019) used the Sine-Cosine Algorithm (SCA) to maximize DGs and capacitor banks’ technical and economic benefits with distribution systems for two standard IEEE 33 and 69-bus radial distribution systems and its results was able to maximize the annual savings and hybrid integration of DGs to distribution networks is preferable than integrating one of them alone. These benefits included the voltage profile, system losses, reliability, and annual energy savings. Based on voltage stability index and loss sensitivity factor, the authors of (Yuvaraj and Ravi, 2018) use the Cuckoo Search Algorithm (CSA) to optimally allocate DG units and DSTATOM in radial distribution systems to minimize the power losses and enhance the bus voltages. The authors adopted the aggregated sum technique for solving the MOO problem. The aggregated sum is adopted in (Abdelaziz et al., 2015) to solve a MOO problem of optimal allocation of a single-DG to reduce active/reactive loss, voltage deviation, and reverse capacity objectives using the supervised Big Bang–Big Crunch (BB-BC) method. The algorithm was applied to solve both balanced and unbalanced systems. The assignment of DGs along radial distribution networks is addressed using a backtracking search optimization algorithm (BSOA) (El-Fergany, 2015). The best locations of DG units were determined using the loss sensitivity factor and voltage stability index. The weighted factors or aggregated method transferred the MOO problem into an SOO one to optimally allocate a single-, two- and three-DG units. A genetic MO solver (GMOS) with linear programming (Al-Ammar et al., 2021a) was adopted to solve a MO problem containing many economic, technical, and environmental objectives while integrating renewable energy sources and batteries into the distribution network. The objectives include energy price arbitrage, transmission access fee, energy losses, power quality, and environmental emissions. The artificial bee colony (ABC) algorithm (Al-Ammar et al., 2021a) was introduced to handle the MOO problem of optimally sizing and positioning distributed generation (DGs) in distribution networks while minimizing total energy cost, total power loss, and average voltage drop. A decomposition-based archiving approach (DAA) was presented (Zhang et al., 2018), inspired by the decomposition strategy. The entire objective space was uniformly partitioned into several sub-spaces according to a set of weight vectors. For each generation, a single non-dominated solution located in a subspace is picked to be used for updating the external archive, taking its variety into account. The ideal locations and quantity of required demand reduction to keep the network under statutory limits were determined using a genetic algorithm-based MOO approach (Davarzani et al., 2019). The methodology used probabilistic estimation to determine the granularity of total possible flexible demand from shiftable household appliances in each low voltage feeder.
Recently, some researchers tried to solve the MOO problem using different methods. Sequential quadratic programming (SQP) deterministic technique (Darfoun and El-Hawary, 2015) was used to lower the network power losses and minimize DG installation costs. The objectives were integrated into a scalar objective optimization problem using the weighted sum method. Moreover, the authors also adopted the POF principle for solving the MOO of allocating DG units into distribution systems. The MOO function of the optimal placement and sizing of DSTATCOM using Whale Optimization Algorithm (WOA) (Noori et al., 2021) in the distribution network utilized a weighted coefficient to account for loss minimization, voltage profile enhancement, and reliability enhancement. The artificial bee colony (ABC) algorithm (Al-Ammar et al., 2021b) was used to optimize the sizing and location of DGs in distribution networks in order to minimize total energy costs while also minimizing power loss and average voltage drop. The aggregated sum technique was adopted to solve the MOO problem of optimal allocating of DG and DSTATCOM units (Thangaraj and Kuppan, 2017) with distribution systems in order to minimize the power loss, TVD, and maximize the stability index using the Lightning Search Algorithm (LSA). A combination of Modified Gravitational Search and PSO Algorithm (MGSA-PSO) (Zhang et al., 2022) was proposed for electric vehicle demand dispatch in a microgrid for different charging and discharging scenarios to reduce operating costs cost, pollutant treatment cost, and reduce the load variance of the power grid. The authors used the aggregated sum to transfer the MOO problem into an SOO one. The multi-objective Water Cycle Algorithm (MOWCA) (Mohamed et al., 2019) optimized renewable energy resources to minimize annual costs, power loss, and greenhouse gas emissions. The fuzzy-decision-based function was applied simultaneously to find the best solution for the three objectives. The Manta Ray Foraging Optimization Algorithm (MRFO) (Hemeida et al., 2020) was used to determine the size and position of DG units for reducing active power loss, voltage deviation and for maximizing the voltage stability index. The authors had been used the aggregated sum method to solve the MOO problem.
The freshly invented Multi-Objective Bonobo Optimizer (MOBO) (Das et al., 2020) is marketed as an intelligent and high-performing optimization technology with self-adjusting control settings. MOBO has been reported to perform admirably across a range of test functions and real-world optimization situations. It is capable of achieving an optimal balance of population variety and convergence. The MOBO solved the optimization standard mathematical functions effectively and with a fast response at the same time. These advantages of MOBO encourage the authors to adopt it for the first time in DG optimal allocation into distribution systems to solve the MO problem of reducing the power loss and enhancing the voltage profile of the system. The proposed three variants of the MOBO are implemented, and their performances are statistically compared to solve the problem of optimal DG allocation. These variants include MOBO1 based on the non-dominated sort method and grid-index approach (Coello Coello and Lechuga, 2002), MOBO2 inspired from the NSGA-II (Deb et al., 2002) algorithm, and MOBO3 founded from MOEA/D (Hui Li and Li, 2007). The performances of three newly published MOBO variants had been tested on a set of thirty diversified benchmark test functions in the paper (Das et al., 2020) and the obtained results were compared with that of four other well-known multi-objective optimization techniques including MOPSO, MOEA/D, Multi-Objective GreyWolf Optimizer (MOGWO), and NSGA-II. The three variants of the MOBO algorithms optimize single- and three-DG units operating at a unity power factor to reduce the total system loss and voltage deviation from unity. The following are the primary contributions of this research:
• Developing Multi-objective framework to determine the optimal allocations of single and three-DG units in radial distribution systems with the aim of reducing the total power losses and enhancing the voltage profile.
• The three variants of MOBO (MOBO1, MOBO2, and MOBO3) are implemented to solve the MOO problem for different distribution systems with multiple DG units.
• Statistical analysis is used to compare the three MOBO algorithm versions to one another and to four well-established algorithms.
• In order to evaluate the three variations of MOBO to other algorithms, multi-objective performance metrics, including the diversity, hypervolume, spacing, and set coverage, are adopted.
Problem Formulation
Single-Objective Optimization
The objective functions optimized in this work are the total loss and total voltage deviation of distribution systems. If we assume a branch,
Where
The real power loss is calculated after solving the distribution systems using the forward/backward load flow method (Teng and Chang, 2007). The power losses of each branch are calculated from the current and the branch resistance and reactance, respectively as:
Where
Where three is included for a three-phase system.
The first objective function
The RDS’s radial design aids in voltage reduction when high loads are located distant from the slack bus. The second objective function is to minimize the total voltage deviation (TVD), which is denoted by the following:
Where
The second objective function
Multi-Objective Optimization
In this research, multi-objective optimization (MOO) is adopted, and hence the above two single-objective functions are combined to achieve both of them simultaneously. Unlike single-objective optimization, many solutions are available that construct a curve in MOO, and all these solutions are non-dominated. Different techniques are used in MOO to find the best compromise solution (BCS) among the set of non-dominated points. These techniques include the Pareto Optimal Front (POF) (ArabiNowdeh et al., 2019), aggregated sum (Noori et al., 2021), and ε-constraint (Eid, 2020), (Rawat et al., 2022). In this study, the most efficient POF method is adopted. In order to use the POF method to determine the BCS, the two objectives of power loss and TVD are normalized as:
Where
Where
All not dominated solutions constitute the Pareto-optimal set of solutions. As a result, a fuzzy-based function is utilized to identify the optimal solution from among these (Eid, 2020), (ArabiNowdeh et al., 2019) as:
Where
Then the function is normalized for each solution
Where
This collection is ordered descendingly; the answer to the first value is regarded as the BCS among the non-dominated solutions.
Problem and System Constraints
The proposed solution for the optimal allocation of DG units in MOO fashion does not violate any system or problem constraints. These constraints include the voltage limits, DG sizes, and power balance equations. The voltage constraint keeps the voltage within acceptable limits of:
Where
The total DG size (either single of multiple) is not allowed to be more than the total system demand. Thus, the power flow does not reverse in the system.
Where
The DG units can be located at any system bus except for the slack one. i.e.:
Where
The power constraint is that the total injected power equals the demand plus the losses, as:
Where
At every iteration during the solution, all these constraints are satisfied. Otherwise, the step is avoided.
Outline of the Bonobo Optimizer (BO)
Bonobo Optimizer (BO) is inspired by bonobos’ social behavior and breeding methods (Das and Pratihar, 2019). Bonobos use a social strategy called fission-fusion, which merely forms many groups of varied size and composition inside a community, then once again reunites with their own communities after a short period. BO, like other heuristics, is a population-based algorithm. Each solution in the population is known as a bonobo. The bonobo with the highest rank in the population’s dominance hierarchy is called alpha-bonobo (Das et al., 2020). If the iteration improves alpha-bonobo, the phase is called a positive phase. Conversely, if alpha-bonobo does not improve, it is called a negative phase. The main steps of the BO algorithm are summarized as follows:
Step 1: Initializing the algorithm controlling parameters.
Step 2: Bonobo selection. The maximum size of the subgroup
Where
Step 3: Creating a new bonobo. The new bonobo
Where ND is the number of decision variables of the optimization problem;
Step 4: Adjust boundary constraints.
Step 5: Updating the alpha-bonobo. If the yielded offspring is better than the old alpha-bonobo, then the created new bonobo is regarded as the new alpha-bonobo.
Step 6: Updating the controlling parameters. The parameters are updated in a specific fashion with updating the alpha-bonobo.
Step 7: the above steps are repeated until the stopping criteria are met.The main steps of the BO algorithm is shown in Figure 1.
Multi-Objective Bonobo Optimizer (MOBO) Variants
In contrast to single-objective optimization problems where the algorithm finds the optimal fitness function value throughout the search space, the algorithm catches a set of non-dominated solutions in multi-objective problems. The algorithm, in this case, discriminates between the dominated and non-dominated solution points. In this work, the three variants of the MOBO algorithm listed in (Das et al., 2020) are adopted to solve the DG optimal allocation problem in distribution systems to enhance their performance. The first one is called MOBO1, which is based on the non-dominated sort method and grid-index approach (Coello Coello and Lechuga, 2002). The second version is the MOBO2 where it is based on the NSGA-II (Deb et al., 2002) algorithm. It inherits the NSGA-II algorithm’s concepts of non-dominated sorting, population rank assignment, and crowding distance. The last and third version is the MOBO3 which is based on MOEA/D (Hui Li and Li, 2007). The three variants of the MOBO algorithms optimize single- and three-DG units operating at a unity power factor in order to reduce the total system loss and voltage deviation from unity. The 33-bus and 85-bus RDSs are used as benchmarking systems. The core statistical study compares the three MOBO algorithm variants to each other and to other well-known algorithms, including MOJAYA, MOAEO, MOGSA, and MOPSO. The statistical alanysis includes the calculations of the average, standard deviation, standard error, besides min/max values of the best compromise solution points of each algorithm. In MOO, performance metrics are used for comparisons between different allgorithms. In this study, the performance metrics of diversity, hypervolume, spacing and coverage are applied for all algorithms.
Simulation Results and Discussions
This section shows the performance of MOO behaviors of the MOBO variants applied on two test distribution systems. Moreover, the MOBO performance is compared to other metaheuristic algorithms. The study includes different four case studies as follows:
33-Bus System
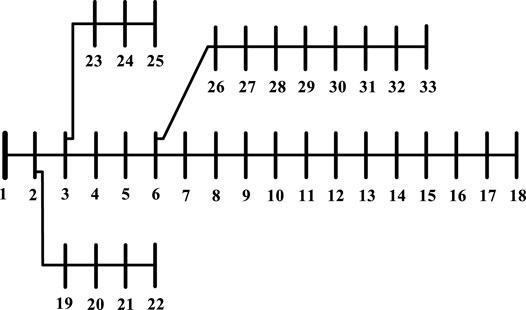
A system layout of the 33-bus RDS is shown in Figure 2. The system is rated for 12.66 kV with a total load of 3,715 kW and 2,700 kVar at full load conditions. The study includes the optimal allocation of a single and three DG units at unity power factor to minimize the system power loss and TVD.
(A) 33-bus distribution system with a single-DG allocation
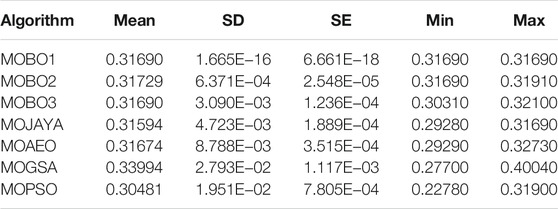
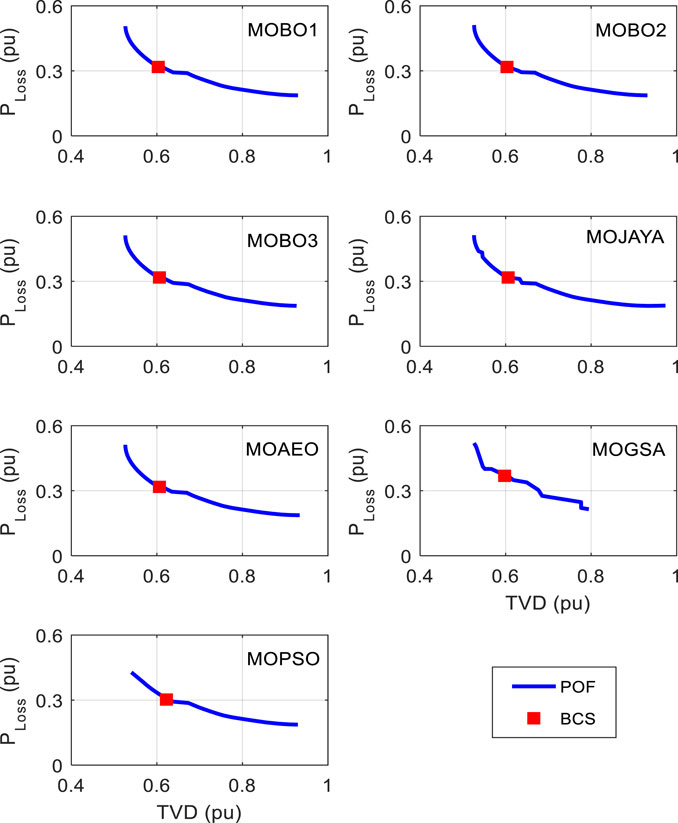
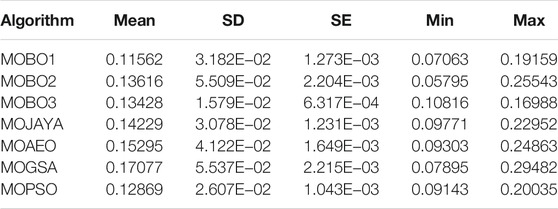
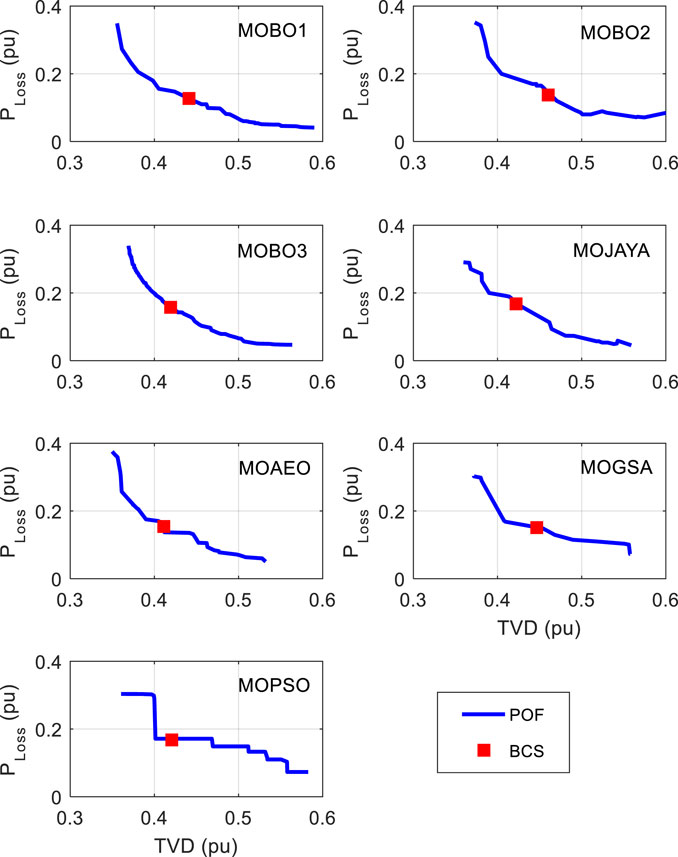
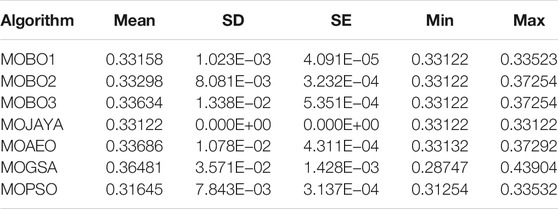
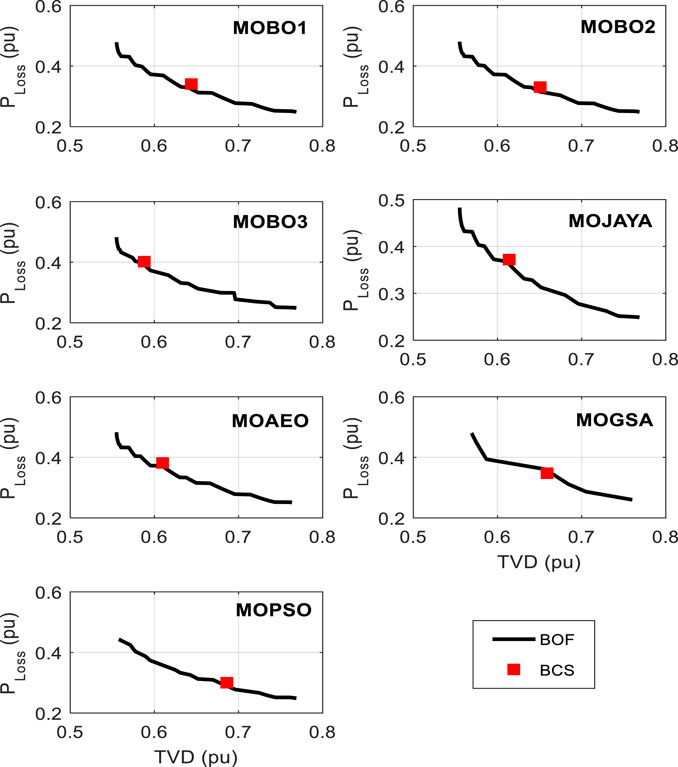
With a single-DG optimal allocation, the system loss is calculated by applying different algorithms 30 times, and the statistical parameters are listed in Table 1. The performance parameters include the mean, SD, SE, minimum, and maximum losses. The MOBO2 achieves the best average power loss value among the MOBO variants, while the MOGSA achieves the lowest value. The corresponding BCS statistics of the TVD are listed in Table 2. The MOBO1 and MOBO3 achieve the same average values among the MOBO variants, and the MOPSO algorithm achieves the lowest value. The BCS and the POF curves for the different MOO algorithms are shown in Figure 3. It's worth noting that allocating a single DG unit to the 33-bus distribution system reduces system losses and TVD by 39.59 and 68.31%, respectively. The system’s base loss and TVD values are 210.98 kW, and 1.8044 pu, respectively.
The MOBO 2 algorithm shows a better performance compared to MOBO companions or other algorithms, as listed in Table 3. The MOBO2 superiority appears in achieving the lowest values for the diversity and spacing metrics and the highest value for the HV metric for the single-DG allocation case study. The Set Coverage of the MOBO variants is listed in Table 4. The MOBO1 covers all other algorithms by different percentages as listed. The MOBO1 covers his companions MOBO2, MOBO3 by 88.78 and 60.02%, respectively. MOBO2 only covers MOBO3 and MOPSO algorithms. Finally, MOBO3 is covered by his companions while it covers only the MOPSO algorithm.
(B) 33-bus distribution system with three-DG allocation

TABLE 3. Diversity, HV, Spacing metrics for different MOO algorithms with a single-DG allocation for 33-bus system.
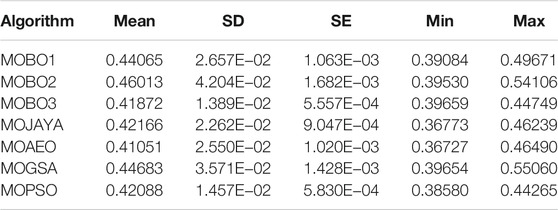
In this case study, three DG units are optimized using the three MOBO variants as well as the other four metaheuristic algorithms to minimize both the power losses and the TVD of the 33-bus RDS. The statistical analysis for the power loss for BCS points is listed in Table 5. Comparing the three MOBO variants shows that the MOBO3 achieves the lowest average value for the power loss. On the other hand, MOBO1 has the minimum loss value. However, the MOAEO has the lowest average value among all algorithms, while MOPSO achieves the lowest minimum value. Regarding the analysis of TVD as listed in Table 6, the minor average is recorded with MOBO1, while MOBO2 reaches the minimum value between the three MOBO variants and other algorithms. It is worth mentioning that the system losses and the TVD are reduced by 58.13 and 88.44% respectively with allocating three DG units to the 33-bus distribution system. The performance of the MOO algorithms, including the diversity, HV, and spacing metrics, is listed in Table 7. A careful inspection shows that MOBO3 is the best algorithm concerning the diversity and spacing metrics. On the other hand, MOBO1 achieves the most significant HV value. The corresponding BCS and the POF curves for the different MOO algorithms are shown in Figure 4.

TABLE 7. Diversity, HV, Spacing metrics for different MOO algorithms with three-DG allocation for 33-bus system.
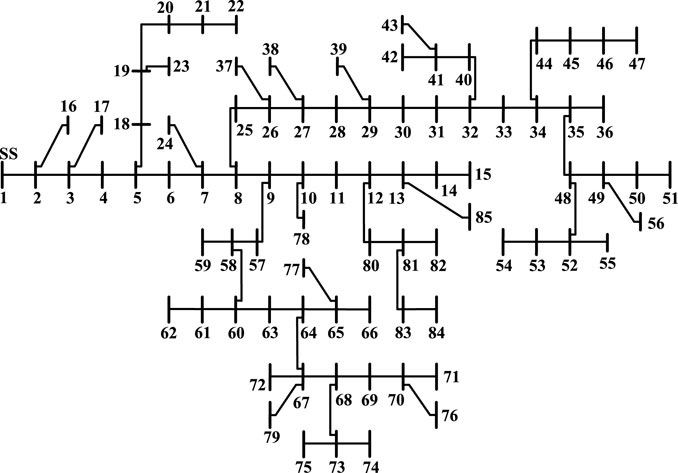
The 85-Bus Distribution System
The second system layout of the 85-bus RDS is shown in Figure 5. The system is rated for 11 kV with a total load of 2,570.28 kW and 2,622.08 kVar at full load conditions. The study includes the optimal allocation of a single and three DG units at unity power factor to minimize the system power loss and TVD. The associated statistical analysis is also provided with the performance metrics for comparison purposes with other optimization algorithms.
(A) 85-bus distribution system with a single-DG allocation
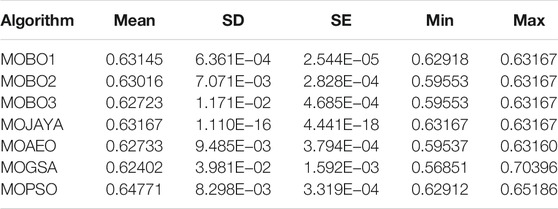
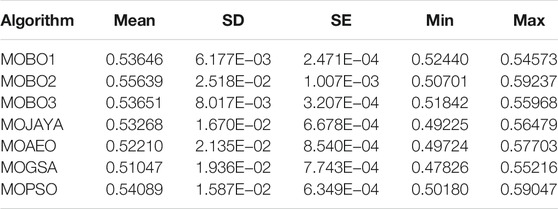
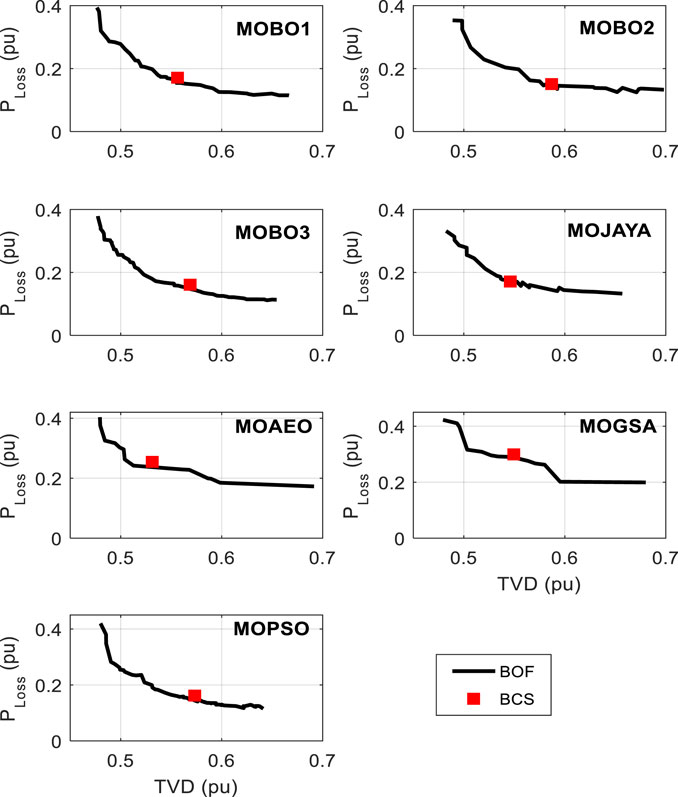
With a single-DG optimal allocation, the system loss is calculated by applying different algorithms 30 times, and the statistical parameters are listed in Table 8. The performance parameters include the mean, SD, SE, minimum, and maximum losses. The MOBO3 achieves the best average power loss value among the MOBO variants. The MOBO1 attains the lowest standard deviation. The MOGSA achieves the lowest loss among the seven algorithms. The corresponding BCS statistics of the TVD are listed in Table 9. The MOBO1 accomplishes the smallest average values among the MOBO variants, while the MOPSO algorithm realizes the lowest. The BCS and the POF curves for the different MOO algorithms are shown in Figure 6. The allocation of the single DG to the 85-bus distribution system, reduces the power loss by 37.28% and the TVD by 66.84%. The system’s base loss and TVD values are 315.955 kW, and 7.7964 pu, respectively.
The MOBO2 algorithm shows a better performance compared to MOBO companions or other algorithms, as listed in Table 10. The MOBO2 superiority appears in achieving the lowest value for the diversity, while the highest value for the HV metric for the single-DG allocation case study is attained by MOBO1. The MOPSO achieves the lowest for the spacing metric. The Set Coverage of the MOBO variants is listed in Table 11. The MOBO1 covers all other algorithms by different percentages as listed. The MOBO1 covers his companions MOBO2 and MOBO3 by 59 and 74%. MOBO2 only covers MOBO3 and other algorithms except for MOBO1. Finally, MOBO3 is covered by his companions as well as other algorithms.
(B) 85-bus distribution system with three-DG allocation

TABLE 10. Diversity, HV, Spacing metrics for different MOO algorithms with a single-DG allocation for 85-bus system.
In this case study, three DG units are optimized using the three MOBO variants as well as the other four metaheuristic algorithms to minimize both the power losses and the TVD of the 85-bus RDS. The statistical analysis for the power loss for BCS points is listed in Table 12. Comparing the three MOBO variants shows that the MOBO1 achieves the lowest average value for the power loss. On the other hand, MOBO2 has the minimum loss value. However, the MOGSA has the lowest average and minimum values among all algorithms. Regarding the analysis of TVD as listed in Table 13, the minor average is recorded with MOBO3, while MOBO2 reaches the minimum value between the three MOBO variants and other algorithms. The allocation of three DG units to the 85-bus distribution system, reduces the power loss by 46.35% and the TVD by 82.53%.
The performance of the MOO algorithms, including the diversity, HV, and spacing metrics, is listed in Table 14. A careful inspection shows that MOBO2 is the best algorithm concerning the diversity and spacing metrics. On the other hand, MOBO3 achieves the most significant HV value. The corresponding BCS and the POF curves for the different MOO algorithms are shown in Figure 7. The metric of the set coverage is not calculated for the 3-DG allocation case study as the different algorithms generate unequal points for their curves.

TABLE 14. Diversity, HV, Spacing metrics for different MOO algorithms with three-DG allocation for 85-bus system.
MOBO Variants Overall Comparisons
The MOBO variants are compared for the two systems as listed in Table 15. The comparison is based on independent best parameters. As can be noticed, the MOBO1 is the best for a single-DG allocation. On the other hand, for the 3-DG allocation, MOBO3 is the best. If we add all points, MOBO1, MOBO2, and MOBO3 achieve 17, 13, and 12, respectively, and they are in order. This table can be read as follows. If an algorithm achieves the best value, it takes a point. Regarding the mean value of the power loss (PLoss), MOBO2 achieves the minimum value with a single DG allocation with the 33-bus system, while MOBO3 is the best for the 85-bus system. Each of them takes a point. The mean value of the TVD is minimum for both systems with the MOBO1 algorithm. At the same time, MOBO3 achieves the same minimum value for the 33-bus system. As a second example, MOBO1 performs best with an 85-bus system, while MOBO2 performs best with a 33-bus system for a single DG allocation. On the other hand, for allocation of three-DG units, the MOBO2 performs best with the 85-bus system, and MOBO3 performs best with the 33-bus system. This rule is applied for all situations, including all parameters.
Conclusion
The optimal allocation of DG units is obtained in this paper by combining numerous MOBO algorithms in order to minimize power loss and total voltage deviation in various distribution networks. The three variants of MOBO algorithms are compared to each other and other algorithms of MOJAYA, MOAEO, MOGSA, and MOPSO. The study included statistical analysis for comparison purposes between the different algorithms. Moreover, the multi-objective performance metrics such as diversity, hypervolume, spacing, and coverage have been included to distinguish between these algorithms. The MOBO algorithm reduces power loss and TVD by 39.59 and 68.31% for a single DG, but by 58.13 and 88.44% for three DG units distributed throughout a 33-bus system. Moreover, the MOBO algorithm reduces power loss and TVD by 37.28 and 66.84% for a single DG, and 46.35 and 82.53% for three DG units allocated to the 85-bus distribution system, respectively. The obtained results found the superiority and effectiveness of the MOBO variants compared with other algorithms in most of the case studies. It is found that the MOBO1 is the most optimal choice for a single-DG allocation scenario, and MOBO3, on the other hand, is the most optimal allocation for the 3-DG allocation.
Data Availability Statement
The original contributions presented in the study are included in the article/Supplementary Material, further inquiries can be directed to the corresponding author.
Author Contributions
All authors contributed to manuscript revision, read, and approved the submitted version.
Conflict of Interest
The authors declare that the research was conducted in the absence of any commercial or financial relationships that could be construed as a potential conflict of interest.
Publisher’s Note
All claims expressed in this article are solely those of the authors and do not necessarily represent those of their affiliated organizations, or those of the publisher, the editors and the reviewers. Any product that may be evaluated in this article, or claim that may be made by its manufacturer, is not guaranteed or endorsed by the publisher.
Acknowledgments
The authors thank the support of the National Research and Development Agency of Chile (ANID), ANID/Fondap/15110019.
References
Abdel Aleem, S., Almoataz, A. Y., Zobaa, A. F., and Bansal, R. C. (2020). Decision Making Applications in Modern Power Systems. 1st ed. London: Academic Press.
Abdelaziz, A. Y., Hegazy, Y. G., El-Khattam, W., and Othman, M. M. (2015). A Multi-Objective Optimization for Sizing and Placement of Voltage-Controlled Distributed Generation Using Supervised Big Bang-Big Crunch Method. Electric Power Components Syst. 43 (1), 105–117. doi:10.1080/15325008.2014.963268
Abdelsalam, A. A. (2019). Maximizing Technical and Economical Benefits of Distribution Systems by Optimal Allocation and Hourly Scheduling of Capacitors and Distributed Energy Resources. Aust. J. Electr. Elect. Eng. 16 (4), 207–219. doi:10.1080/1448837x.2019.1646568
Al-Ammar, E. A., Farzana, K., Waqar, A., Aamir, M., Ul Haq, A., Zahid, M., et al. ABC Algorithm Based Optimal Sizing and Placement of DGs in Distribution Networks Considering Multiple Objectives. Ain Shams Eng. J. 12 (1), 697–708. doi:10.1016/j.asej.2020.05.002
Al-Ammar, E. A., Farzana, K., Waqar, A., Aamir, M., Saifullah, fnm., Ul Haq, A., et al. (2021). ABC Algorithm Based Optimal Sizing and Placement of DGs in Distribution Networks Considering Multiple Objectives. Ain Shams Eng. J. 12 (1), 697–708. doi:10.1016/j.asej.2020.05.002
Arabi Nowdeh, S., Davoudkhani, I. F., Hadidian Moghaddam, M. J., Najmi, E. S., Abdelaziz, A. Y., Ahmadi, A., et al. (2019). Fuzzy Multi-Objective Placement of Renewable Energy Sources in Distribution System with Objective of Loss Reduction and Reliability Improvement Using a Novel Hybrid Method. Appl. Soft Comput. 77, 761–779. doi:10.1016/j.asoc.2019.02.003
Bechikh, S., Datta, R., and Gupta, A. (2018). Recent Advances in Evolutionary many-objective Optimization. 1st Edn., Vol 20. Springer International Publishing.
Coello Coello, A., and Lechuga, M. S. (2002). “MOPSO: a Proposal Formultiple Objective Particle Swarm Optimization,” in Proceedings of the congress on evolutionary computation, Honolulu, HI, May 2002 (IEEE), 1051–1056.
Darfoun, M. A., and El-Hawary, M. E. (2015). Multi-objective Optimization Approach for Optimal Distributed Generation Sizing and Placement. Electric Power Components Syst. 43 (7), 828–836. doi:10.1080/15325008.2014.1002589
Das, A. K., Nikum, A. K., Krishnan, S. V., and Pratihar, D. K. (2020). Multi-objective Bonobo Optimizer (MOBO): an Intelligent Heuristic for Multi-Criteria Optimization. Knowl. Inf. Syst. 62 (11), 4407–4444. doi:10.1007/s10115-020-01503-x
Das, A. K., and Pratihar, D. K. (2019). “A New Bonobo Optimizer (BO) for Real-Parameter Optimization,” in Proceedings of the IEEE Region 10 Symposium (TENSYMP), Kolkata, India, June 2019 (IEEE), 108–113. doi:10.1109/tensymp46218.2019.8971108
Davarzani, S., Granell, R., Taylor, G. A., and Pisica, I. (2019).Implementation of a Novel Multi-Agent System for Demand Response Management in Low-Voltage Distribution Networks, Appl. Energ., 253. 113516. doi:10.1016/j.apenergy.2019.113516
Deb, K., Pratap, A., Agarwal, S., and Meyarivan, T. (2002). A Fast and Elitist Multiobjective Genetic Algorithm: NSGA-II. IEEE Trans. Evol. Computat. 6 (2), 182–197. doi:10.1109/4235.996017
Eid, A. (2020). Allocation of Distributed Generations in Radial Distribution Systems Using Adaptive PSO and Modified GSA Multi-Objective Optimizations. Alexandria Eng. J. 59 (6), 4771–4786. doi:10.1016/j.aej.2020.08.042
Eid, A. (2021). Performance Improvement of Active Distribution Systems Using Adaptive and Exponential PSO Algorithms. Int. Rev. Electr. Eng. 16 (2), 147–157. doi:10.15866/iree.v16i2.19246
Eid, A., and Abdel-Akher, M. (2017). Voltage Control of Unbalanced Three-phase Networks Using Reactive Power Capability of Distributed Single-phase PV Generators. Int. Trans. Electr. Energ. Syst. 27 (11). doi:10.1002/etep.2394
Eid, A., and El-kishky, H. (2021). Multi-objective Archimedes Optimization Algorithm for Optimal Allocation of Renewable Energy Sources in Distribution Networks. Lect. Notes Networks Syst. 211, 65–75. doi:10.1007/978-3-030-73882-2_7
Eid, A., Kamel, S., Korashy, A., and Khurshaid, T. (2020). An Enhanced Artificial Ecosystem-Based Optimization for Optimal Allocation of Multiple Distributed Generations. IEEE Access 8, 178493–178513. doi:10.1109/access.2020.3027654
Eid, A., Abdelaziz, A. Y., and Dardeer, M. (2021). Energy Loss Reduction of Distribution Systems Equipped with Multiple Distributed Generations Considering Uncertainty Using Manta-ray Foraging Optimization. Int. J. Renew. Energ. Dev. 10 (4), 779–787. doi:10.14710/ijred.2021.37482
Eid, A., Kamel, S., and Abualigah, L. (2021). Marine Predators Algorithm for Optimal Allocation of Active and Reactive Power Resources in Distribution Networks. Neural Comput. Appl. 33, 14327–14355. doi:10.1007/s00521-021-06078-4
El-Fergany, A. (2015). Optimal Allocation of Multi-type Distributed Generators Using Backtracking Search Optimization Algorithm. Int. J. Electr. Power Energ. Syst. 64, 1197–1205. doi:10.1016/j.ijepes.2014.09.020
Gu, Q., Wang, R., Xie, H., Li, X., Jiang, S., and Xiong, N. (2021). Modified Non-dominated Sorting Genetic Algorithm III with fine Final Level Selection. Appl. Intell. 51 (7), 4236–4269. doi:10.1007/s10489-020-02053-z
Hassan, M. H., Kamel, S., Abualigah, L., and Eid, A. (2021). Development and Application of Slime Mould Algorithm for Optimal Economic Emission Dispatch. Expert Syst. Appl. 182 (April), 115205. doi:10.1016/j.eswa.2021.115205
Hemeida, M. G., Alkhalaf, S., Mohamed, A. A. A., Ibrahim, A. A., and Senjyu, T. (2020). Distributed Generators Optimization Based on Multi-Objective Functions Using Manta Rays Foraging Optimization Algorithm (MRFO). Energies 13 (15). doi:10.3390/en13153847
Hui Li, Q., and Li, H. (2007). MOEA/D: A Multiobjective Evolutionary Algorithm Based on Decomposition. IEEE Trans. Evol. Computat. 11 (6), 712–731. doi:10.1109/tevc.2007.892759
Kharrich, M., Kamel, S., Alghamdi, A. S., Eid, A., Mosaad, M. I., Akherraz, M., et al. (2021). Optimal Design of an Isolated Hybrid Microgrid for Enhanced Deployment of Renewable Energy Sources in Saudi Arabia. Sustain. 13 (9), 1–26. doi:10.3390/su13094708
Kharrich, M., Kamel, S., Ellaia, R., Akherraz, M., Alghamdi, A. S., Abdel-Akher, M., et al. (2021). Economic and Ecological Design of Hybrid Renewable Energy Systems Based on a Developed IWO/BSA Algorithm. Electron. 10 (6), 1–31. doi:10.3390/electronics10060687
Knowles, J. D., and Corne, D. W. (2000). Approximating the Nondominated Front Using the Pareto Archived Evolution Strategy. Evol. Comput. 8 (2), 149–172. doi:10.1162/106365600568167
Meena, N. K., Swarnkar, A., Gupta, N., and Niazi, K. R. (2018). Optimal Integration of DERs in Coordination with Existing VRs in Distribution Networks. IET Generation, Transm. Distribution 12 (11), 2520–2529. doi:10.1049/iet-gtd.2017.1403
Mohamed, A. A. A., Ali, S., Alkhalaf, S., Senjyu, T., and Hemeida, A. M. (2019). Optimal Allocation of Hybrid Renewable Energy System by Multi-Objectivewater Cycle Algorithm. Sustain. 11 (23), 1–20. doi:10.3390/su11236550
Niknam, T. (2011). A New HBMO Algorithm for Multiobjective Daily Volt/Var Control in Distribution Systems Considering Distributed Generators. Appl. Energ. 88 (3), 778–788. doi:10.1016/j.apenergy.2010.08.027
Noori, A., Zhang, Y., Nouri, N., and Hajivand, M. (2021). Multi-Objective Optimal Placement and Sizing of Distribution Static Compensator in Radial Distribution Networks with Variable Residential, Commercial and Industrial Demands Considering Reliability. IEEE Access 9, 46911–46926. doi:10.1109/access.2021.3065883
Qiao, F., and Ma, J. (2020). Voltage/Var Control for Hybrid Distribution Networks Using Decomposition-Based Multiobjective Evolutionary Algorithm. IEEE Access 8, 12015–12025. doi:10.1109/access.2020.2965965
Rawat, T., Niazi, K. R., Gupta, N., and Sharma, S. (2022). A Linearized Multi-Objective Bi-level Approach for Operation of Smart Distribution Systems Encompassing Demand Response. Energy 238, 121991. doi:10.1016/j.energy.2021.121991
Teng, J.-H., and Chang, C.-Y. (2007). Backward/forward Sweep-Based Harmonic Analysis Method for Distribution Systems. IEEE Trans. Power Deliv. 22 (3), 1665–1672. doi:10.1109/tpwrd.2007.899523
Thangaraj, Y., and Kuppan, R. (2017). Multi-objective Simultaneous Placement of DG and DSTATCOM Using Novel Lightning Search Algorithm. J. Appl. Res. Tech. 15 (5), 477–491. doi:10.1016/j.jart.2017.05.008
Yuvaraj, T., and Ravi, K. (2018). Multi-objective Simultaneous DG and DSTATCOM Allocation in Radial Distribution Networks Using Cuckoo Searching Algorithm. Alexandria Eng. J. 57 (4), 2729–2742. doi:10.1016/j.aej.2018.01.001
Zhang, Y., Gong, D.-w., Sun, J.-y., and Qu, B.-y. (2018). A Decomposition-Based Archiving Approach for Multi-Objective Evolutionary Optimization. Inf. Sci. 430-431 (431), 397–413. doi:10.1016/j.ins.2017.11.052
Zhang, X., Wang, Z., and Lu, Z. (2022). Multi-objective Load Dispatch for Microgrid with Electric Vehicles Using Modified Gravitational Search and Particle Swarm Optimization Algorithm. Appl. Energ. 306, 118018. doi:10.1016/j.apenergy.2021.118018
Keywords: distributed generation, optimal allocation, multi-objective, bonobo optimizers, pareto front
Citation: Eid A, Kamel S, Hassan MH and Khan B (2022) A Comparison Study of Multi-Objective Bonobo Optimizers for Optimal Integration of Distributed Generation in Distribution Systems. Front. Energy Res. 10:847495. doi: 10.3389/fenrg.2022.847495
Received: 02 January 2022; Accepted: 27 January 2022;
Published: 16 February 2022.
Edited by:
Mohammad Alhuyi Nazari, MAPNA Group (Iran), IranReviewed by:
Mohamed Salem, Universiti Sains Malaysia (USM), MalaysiaAli Shahhoseini, Qazvin Islamic Azad University, Iran
Copyright © 2022 Eid, Kamel, Hassan and Khan. This is an open-access article distributed under the terms of the Creative Commons Attribution License (CC BY). The use, distribution or reproduction in other forums is permitted, provided the original author(s) and the copyright owner(s) are credited and that the original publication in this journal is cited, in accordance with accepted academic practice. No use, distribution or reproduction is permitted which does not comply with these terms.
*Correspondence: Baseem Khan, YmFzZWVtLmtoYW4wNEBnbWFpbC5jb20=
 Ahmad Eid
 Salah Kamel
 Mohamed H. Hassan
 Baseem Khan
