 Qinghui Zhu
 Ruiyan Han
 Siyuan Yang
 Bo Zhang1*
 Zhuqiang Yang
95% of researchers rate our articles as excellent or good
Learn more about the work of our research integrity team to safeguard the quality of each article we publish.
Find out more
ORIGINAL RESEARCH article
Front. Energy Res. , 14 March 2022
Sec. Nuclear Energy
Volume 10 - 2022 | https://doi.org/10.3389/fenrg.2022.843237
This article is part of the Research Topic Experimental and Simulation Research on Nuclear Reactor Thermal-Hydraulics View all 15 articles
The supercritical carbon dioxide (SCO2) Brayton cycle has been regarded as the main development direction of future nuclear power generation by more and more scholars, due to its high environmental efficiency and high thermoelectric conversion rate. However, due to fluctuations in the operation of the primary loop of the system with nuclear energy, parameters such as the power of the heat source and the mass flow of the working medium in the system will change, which will affect the dynamic performance and operation of the SCO2 Brayton cycle system. Therefore, it is necessary to study the dynamic response of the system performance under disturbance conditions, analyze the operating characteristics of the SCO2 Brayton cycle system. In this paper, a comprehensive dynamic model of SCO2 recompression Brayton cycle, which analyzes the response curves of critical parameters under the disturbance of heat source heating power and system mass flow rate, is accurately developed based on Simulink software. In order to verify the validity of the proposed model, the simulation results are compared with the experimental results conducted by Sandia Laboratory under the same conditions. The results show that the model has high accuracy, and can reflect the dynamic response of system performance under parameter perturbation. In this paper, the closed-loop simulation is innovatively performed to show the dynamic response to step-change in the heat source power and mass flow rate. And the thermal efficiency is about 31.85%, when the system operates stably at the design point of working condition. If a disturbance is applied to the system, the temperature change will be mainly concentrated near the heat source of the cycle, and the change near the precooler will be relatively small. The change of the heat source power will lead to a large monotonic variation of cycle efficiency. By contrast, an inflection point in cycle efficiency will be resulted in by changing the system mass flow rate. The results of this paper would provide good approaches for the design, control, and improvement of the SCO2 Brayton cycle.
Nowadays, energy shortage and environmental degradation have recently attracted more and more concern. Improving the energy utilization efficiency of thermal power generation systems has become an inevitable choice to achieve sustainable development of energy (Sarkar, 2015). As a promising alternative power block, the SCO2 Brayton cycle has been regarded as the main development direction of future power generation by more and more scholars due to its high environmental efficiency and high thermoelectric conversion rate (Dostal et al., 2002; Dostal et al., 2017; Ma et al., 2017; MonjurulEhsan et al., 2018). During the whole cycle, CO2 remains in a supercritical state. This recyclable heat source has a wide temperature range and high efficiency, and is suitable for solar energy, nuclear energy, distributed energy, Marine power, fuel cell, and other fields, and is considered to be one of the most promising energy conversion systems at present (Viswanathan et al., 2006; Moisseytsev and Sienicki, 2009; Jokar et al., 2017; Milani et al., 2017; Cao et al., 2018).
Among the six recommended reactor types of the fourth-generation nuclear energy system, except for supercritical water reactor, the energy conversion of the other reactor types can use the Brayton cycle, among which sodium-cooled fast reactor and lead cooled fast reactor are recommended to use CO2 as the working medium (Ahn and Lee, 2014; Crespi et al., 2017; Park et al., 2018). CO2 has good stability and nuclear physical properties, and behaves as an inert gas in the temperature range of reactor core coolant. It is easy to reach the supercritical state due to its moderate critical pressure (7.38 MPa) and low critical temperature (30.98°C) (Span and Wagner, 1996). Besides, it is abundant, cheap, and easy to obtain. The compressor operation point is set in the high-density area near the pseudo-critical area, and the reactor operation point is set in the low-density area after the pseudo-critical temperature, so as to greatly reduce the consumption of small compression work, thus improving the circulation efficiency (Neises and Turchi, 2014; Ahn et al., 2015). SCO2 has a high density, no phase change, good heat transfer performance, and low viscosity within the range of nuclear reactor operating parameters. The advantages of SCO2 can reduce the volume of compressor, turbine and other components (Lv et al., 2018), make the equipment structure compact, reduce the occupied space, and reduce the construction cost and time of nuclear power plant.
Many studies have been conducted on the performance of SCO2 power generation Brayton cycles. Sandia National Laboratory (Pasch et al., 2012) and the U.S. Department of Energy Office of Nuclear Energy have jointly developed the 780 kW SCO2 Brayton cycle power system, which is one of the earliest S-CO2 power generation Brayton cycle systems in operation in the world. The main components include two turbo-generator compressors and associated motors and controllers, three printed circuit heat exchangers, six shell, and tube heaters and associated controllers. Under the conditions of turbine inlet temperature of 811 K, compressor exhaust pressure of 13.8 MPa and rotational speed of 75,000 rpm, the expected circulating efficiency is 32%. Argonne National Key Laboratory of the United States (Chang and Grandy, 2008; Moisseytsev and Sienicki, 2009; Anderson et al., 2015) chose the pool layout as the basis of the design to study the layout form of the SCO2 Brayton cycle in the 250 MW sodium-cooled fast reactor. Massachusetts Institute of Technology (MIT) (Sinicki et al., 2007) systematically investigated four different CO2 cycle configurations, including intercooling, reheating, recompression, and precompression cycles. And the recompression cycle was found to yield the highest efficiency while still maintaining simplicity. The Korea Atomic Energy Laboratory (Seong and Kim, 2012; Seong, 2014) designed the Kalimer-600 Sodium Cooled Fast Reactor and established a simplified model to analyze the thermodynamic performance of Kalimer-600 coupled with the SCO2 Brayton cycle. The maximum thermal efficiency of the optimized sodium cooling SCO2 cycle arrangement is 42.8%. Xi’an Thermal Power Research Institute Co., Ltd(Huang et al., 2020; Su et al., 2020) has completed and put into operation the first 5 MW SCO2 cycle power generation test unit in the world. The unit is currently the largest one in the world, which is of great significance for further improving the efficiency and flexibility of energy utilization and accelerating the construction of the power system with new energy as the main body.
Some layouts have been investigated in the literature for the dynamic characteristic study of supercritical/trans-critical CO2 power cycle. Minh (Luu et al., 2017) proposed and analyzed a start-up scheme of the solar-assisted recompression SCO2 Brayton cycle from cold start to full load operation, and established a comprehensive dynamic model of the whole solar energy integration process. Carleton University (Richard Dupuis and Henry, 2018) built a 250 kW SCO2 simple regeneration Brayton cycle power plant and developed a dynamic model of the power plant in a Matlab/Simulink environment. The purpose of the dynamic model is to simulate the operating point under high-pressure conditions as well as the potential equipment failure mode and its control strategy. Rui Wang (Wang et al., 2020) proposed a dynamic model of a CO2 mixture trans-critical power cycle (CMTPC) system and verified it with experimental data. Olumayegun (Olumayegun and Wang, 2019) established a dynamic model in Matlab/Simulink to evaluate the dynamic performance and control of the waste heat recovery SCO2 power cycle in the cement industry.
Based on the analysis of the above literature, most studies on SCO2 Brayton cycle systems focus on evaluating performance through energy analysis, design parameter optimization, system configuration, and economic analysis under constant heat source conditions. The existing research lacks the dynamic characteristics of SCO2 recompression Brayton cycle with nuclear energy as heat source. However, due to fluctuations in the operation of the primary loop of the system, parameters such as the power of the heat source and the mass flow of the working medium in the system will change, which will affect the dynamic performance and operation of the SCO2 Brayton cycle system. Therefore, it is necessary to study the dynamic response of the system performance under disturbance conditions and analyze the operating characteristics of the SCO2 Brayton cycle system.
Meanwhile, the open-loop simulation is used in most of the papers, but the system input of open-loop simulation is fixed. There is a lack of feedback in the system so that the dynamic calculation results are distorted in a long time range. In this paper, the dynamic numerical model of the SCO2 recompression Brayton cycle is established on Matlab/Simulink platform. The thermophysical properties of SCO2 fluid come from the REFPROP physical property library established by the National Institute of Standards and Technology (NIST). The system will be performed closed-loop simulations and applied perturbations at specific locations such as heater and mass flow rate. Then the effects on major SCO2 Brayton cycle parameters and individual system components will be examined. Due to the lack of public experimental data experimental data of the SCO2 Brayton cycle, the simulation calculation research will lay the foundation for the corresponding unit control strategy and the engineering application of the SCO2 cycle system.
SCO2 Brayton cycle power generation system is a closed Brayton cycle. Due to the physical characteristics of SCO2, the exhaust temperature of the turbine is very high in the closed Brayton cycle. In order to improve the cycle efficiency, the hyperthermal turbine exhaust is often used to preheat the new working medium. In the recuperator, the pressure of working medium on the cold side is high, and its inlet temperature is close to the quasi-critical temperature point, so its isobaric specific heat is high and its heat absorption capacity is strong. The working medium pressure in the hot-side is low, and its temperature is far from the pseudo-critical temperature point, and its isobaric specific heat is low. Therefore, in the simple SCO2 Brayton cycle, the temperature of the fluid on the cold-side of the recuperator is significantly lower than the temperature of the fluid on the hot side, which means that the regenerative heat does not preheat the new working medium at the heat source to a high temperature as possible. As a result, the heat absorption at the heat source is still large. Compared with the simple SCO2 Brayton cycle, the SCO2 recompression Brayton cycle system subtly reduces heat loss and improves efficiency. When the turbine inlet temperature is 500 °C, a comparative study is conducted on the different configurations of the SCO2 cycle system, and the conclusion is drawn that the SCO2 recompression Brayton cycle has the highest efficiency applicable to the new generation of nuclear energy (Liu et al., 2019).
Figure 1 shows the recompression SCO2 dynamic circulation system. It is mainly composed of a main compressor, recompressor, low temperature recuperator, high temperature recuperator, heater, turbine, precooler, and so on. The low-temperature and low-pressure fluid are compressed by the main compressor (point1), then enters the low-temperature side of the low-temperature recuperator (point2) to be gradually heated, and merges with the fluid which comes from the recompressor (point3). After that, the fluid flows through the low-temperature side of the high-temperature recuperator (ponit4,point5), is heated by the heat source, and directly enters the turbine (point6) to perform work. The exhaust gas after the work is cooled by the high-temperature recuperator (point7) and low-temperature recuperator (point8), then split (point9). Part of the working medium enters the precooler for cooling, and then enters the main compressor (point1), while the other part enters the recompressor for compression and boost (point10). The two parts converge at the cold-side inlet of the high temperature recuperator to form a closed loop.
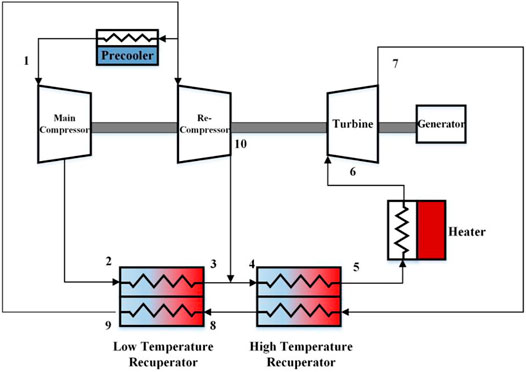
FIGURE 1. SCO2 recompression Brayton cycle system.
The turbomachinery models for the turbine, main compressor, and recompressor were designed by using the thermodynamic equations of turbomachinery. But the rapid change of CO2 near the critical point makes the simulation of compressors challenging. Therefore, turbine performance curves are used in the model to accurately predict turbomachinery performance. This paper refers to compressor and turbine performance curves from Sandia Laboratories (Pasch et al., 2012).
The input parameters of the compressor include inlet pressure, inlet temperature, flow rate and rotational speed. If the isentropic efficiency of the compressor is constant, the entropy value and enthalpy value of the inlet and outlet fluid of the compressor can be calculated as follows:
According to the performance curve of the compressor, the enthalpy rise of the flow through the compressor and the isentropic efficiency of the compressor are calculated as follows:
The actual enthalpy value at the compressor outlet is calculated according to the isentropic efficiency as follows:
Then the pressure and temperature of the compressor outlet fluid are calculated as follows:
Compressor power consumption is:
Similarly, if the isentropic efficiency is constant, the entropy value and enthalpy value of the inlet and outlet fluid of the turbine are calculated as follows:
According to the turbine performance curve, the enthalpy drop and isentropic efficiency of the fluid flowing through the turbine are calculated as follows:
The actual enthalpy value of turbine outlet is calculated according to isentropic efficiency as follows:
Then the pressure and temperature of the fluid at the turbine outlet are calculated as follows:
The work done by the turbine:
Performance of printed circuit heat exchanger (PCHE) is a key research area in SCO2 recompression cycles. PCHE owns the advantages of small volume, strong pressure bearing capacity, and wide application range, which can meet the heat transfer requirements of the SCO2 Brayton cycle. There are three heat exchangers in the recompressed SCO2 Brayton cycle, including a LTR, a HTR, and a precooler. The working medium of HTR and LTR on the hot and cold sides is SCO2, the hot-side working medium of the precooler is SCO2, and the cold-side working medium is water.
Heat exchangers are usually designed in terms of temperature and pressure, but it is more convenient and accurate to calculate enthalpy and pressure, especially in the SCO2 cycle. Because temperature is highly nonlinear, while enthalpy is usually linear. In the system, the enthalpy and pressure in the heat exchanger are assumed to change linearly with the length of the heat exchanger to design the heat exchanger.
In order to simplify the model, the assumptions are made as follows:
(1) Since the diameter of the PCHE microchannel is very small, it is assumed that the temperature and pressure of the fluid change only in the axial direction (flow direction);
(2) In a finite region, all calculations of fluid properties can be performed based on the assumed linear change in enthalpy and pressure;
(3) When the fluid passes through the heat exchanger, the heat exchanger absorbs heat uniformly in the direction of the pipe. The change of specific heat and density of the medium is uniform and linear;
(4) The heat exchanger model was created as a countercurrent configuration with constant conductivity (UA).
In order to accurately capture the effects of changes in CO2 properties, each heat exchanger is divided into a series of sub-heat exchangers. Then, the total heat transfer rate of the entire heat exchanger is distributed equally among the discrete sub-heat exchangers (Dyreby, 2014). In this paper, the precooler modeled uses 10 sub-heat exchangers, HTR uses six sub-heat exchangers, and LTR uses six sub-heat exchangers. It is assumed that the enthalpy in the heat exchanger varies linearly with the length of heating or cooling. Therefore, the cold-side inlet enthalpy and hot-side outlet enthalpy of each sub-heat exchanger are calculated:
where N is the number of sub-heat exchangers.
The inlet and outlet temperatures of each sub-heat exchanger can be calculated using pressure and enthalpy. The heat capacity of the hot-side and cold-side of the sub-heat exchanger can be determined:
The efficiency of the sub-heat exchanger can be calculated by the following equation:
The number of dimensionless heat transfer units (NTU) of the sub-heat exchanger is calculated as follows:
where Cr is the heat capacity ratio between two streams, defined as the ratio between the minimum heat capacity and the maximum heat capacity.
The total thermal conductivity of the heat exchanger is the sum of the thermal conductivity values of the sub-heat exchanger:
About the cold and hot flow, the general mass conservation equation of the control volume is as follow:
The energy conservation equation of heat flow can be expressed as:
The energy conservation equation of cold flow can be expressed as:
The average temperature of CO2 on each side of the heat exchanger can be obtained by:
The heat transfer rate in the heat exchanger is:
where, mh and mc are the mass flows of SCO2 on the hot-side and the cold-side, respectively. Th1, Th2, Tc1 and Tc2 are the hot-side inlet temperature, hot-side outlet temperature, cold-side inlet temperature and cold-side outlet temperature of SCO2, respectively; cp,h and cp,c are the specific heat capacities of SCO2 on the hot-side and the cold-side, respectively; ρh and ρc are the mean densities of SCO2 on the hot-side and the cold-side respectively; Vh and Vc are the volumes of SCO2 on the hot-side and the cold-side respectively; t is time.
The pressure drop for the hot and cold-sides of heat exchanger (Meshram et al., 2016) is as follows:
where f is the friction coefficient, L is the length of PCHE channel, d is the equivalent hydraulic diameter of the PCHE semicircular channel, ρ is the density of SCO2, and v is the flow rate of SCO2. The design parameters of HTR and LTR refer to the data of Sandia Laboratory (Pasch et al., 2012).
In the cycle, SCO2 from the hot-side outlet of the LTR enters the main compressor and the recompressor at a certain split ratio of 3:2. The input parameter of split-flow model is total mass flow rate. And the outputs are mass flow rates of main compressor and recompressor.
The SCO2 from the main compressor flows through the cold-side of the LTR and the SCO2 from the recompressor converges at the inlet of the cold-side of the HTR. The input parameters of mix-flow model are cold-side outlet temperature of LTR, cold-side outlet pressure of low temperature recuperator, cold-side outlet mass flow rate of low temperature recuperator, outlet temperature of recompressor, outlet pressure of recompressor, outlet mass flow rate of recompressor. The outputs are cold-side inlet temperature of HTR, the cold-side inlet pressure of HTR, and cold-side inlet mass flow rate of HTR.
Unlike recuperators, the heater model does not include heat transfer calculations. Its working process complies with the conservation equation of mass and energy. According to the given design conditions, the heat transfer power of the heater can be determined, so the thermophysical properties of outlet SCO2 can be calculated from the thermophysical properties of inlet SCO2. The heat transfer rate is calculated as follow:
where m is the mass flow rate, hout is outlet enthalpy of SCO2, and hin is inlet enthalpy of SCO2.
On the Simulink platform, the input and output of each component are connected according to the layout of the SCO2 circulation system and the working medium process. The open-loop simulation system of the SCO2 Brayton circulation system is built, as shown in Figure 2.
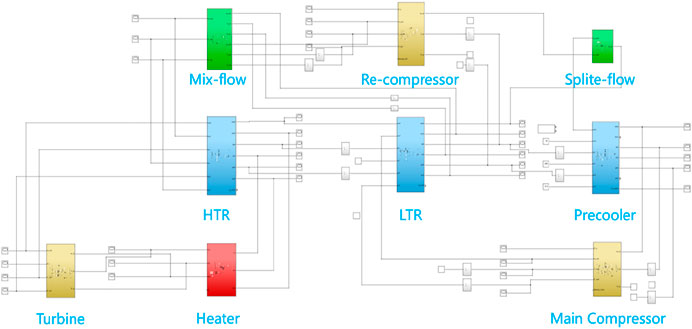
FIGURE 2. Simulation model of SCO2 recompression Brayton cycle system.
The model includes the main compressor, recompressor, turbine, HTR, LTR, precooler, heater, split-flow, and mix-flow module. The thermophysical properties of SCO2 fluid come from the REFPROP physical property library established by the National Institute of Standards and Technology (NIST). The simulation model directly accesses REFPROP.DLL in MATLAB/Simulink through the M file, and dynamically connects to the database, so as to realize the simple and convenient call and calculation of CO2 physical parameters.
In order to verify the accuracy of the algorithm established in the simulation process and the feasibility of the SCO2 cycle simulation system, this section will compare the simulation results with the experimental results conducted by Sandia Laboratory (Pasch et al., 2012) under the same conditions.
The static operation results of the simulation and the experimental results of Sandia Laboratory (Pasch et al., 2012) are shown in Table 1. It represents inlet and outlet temperature, inlet and outlet pressure, and other parameters of the main components of the system. By comparing the static simulation results with the laboratory data, it can be seen that both the temperature and the pressure relative difference of each device in the system is within 1%. In general, it can be seen that the thermodynamic characteristics of the SCO2 recompression Brayton cycle system reflected in the simulation results agree well with the experimental results of Sandia, which can prove that the simulation model built in this paper has high static accuracy. The results of the steady-state operating parameters of the system are shown in Table 2. The isentropic efficiency of the turbine, main compressor, and recompressor is set at 86, 67, and 70%, respectively. Heat and pressure losses in connection lines are negligible, and the calculated cycle efficiency excludes auxiliary power losses, mechanical drive losses, and generator losses. Finally, the cycle thermal efficiency of the system is 31.85%.
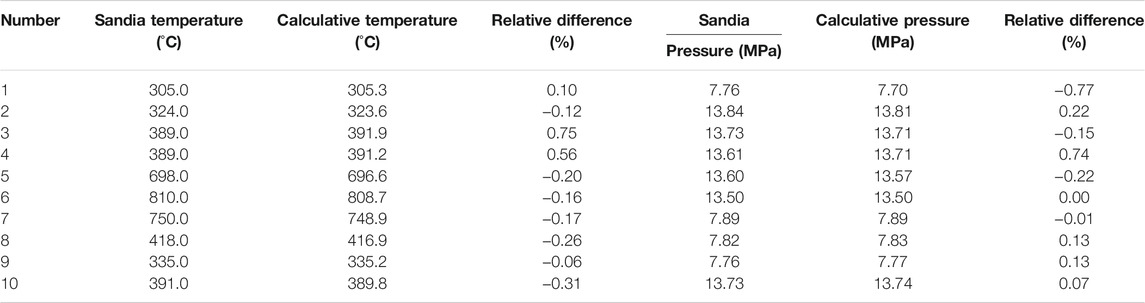
TABLE 1. The steady-state simulation results of the temperature compared with Sandia values.
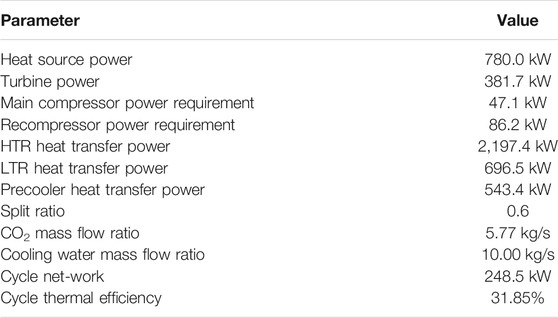
TABLE 2. Detailed condition of the steady state.
When the simulation runs stably under the parameters of the design point, a disturbance is added to the heat of the heater during 60–65 s, at the same time remain the revolving speed of the turbine constant. The heating power decreases from 780 to 663 kW, which is a decrease of 15%. The thermodynamic parameters of the heat source, turbine machinery, recuperator, and precooler are obtained on the simulation platform.
Figure 3 shows the dynamic response of cycle temperature while reducing heat source power. The heat source power decreases sharply, so it can be approximately regarded as a step change. The heater outlet temperature drops sharply from a stable value of 808.7–744.8 K in about 5 s, while the turbine outlet temperature (HTR hot-side input temperature) drops from 748.9 to 694.5 K. The HTR cold-side outlet temperature decreases from 696.7 to 648.5 K, which has the same changing trend as the HTR hot-side inlet temperature because the regenerator is counter-current. After that, the temperature decline slows down because the power of the heat source has not changed, and the heat return from HTR affects the inlet temperature of the heater. The thermal inertia of heat exchangers is large, so the thermal response speed will be reduced. Compared with the above three places, the temperature change rate of the HTR hot-side outlet and cold-side inlet is significantly smaller. Similarly, the temperature change range of LTR cold-side outlet temperature and the hot-side inlet is smaller, and the hot-side outlet temperature of the precooler is almost unchanged. At about 120 s, the system reaches a new steady state. The outlet temperature of the heat source is 719.2 K; the outlet temperature of the turbine is 671.6 K; the inlet temperature of the recompressor drops from 335.2 to 332.5 K; and the inlet temperature of the main compressor drops from 305.3 to 305.2 K.
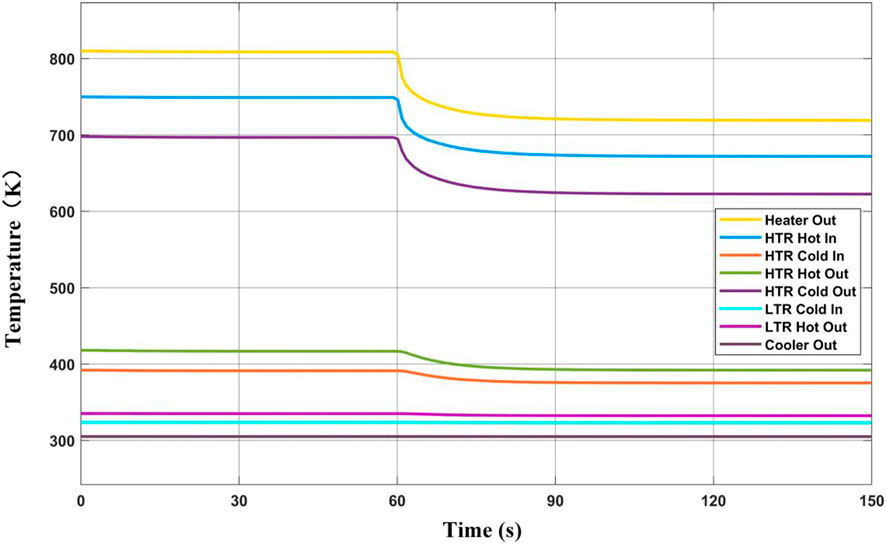
FIGURE 3. Dynamic response of cycle temperature while reducing heat source power.
The heat transfer of the heat exchangers in the cycle system is shown in Figure 4. It can be seen from the figure that the decrease of heat source power leads to the decrease of heat transfer of HTR, LTR, and precooler. Meanwhile, due to the thermal inertia of the heat exchangers, the response of the above three heat exchangers to the heat source power fluctuation gradually slows down. HTR heat transfer power reduces from 2,197.4 kW to 1850.5 kW, decreasing by 15.8%; LTR heat transfer power reduces from 696.5 to 566.2 kW, decreasing by 18.7%; precooler heat transfer power reduces from 543.4 to 531.1 kW, decreasing by 2.3%. The power variation of the turbine machinery of the cycle system is shown in Figure 5, and the dynamic response of the cycle thermal efficiency is shown in Figure 6. The output power of the turbine is greatly reduced because the inlet working condition of the turbine changes so that the turbine works under the off-design condition. The inlet working conditions of the main compressor and the recompressor change slightly, so the power consumption changes slightly. The net power output of the cycle decreased significantly from 248.5 to 145.4 kW. This results in a dramatic drop in the cycle thermal efficiency from 31.9 to 22.0%.
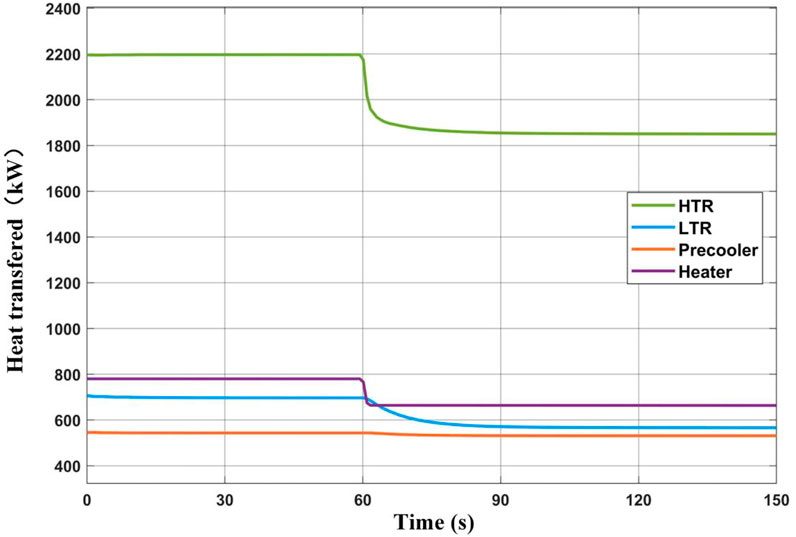
FIGURE 4. Dynamic response of heat transfer in heat exchangers while reducing heat source power.
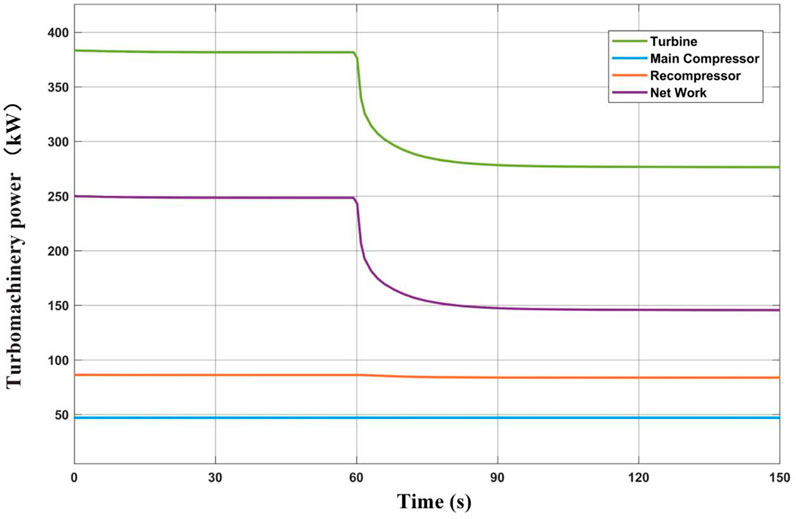
FIGURE 5. Dynamic response of turbine machinery power while reducing heat source power.
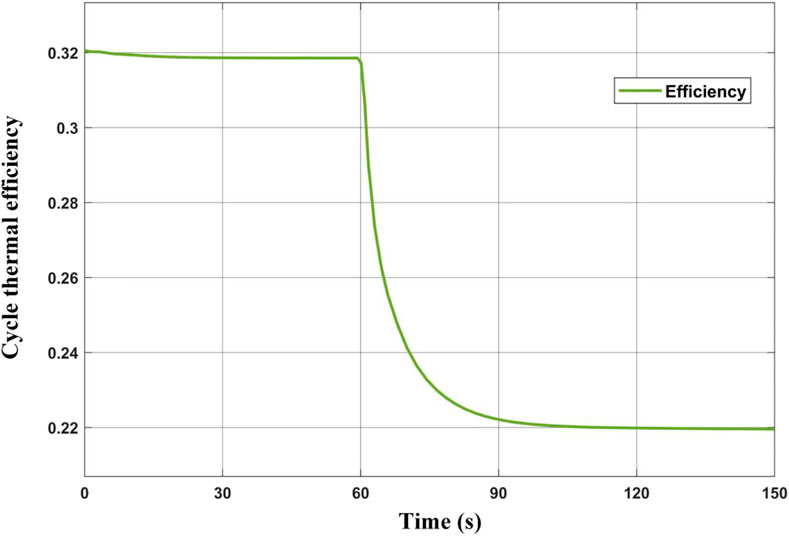
FIGURE 6. Dynamic response of system thermal efficiency while reducing heat source power.
When the simulation system is in the stable stage, a disturbance is added to the heat of the heater during 60–65 s, and the control turbine speed unchanged. The heating capacity increases from 780 to 900 kW, which is an increase of 15%. Monitor the change of various thermodynamic parameters of system components on the platform, collect the data and draw the corresponding change curves.
Figure 7 shows the effect of increasing heat source power on the cycle temperature. The outlet temperature of the heat source rises from the stable value of 808.7–865.1 K in about 5 s, while the turbine outlet temperature rises to 794.6 K. The HTR cold-side outlet temperature decreases from 696.7 to 648.5 K, which has the same changing trend as the HTR hot-side inlet temperature. After that, the temperature of all components slows down. The temperature change rate of HTR hot-side outlet and cold-side inlet is obviously less than that of the above three places. The temperature change range of LTR cold-side outlet temperature and hot-side inlet is smaller, and the hot-side outlet temperature of the precooler is almost unchanged. At about 120 s, the system reaches a new steady state. The outlet temperature of the heat source is 877.1 K; the outlet temperature of the turbine is 804.1 K; the inlet temperature of the recompressor rises from 335.2 to 338.2 K; the inlet temperature of the main compressor is almost unchanged.
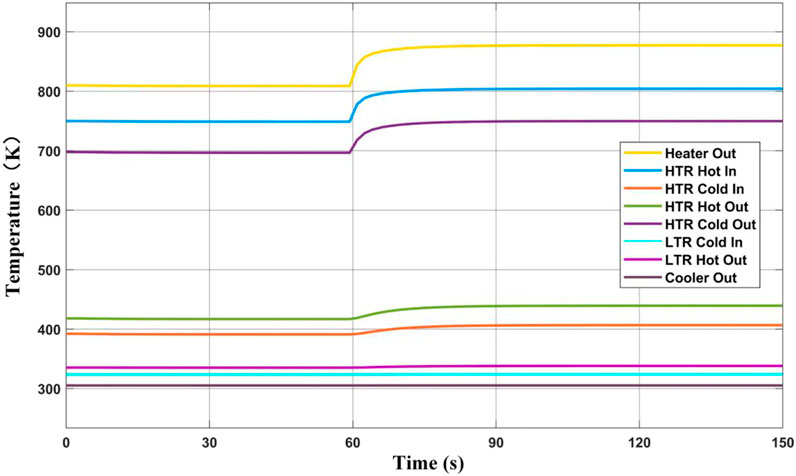
FIGURE 7. Dynamic response of cycle temperature while increasing heat source power.
The increase of heat source power leads to the increase of heat transfer of HTR, LTR, and precooler. At the same time, the response of the above three heat exchangers to the heat source power fluctuation gradually slows down. HTR heat transfer power rises from 2,197.4 kW to 2,424.6 kW, increasing by 10.3%; LTR heat transfer power rises from 696.5 to 809.6 kW, increasing by 16.2%; Precooler heat transfer power rises from 543.4 to 555.9 kW, increasing by 2.3%. The power output of the turbine increases considerably. The power consumption of the main compressor and the recompressor changes slightly, and the net-work output of the cycle system increases significantly from 248.5 to 351.1 kW. The dynamic response of the cycle thermal efficiency is shown in Figure 8. It can be seen from the figure that the thermal efficiency of the cycle system increases from 31.9 to 39.1%.

FIGURE 8. Dynamic response of system thermal efficiency while increasing heat source power.
When the simulation system is in the stable phase, a disturbance is applied to the flow rate of the heater inlet. During 60–65 s, the system flow rate decreased from 5.77 kg/s to 5.48 kg/s, which is a decrease of 5%. Monitor the change of various thermodynamic parameters of system components on the platform, collect the data and draw the corresponding change curves.
Figure 9 shows the effect of reducing the system mass flow rate on the cycle temperature. If the heat source power is kept constant and the system mass flow rate is reduced, the outlet temperature of the heater will rise from a stable value of 808.7–861.1 K within 5 s, and the outlet temperature of the turbine increases to 803.5K. Because the regenerator is counter-current, the HTR cold-side outlet temperature which has the same variation trend as the HTR hot-side inlet temperature rises to 741.0 K. After that, the temperature rise rate slows down, because the mass flow rate of the system has not changed, and the heat which returns from the HTR will affect the inlet temperature of the heater. Due to the influence of thermal inertia, the temperature change rate of the HTR cold-side inlet and the HTR hot-side outlet is less than that of the above three places. As the mass flow rate of working medium on the hot-side of the precooler decreases and the inlet temperature and mass flow rate of the cold-side water remain unchanged, the outlet temperature of the working medium on the hot-side decreases from 305.3 to 304.8 K. The compressor outlet temperature (LTR cold-side inlet temperature) decreases from 323.6 to 321.6 K. The LTR hot-side outlet temperature decreases from 335.2 to 334.0 K, which has the same changing trend as the LTR cold-side inlet temperature. After 5 s, the LTR hot-side outlet temperature increases to 334.5 K and remains stable because the cycle system mass flow rate has not changed and the inlet temperature still rises slowly.
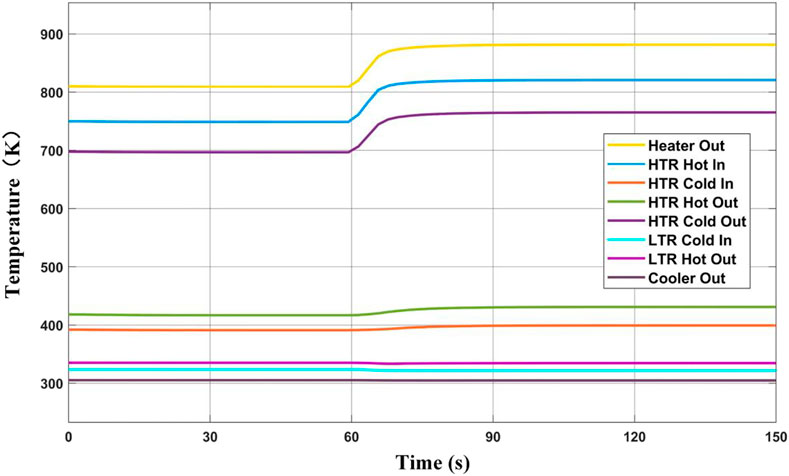
FIGURE 9. Dynamic response of cycle temperature while reducing the cycle mass flow rate.
The heat transfer power of the heat exchangers in the cycle system is shown in Figure 10. The power of the heat source remains the same. The heat transfer power of HTR and LTR increases due to the rising temperature of the hot-side inlet. The heat transfer of the HTR increases to 2,465.4 kW, increasing by 12%; The heat transfer power of the LTR increases to 760.4 kW, increasing by 9.17%. The heat transfer power of the precooler decreases to 524.3 kW within 5 s and then increases to 534.6 kW because the inlet temperature decreases firstly and then increases. The power variation of the turbine machinery of the circulating system is shown in Figure 11, and the dynamic response of the cycle thermal efficiency is shown in Figure 12. Within 5 s of the change of cycle mass flow, the work done by the turbine decreases. After the flow is stable, the work done by the turbine increases due to the increase in inlet temperature. The power consumption of the main compressor and the recompressor is reduced, but the reduction range is relatively small. The cycle net-work decreases to 231.8 kW in 5 s and then increases to 256.4 kW in about 120 s, which results in the cycle efficiency decreasing from 31.9 to 29.7% within 5 s, then increasing to 32.9% and finally stabilizing.
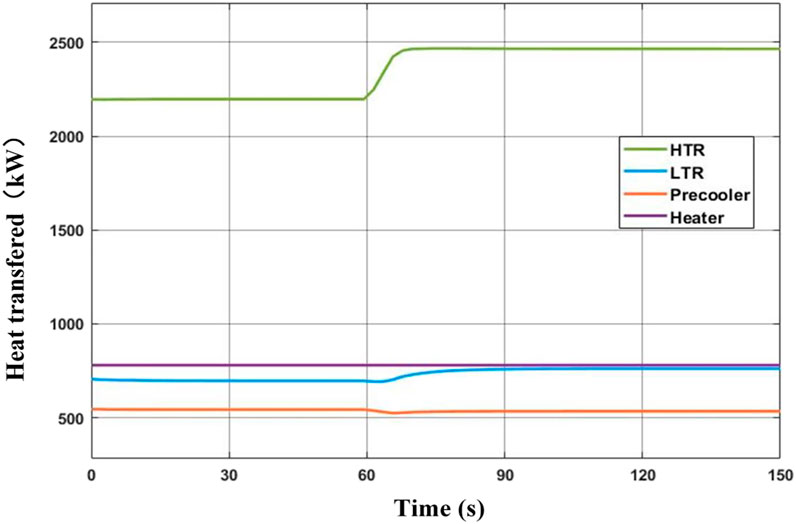
FIGURE 10. Dynamic response of heat transfer in heat exchangers while reducing the cycle mass flow rate.
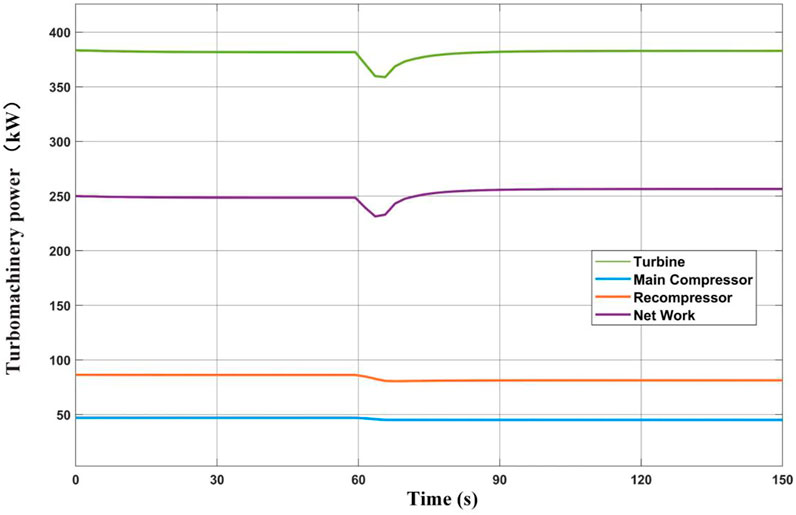
FIGURE 11. Dynamic response of turbine machinery power while reducing the cycle mass flow rate.
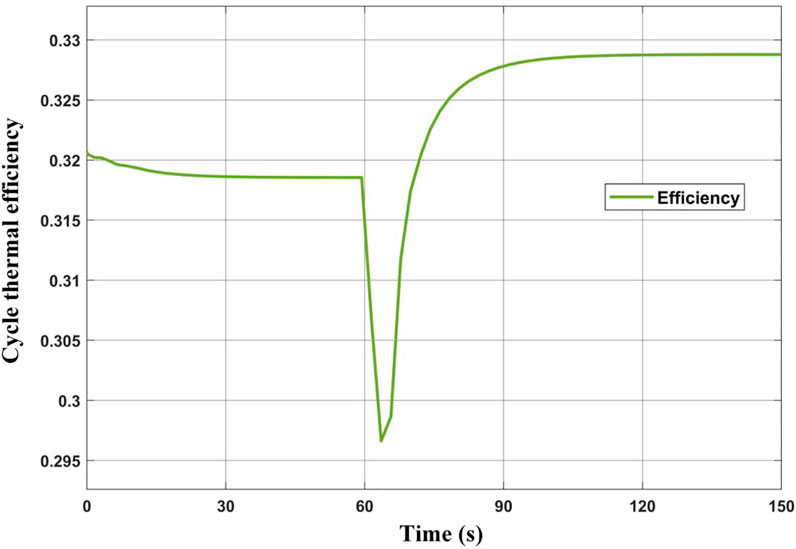
FIGURE 12. Dynamic response of system thermal efficiency while reducing the cycle mass flow rate.
When the simulation system is in the stable phase, a disturbance is applied to the flow rate of the heater inlet. In 60–65 s, the system flow rate increases from 5.77 kg/s to 6.06 kg/s, which is an increase of 5%. Monitor the change of various thermodynamic parameters of system components on the platform, collect the data, and draw the corresponding change curves.
Figure 13 shows the effect of increasing the system mass flow rate on the cycle temperature. The temperature variation trend of each part is opposite to that of decreasing system flow rate. The outlet temperature of the heat source is reduced to 762.1 K within 5 s, the outlet temperature of the turbine is reduced to 700.3 K, and the HTR cold-side outlet temperature is reduced to 654.4 K. After that, the temperature drop slows down. The temperature change rate of the HTR cold-side inlet and the hot-side outlet is less than that of the above three places. The outlet temperature of the precooler increases from 305.3 to 305.5 K due to the decrease of the mass flow rate of SCO2 on the hot side of the precooler. The main compressor outlet temperature (LTR cold-side inlet temperature) then increased from 323.6 to 325.7 K. The LTR hot-side inlet temperature increases from 335.2 to 337.2 K. After 5 s, the LTR hot-side outlet temperature decreases to 336.4 K and then remains stable because the cycle system flow rate has not changed and the LTR hot-side inlet temperature still decreases slowly.
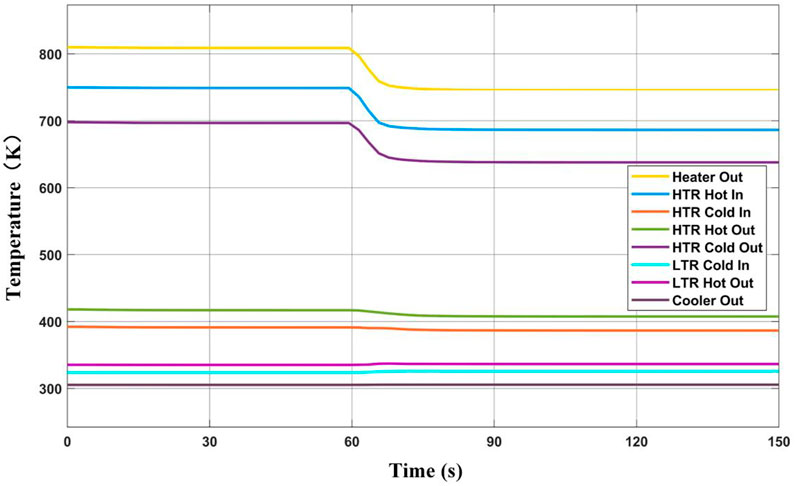
FIGURE 13. Dynamic response of cycle temperature while increasing the cycle mass flow rate.
The power of the heat source remains the same. The heat transfer power of HTR and LTR decreases due to the falling temperature of the hot-side inlet. The heat transfer of the HTR decreases to 1931.5 kW, increasing by 12.1%; The heat transfer power of the LTR decreases to 645.1 kW, decreasing by 7.4%. Within 5 s of the change of cycle mass flow rate, the work done by the turbine increases. After the flow is stable, the work done by the turbine decreases due to the decrease in inlet temperature. The power consumption of the main compressor and the recompressor increases slightly. the dynamic response of the cycle thermal efficiency is shown in Figure 14. The cycle net-work increases to 262.9 kW in 5 s and then increases to 241.4 kW in about 120 s, which results in the cycle efficiency increasing from 31.9 to 33.7% within 5 s, then decreasing to 30.9% and finally stabilizing.
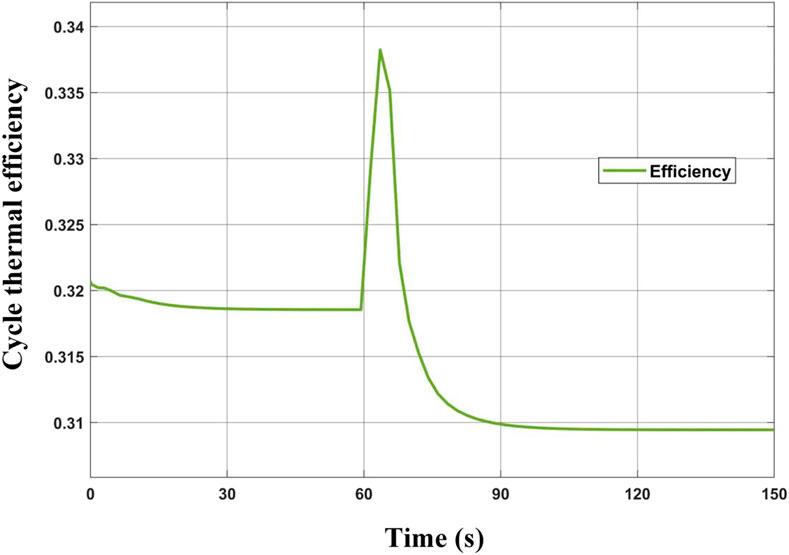
FIGURE 14. Dynamic response of system thermal efficiency while increasing the cycle mass flow rate.
In this paper, the component model of the SCO2 recompression Brayton cycle system, including compressor, turbine, HTR, LTR, precooler, and heater model, is established based on the idea of modularization and the conservation of mass equation, energy conservation equation, and heat transfer equation. A closed-loop simulation system is established in Matlab/Simulink software through the arrangement of the cycle system and the connection relationship of the components. The response characteristics of components inlet and outlet temperature, heat transfer of heat exchangers, turbine machinery power, and other parameters in the system were studied by applying heat source heating power and cycle system mass flow rate disturbance experiments. The main conclusions can be summarized as follows:
(1) The model has high accuracy, and can reflect the dynamic response of system performance under parameter perturbation. Due to the lack of public experimental data experimental data of the SCO2 Brayton cycle, the simulation calculation research will lay the foundation for the corresponding unit control strategy and the engineering application of the SCO2 cycle system. The steady-state thermodynamic analysis at design point conditions of the SCO2 recompression Brayton cycle system predicted a thermal efficiency of 31.85%.
(2) The model calculation results show: When a disturbance is applied to the system, the response time of the components behind the disturbance is the shortest, and the response time of each component gradually increases along the path of the cycle, and the time to reach the steady state becomes longer successively.
(3) The parameters of the cycle system are sensitive to the change of heat source power. The temperature change is mainly concentrated near the heat source of the cycle, while the change near the precooler is relatively small. The effect on cycle efficiency decreases from 31.9 to 22.0%. The effect of increasing heat source power on the cycle system is just the opposite.
(4) Reducing the system flow will increase the temperature near the heat source of the cycle, and decrease the temperature near the precooler. The cycle efficiency decreasing from 31.9 to 29.7% within 5 s, then increasing to 32.9%, and finally stabilizing. Increasing system mass flow rate has the opposite effect on the system.
(5) Under various perturbations, the outlet temperature of the precooler changes very slightly. Due to the high degree of non-ideality of thermophysical properties such as viscosity, density, heat capacity, and conductivity, small changes in the inlet working condition of the main compressor can have a significant impact on the total system performance. Therefore, it is necessary to control the inlet situation of the compressor to ensure its reasonable operating range.
(6) According to the results of the dynamic characteristics after applying the disturbance, a control strategy for the S-CO2 recompression Brayton cycle system is proposed. During the disturbance, the inlet temperature of the main compressor is controlled by cooling water to maintain the design point; the inlet temperature of the turbine is controlled by the bypass control valve and additional heat accumulator. Based on the above control strategy, the stable operation of the system is realized.
The original contributions presented in the study are included in the article/supplementary material, further inquiries can be directed to the corresponding author.
BZ, QZ, and RH contributed to conception and design of the study. QZ organized the calculation model. RH performed the analysis. QZ wrote the first draft of the manuscript. BZ, RH, SY, and ZY wrote sections of the manuscript. All authors contributed to manuscript revision, read, and approved the submitted version.
This project was supported by the National Natural Science Foundation of China (51876020), Innovation Center of Nuclear Power Technology for National Defense Industry, and the Fundamental Research Funds for the Central Universities.
The authors declare that the research was conducted in the absence of any commercial or financial relationships that could be construed as a potential conflict of interest.
The reviewer CW declared a shared affiliation with one of the authors, SY, to the handling editor at time of review.
All claims expressed in this article are solely those of the authors and do not necessarily represent those of their affiliated organizations, or those of the publisher, the editors and the reviewers. Any product that may be evaluated in this article, or claim that may be made by its manufacturer, is not guaranteed or endorsed by the publisher.
Ahn, Y., Bae, S. J., Kim, M., Cho, S. K., Baik, S., Lee, J. I., et al. (2015). Review of Supercritical CO2 Power Cycle Technology and Current Status of Research and Development. Nucl. Eng. Techn. 47 (6), 647–661. doi:10.1016/j.net.2015.06.009
Ahn, Y., and Lee, J. I. (2014). Study of Various Brayton Cycle Designs for Small Modular Sodium-Cooled Fast Reactor. Nucl. Eng. Des. 276, 128–141. doi:10.1016/j.nucengdes.2014.05.032
Anderson, M., Sienicki, J., Moisseytsev, A., Nellis, G., and Klein, S. (2015). Advanced Supercritical Carbon Dioxide Brayton Cycle Development. Madison, WI: University of Wisconsin.
Cao, Y., Rattner, A. S., and Dai, Y. (2018). Thermoeconomic Analysis of a Gas Turbine and Cascaded CO2 Combined Cycle Using thermal Oil as an Intermediate Heat-Transfer Fluid. Energy 162, 1253–1268. doi:10.1016/j.energy.2018.08.110
Chang, F., and Grandy, C. (2008). Advanced Burner Test Reactor Preconceptual Design report. United States: Argonne National Laboratories.
Crespi, F., Gavagnin, G., Sánchez, D., and Martínez, G. S. (2017). Supercritical Carbon Dioxide Cycles for Power Generation: A Review. Appl. Energ. 195, 152–183. doi:10.1016/j.apenergy.2017.02.048
Dostal, V., Driscoll, M. J., Hejzlar, P., and Todreas, N. E. (2002). “A Supercritical CO2 Gas Turbine Power Cycle for Next-Generation Nuclear Reactors[C],” in International Conference on Nuclear Engineering, Arlington, Virginia, USA, April 14–18, 2002.
Dostal, V., Hejzlar, P., and Driscoll, M. J. (2017). High-Performance Supercritical Carbon Dioxide Cycle for Next-Generation Nuclear Reactors. Nucl. Techn. 154 (3), 265–282. doi:10.13182/nt154-265
Dyreby, J. J. (2014). Modeling the Supercritical Carbon Dioxide Brayton Cycle with Recompression [PhD thesis]. Madison: The University of Wisconsin.
Huang, Y., Su, H., Zheng, Q., Yin, Y., and Wang, T. (2020). Research on Aerodynamic Characteristics of 5 MW Supercritical Carbon Dioxide Test Boiler[J]. Therm. Power Generation 49 (12), 36–40. doi:10.19666/j.rlfd.202006162
Jokar, M. A., Ahmadi, M. H., Sharifpur, M., Meyer, J. P., Pourfayaz, F., and Ming, T. (2017). Thermodynamic Evaluation and Multi-Objective Optimization of Molten Carbonate Fuel Cell-Supercritical CO 2 Brayton Cycle Hybrid System. Energ. Convers. Manag. 153, 538–556. doi:10.1016/j.enconman.2017.10.027
Liu, Y., Wang, Y., and Huang, D. (2019). Supercritical CO2 Brayton Cycle: A State-Of-The-Art review[J]. Energy 189 (12), 115900. doi:10.1016/j.energy.2019.115900
Luu, M. T., Milani, D., Mcnaughton, R., and Abbas, A. (2017). Dynamic Modelling and Start-Up Operation of a Solar-Assisted Recompression Supercritical CO 2 Brayton Power Cycle. Appl. Energ. 199, 247–263. doi:10.1016/j.apenergy.2017.04.073
Lv, G., Yang, J., Shao, W., and Wang, X. (2018). Aerodynamic Design Optimization of Radial-Inflow Turbine in Supercritical CO2 Cycles Using a One-Dimensional Model. Energ. Convers. Manag. 165, 827–839. doi:10.1016/j.enconman.2018.03.005
Ma, Y., Liu, M., Yan, J., and Liu, J. (2017). Thermodynamic Study of Main Compression Intercooling Effects on Supercritical CO2 Recompression Brayton Cycle. Energy 140, 746–756. doi:10.1016/j.energy.2017.08.027
Meshram, A., Clifford, D., Pradip, K., Sagar, D., Ortega, J. D., and Jaiswal, A. K. (2016). Modeling and Analysis of a Printed Circuit Heat Exchanger for Supercritical CO2 Power Cycle Applications[J]. Appl. Therm. Eng. 109, 861. doi:10.1016/j.applthermaleng.2016.05.033
Milani, D., Luu, M. T., Mcnaughton, R., and Abbas, A. (2017). A Comparative Study of Solar Heliostat Assisted Supercritical CO2 Recompression Brayton Cycles: Dynamic Modelling and Control Strategies. J. Supercrit. Fluids 120, 113–124. doi:10.1016/j.supflu.2016.09.009
Moisseytsev, A., and Sienicki, J. J. (2009). Investigation of Alternative Layouts for the Supercritical Carbon Dioxide Brayton Cycle for a Sodium-Cooled Fast Reactor. Nucl. Eng. Des. 239 (7), 1362–1371. doi:10.1016/j.nucengdes.2009.03.017
Monjurul Ehsan, M., Guan, Z., Klimenko, A. Y., and Wang, X. (2018). Design and Comparison of Direct and Indirect Cooling System for 25 MW Solar Power Plant Operated with Supercritical CO2 Cycle. Energ. Convers. Manag. 168, 611–628. doi:10.1016/j.enconman.2018.04.072
Neises, T., and Turchi, C. (2014). A Comparison of Supercritical Carbon Dioxide Power Cycle Configurations with an Emphasis on CSP Applications. Energ. Proced. 49, 1187–1196. doi:10.1016/j.egypro.2014.03.128
Olumayegun, O., and Wang, M. (2019). Dynamic Modelling and Control of Supercritical CO2 Power Cycle Using Waste Heat from Industrial Processes. Fuel 249, 89–102. doi:10.1016/j.fuel.2019.03.078
Park, J. H., Park, H. S., Kwon, J. G., Kim, T. H., and Kim, M. H. (2018). Optimization and Thermodynamic Analysis of Supercritical CO2 Brayton Recompression Cycle for Various Small Modular Reactors. Energy 160 (OCT.1), 520–535. doi:10.1016/j.energy.2018.06.155
Pasch, J. J., Thomas, M.C, and Darryn, D. (2012). Supercritical CO2 Recompression Brayton Cycle:completed Assembly Description. United States: Sandia National Laboratories.
Richard, D., Andrew, G., and Henry, S. (2018). “Development of A Dynamic Model for A 250 Kw Supercritical Co2 Simple Regenerative Brayton Cycle Plant[C],” in Proceedings of Montreal 2018 Global Power and Propulsion Forum, Montreal, Canada, May 7–9, 2018.
Sarkar, J. (2015). Review and Future Trends of Supercritical CO2 Rankine Cycle for Low-Grade Heat Conversion. Renew. Sust. Energ. Rev. 48, 434–451. doi:10.1016/j.rser.2015.04.039
Seong, S.-H. (2014). Simulation of Some Performance-Related Events of KALIMER-600. Ann. Nucl. Energ. 63, 176–187. doi:10.1016/j.anucene.2013.07.047
Seong, S.-H., and Kim, S.-O. (2012). Performance Evaluation of Control Strategies for Power Maneuvering Event of the KALIMER-600. Ann. Nucl. Energ. 42, 50–62. doi:10.1016/j.anucene.2011.12.003
Sinicki, J., Moisseytsev, A., Cho, D., Momozaki, Y., Kilsdonk, D., Haglund, R., et al. (2007). “Supercritical Carbon Dioxide Brayton Cycle Energy Conversion for Sodium-Cooled Fast Reactors/Advanced Burner Reactors[R],” in GLOBAL 2007: Advanced Nuclear Fuel Cycles and Systems, Boise, United State, September 9–13, 2007.
Span, R., and Wagner, W. (1996). A New Equation of State for Carbon Dioxide Covering the Fluid Region from the Triple‐Point Temperature to 1100 K at Pressures up to 800 MPa. J. Phys. Chem. Reference Data 25 (6), 1509–1596. doi:10.1063/1.555991
Su, H., Huang, Y., Yin, Y., Wang, T., Guo, X., and Wang, Y. (2020). Coupling Calculation Model of Thermal Characteristics and Wall Temperature of 5 MW Supercritical Carbon Dioxide Experimental Boiler[J]. Therm. Power Generation 49 (10), 151–156. doi:10.19666/j.rlfd.202001031
Viswanathan, R., Coleman, K., and Rao, U. (2006). Materials for Ultra-supercritical Coal-Fired Power Plant Boilers[J]. Int. J. Press. Vessels Piping 83 (11-12), 778–783. doi:10.1016/j.ijpvp.2006.08.006
Wang, R., Shu, G., Wang, X., Tian, H., Li, X., Wang, M., et al. (2020). Dynamic Performance and Control Strategy of CO2-mixture Transcritical Power Cycle for Heavy-Duty Diesel Engine Waste-Heat Recovery. Energ. Convers. Manag. 205, 112389. doi:10.1016/j.enconman.2019.112389
S entropy,
W power of turbomachinery, kW
Greek
HTR high temperature recuperator
LTR low temperature recuperator
PCHE printed circuit heat exchanger
Keywords: supercritical carbon dioxide, recompression brayton cycle, dynamic model, system simulation, matlab/simulink
Citation: Zhu Q, Han R, Yang S, Zhang B and Yang Z (2022) Dynamic Characteristic Study of Supercritical CO2 Recompression Brayton Cycle System. Front. Energy Res. 10:843237. doi: 10.3389/fenrg.2022.843237
Received: 25 December 2021; Accepted: 31 January 2022;
Published: 14 March 2022.
Edited by:
Jun Wang, University of Wisconsin-Madison, United StatesReviewed by:
Fubin Yang, Beijing University of Technology, ChinaCopyright © 2022 Zhu, Han, Yang, Zhang and Yang. This is an open-access article distributed under the terms of the Creative Commons Attribution License (CC BY). The use, distribution or reproduction in other forums is permitted, provided the original author(s) and the copyright owner(s) are credited and that the original publication in this journal is cited, in accordance with accepted academic practice. No use, distribution or reproduction is permitted which does not comply with these terms.
*Correspondence: Bo Zhang, emhhbmdib0BkbHV0LmVkdS5jbg==
Disclaimer: All claims expressed in this article are solely those of the authors and do not necessarily represent those of their affiliated organizations, or those of the publisher, the editors and the reviewers. Any product that may be evaluated in this article or claim that may be made by its manufacturer is not guaranteed or endorsed by the publisher.
Research integrity at Frontiers
Learn more about the work of our research integrity team to safeguard the quality of each article we publish.