 Duo Xu
 Gengyuan Liu
 Linyu Xu1,2
95% of researchers rate our articles as excellent or good
Learn more about the work of our research integrity team to safeguard the quality of each article we publish.
Find out more
ORIGINAL RESEARCH article
Front. Energy Res. , 04 March 2022
Sec. Sustainable Energy Systems
Volume 10 - 2022 | https://doi.org/10.3389/fenrg.2022.842061
Carbon emissions, being embedded in sectorial production chains, need to be reduced through targeted carbon emission reduction strategies. For such a reason, it is urgent to assess the contributions of different influencing factors among different sectors for different supply chains. Focused on China, being the world’s largest carbon emitter, this paper uses the latest 2018 China’s input-output table to assess different factors, at sectoral scale, related to embodied carbon emissions. The analysis proved that the total final use factor prompted the largest emission growth, while the input-output structure factor inhibited the emission increase significantly. The gross fixed capital formation category was the largest contributor to aggregate embodied carbon emission growth, followed by urban consumption and export categories. The construction was identified as a key sector for its embodied carbon emission, the most relevant intermediate inputs to construction sector are the manufacture of non-metallic mineral products, the smelting and rolling of metals, and the production and supply of electric power and heat power sectors. Results indicate that, in the case of China, low-carbon building materials should be favored in the future. Meanwhile, energy-saving should be promoted among urban residents to increase the effectiveness of carbon emissions reduction strategies.
The serious environmental problems caused by increasing carbon emissions attract the attention of citizens all over the world. As the largest carbon-emitting country, China faces pressures in carbon control and reduction works (Yang et al., 2020a). With this respect, the Chinese government has made many arrangements and efforts for carbon emission reduction. On the general debate of the 75th United Nations General Assembly, held in September 2020, China made a clear commitment to achieve carbon peak in 2030 and carbon neutrality in 2060. China is in a developing stage, which requires huge energy availability to fulfill various production activities. Energy consumption and carbon emission control guidelines are still emphasized in the 14th Five-Year Plan and Social Development and Vision 2035, which reflects China’s determination to reduce carbon emissions.
In this context, it is particularly important to study the change of China’s carbon emissions. The carbon emissions from industry production activities are essential for carbon reduction targets, which account for more than 90% of total carbon emissions (Wang et al., 2017c). In addition to direct energy consumption, which generates direct carbon emissions, the input-output process of products among different sectors also emits huge amounts of carbon.
The carbon emission of a product from its production process to consumption is usually called “embodied carbon emission” (Gao et al., 2021). Embodied carbon emissions are placed in the “black box” of an economic system and can be quantified only with the help of environmental economic tools. There are several methods to evaluate embodied carbon emissions, such as the input-output model and life cycle assessment (LCA) method. Many scholars used them to study the aggregate embodied carbon emissions of a region or country, such as the embodied carbon emission in China exports calculated by the input-output method from Gong et al. (2016), Zhu et al. (2020) also used the input-output model to estimate the embodied carbon emission from China’s building sector. Kayacetin and Tanyer (2020) assessed the embodied carbon of the built environment by developing the LCA method, Li et al. (2021a) adopted the LCA method to calculate embodied carbon emission of straw bale rural houses. It is generally confirmed that high amounts of indirect carbon emissions are contained in the supply chain, even far exceeding direct carbon emissions. However, due to the complexity of the sectoral production chains in the economic system, embodied carbon emissions evaluation alone is not sufficient for supporting carbon control and reduction works. Thus, it is urgent to track supply chains to find the key sectors and factors that contribute significantly to embodied carbon emission changes and to formulate efficient emission reduction measures according to the characteristics of these key economic sectors.
Many research articles have studied the contributions of different influencing factors on embodied carbon emissions, and the number of embodied carbon emission path decomposition analysis papers are increasing. However, there is still a lack of research on the input-output relationship among the sub sectors of key sectors after the identification of key transmission paths of embodied carbon emissions. This topic is worth studying because the sub sectors correspond to more accurate product information, which has more detailed guiding value for optimizing the input-output structure among key sectors. This study uses the structural path decomposition method and ecological network analysis to investigate the factors that influence the transmission paths of China’s aggregate embodied carbon emissions and to fulfill the literature gap on this topic, considering a final user (consumer-side) and detailed sub sectoral perspective. Specifically, in this study: 1) The latest 2018 China input-output table is used to reveal the closest aggregate embodied carbon emissions and their sectoral transmission chains. 2) Six final user categories are studied to find their contributions to aggregate the embodied carbon emission changes. 3) The key sub sectors are further studied to identify their sectoral relationships. The study is subdivided in four sections. Literature Review presents the relevant research by literature review. Methods and Data describes the methods and data used in this paper. Results and Discussion shows the results and discussion. Conclusion gives the conclusion of this paper.
The input-output analysis method is widely applied in environmental studies, despite the fact that it was originally used to analyze economic problems, such as policy simulation and economic forecasting, when it was firstly proposed by Leontief (1986). Based on checkerboard-type input-output tables, this method is able to assess the environment-related variables contained in supply chains of various sectors and to evaluate the sectoral relationship impact on these variables by the Leontief inverse matrix (Vukic et al., 2021). By introducing a direct carbon emission coefficient, many scholars used this method to calculate embodied carbon emissions which are difficult to observe directly in the black box of the economic trade system, such as the input-output method used by Huang et al. (2020) to assess the embodied carbon emissions in China-Australia trade, and Wei et al. (2020) also used the method to calculate the embodied carbon emissions in China’s interprovincial trade. The input-output method is often combined with other methods like structural decomposition analysis, ecological network analysis, and structural path analysis. Depending on the final scope of the study, these methods are used to solve problems such as the contribution effect of influencing factors, the positioning identification of sectoral ecological relations, detailed information collection of different transmission layers, and the extraction of key transmission paths.
The structural decomposition analysis method and index decomposition analysis are two factor decomposition methods, both of them are applied to study the contribution effects of various influencing factors on environmental variables, such as energy consumption and carbon emissions. The index decomposition analysis can be further divided into Divisia index decomposition analysis and Laspeyres index decomposition analysis. The index decomposition method has the convenience of data acquisition and it does not have to rely on input-output tables like the structural decomposition method. However, it cannot assess both the direct and indirect effects on production chains (it can only study the direct effect), while the structural decomposition method can well realize both (Hoekstra and van der Bergh, 2003). Originating from energy system analysis, the different index decomposition methods have advantages in energy flows and energy balances analysis (Wang et al., 2017b). In particular, the logarithmic mean Divisia index method can effectively solve the problems of incomplete decomposition and zero or negative values in the decomposition process. Thus, it has gradually become the mainstream index decomposition method in recent years, scholars used it to assess the effect of various influencing factors on carbon emission changes, such as the factor effects on the carbon emission changes of China’s cement industry by Xu et al. (2012), Xie et al. (2019) also used the method to study the carbon emission changes in China’s power industry.
Unlike the index decomposition method, which mainly focuses on single sector analysis, the structural decomposition method mainly focuses on whole economy scope studies (Su and Ang, 2012). It contains an additive decomposition form, applied to absolute variable studies (such as carbon emissions) and a multiplicative decomposition form, applied to intensity variable studies (such as carbon intensity). Compared with the multiplicative decomposition form, the additive decomposition form has more common applications. Many scholars used it to study the contributions of various influencing factors to carbon emission changes in different scopes. For example, Wei et al. (2017) studied the contributions of technology factors, economic structure, sectoral connection, and economic scale to carbon emission changes in Beijing from 2000 to 2010. They found that the former two factors inhibited carbon growth due to technological progress and economic structure adjustment, while the latter two factors prompted carbon growth due to the inefficient sectoral collaboration and rapid economic development. Ma et al. (2019) studied the contributions of energy structure, technical factor, final use structure, and final use level to the carbon emissions of China’s power sector from 2007 to 2015. Their results proved that the final user level prompted a huge carbon emission increase, while the technical factor and energy structure inhibited large carbon emission growth. Due to the quantitative relationship among final use, intermediate use, and total output in the input-output table, the sectoral input-output structure, final use, and sectoral intensity are generally the key systems influencing factors, as proved by relevant literature. For example, Cansino et al. (2016) found that the input-output structure factor and total final use factor contributed the largest carbon emission increase in Spain from 1995 to 2009. The carbon emission decomposition result in the Chinese construction industry by Shi et al. (2017) indicated that the total final use factor contributed most to the emission increase, while the intensity factor offset the largest increase of the carbon emissions. The effective inhibition contribution of the intensity factor on carbon emission growth was also proved in the carbon emission study in Guangdong province by Wang et al. (2017a). However, the decomposition analysis of influencing factors in the above literature only hints at carbon emission changes at the overall level and does not go into the sectoral product supply chains.
Considering the complex links between sectors, it is important to explore the carbon emission sectoral contributions, therefore ecological network analysis and structural path analysis are the most widely applied methods to meet this task. Based on the input-output framework, ecological network analysis can determine sectoral pair-wise relationships for a given economic system (Fang and Chen, 2019). The sectoral pair-wise relationships can be divided into an exploitation, competition, and mutualism relationship by the integral utility intensity matrix (Wang et al., 2019). Besides, the ecological network analysis can also evaluate the stability and health of economic and environmental systems, such as the energy (Zhang et al., 2010), carbon (Zhang et al., 2019), water (Wu et al., 2016), and waste (Guan et al., 2019) transaction systems. For the embodied carbon flows studies based on ecological network analysis, the interregional carbon flows result of Duan et al. (2018) shows that the northwest is the largest controller for most regions in China; Chen et al. (2020) focused on Dongguan city and they found that the manufacturing industry has the largest embodied carbon flows. Compared with ecological network analysis that focuses on evaluating sectoral pair-wise relationships and system operation situations, the structural path analysis, proposed by Lantner (1974), mainly studies the transmission paths among sectors of different environmental systems. It uses the Taylor series expansion of the Leontief inverse matrix calculated by the input-output table to split the input-output analysis results into various transmission layers. Then, the transmission paths of carbon emissions among sectors can be studied (Yang et al., 2020b). Many works applied structural path analysis to study the transmission paths of carbon emissions, like Shao et al. (2018) who used the method to address the carbon imbalance issues in China, they found the higher transmission layers carry larger embodied carbon emissions than the first transmission layer. Shi et al. (2019) used the method to trace the carbon emission flows among sectors in China, and the path results show the electricity sector has the largest direct carbon emissions, and the construction sector has the highest embodied carbon emissions. Zhao et al. (2021) combined the path method with the multi-regional input-output model to explore the carbon emission transmit features of the electricity sector in China, and they found intra-provincial trade had transmitted larger embodied carbon emissions than inter-provincial trade. Combining the structural decomposition analysis and structural path analysis, the structural path decomposition analysis can identify the key influencing factors and how their influence on the supply chain paths can contribute to carbon emission changes (Wood and Lenzen, 2009). However, there are a few articles that use the structural path decomposition analysis to trace the contribution of transmission paths driven by influencing factors to carbon emission changes.
In addition to the common influencing factor analysis methods mentioned above, there are still other methods such as the IPAT method that focus on the contribution of population, affluence, and technical factors on the changes of environmental variables (Ehrlich and Holdren, 1971), and the STIRPAT method proposed by York et al. (2002) which overcomes the limitation of the IPAT method which can only be applied to qualitative research, it is a flexible random regression analysis of the above three types of factors. The grey correlation analysis can also be used to study the contributions of influencing factors on carbon emissions, it studies the correlation between various factors in an economic system dynamically based on time series data (Li et al., 2021b). Some other econometric models, such as the neural network model, are widely used to predict the contribution of influencing factors on carbon emissions. However, these methods are not like the structural decomposition method which has advantages in studying the impact of inter-sectoral production linkages on embodied carbon emissions, let alone the structural path decomposition analysis which can study the contribution of influencing factors on the embodied carbon on various transmission paths. Based on the ecological network analysis, the production relationship between sectors can be presented more intuitively, which provides a more comprehensive interpretation of the path decomposition results.
In summary, although there is good compatibility among the structural decomposition method, structural path analysis, and ecological network analysis, only a few studies used a comprehensive application of the above methods to study critical transmission paths of China’s sectoral embodied carbon emissions. This would allow us to connect the contribution of different factors to study their effects on different sector supply chains and to assess the embodied carbon emission changes from a detailed sectoral perspective. For such a purpose, this paper used the latest 2018 China’s input-output table and the results were analyzed to propose some recommendations on carbon emission reduction strategies.
This study applied the structural decomposition analysis method. The carbon emission changes from base year 0 to research year 1 can be calculated as:
where
The input-output table we use is based on a competitive assumption, which treats the input products as the same as the domestic products. We used the input coefficient
where
and the final use
where
There are six categories of final use: rural consumption (RC), urban consumption (UC), government consumption (GC), gross fixed capital formation (GF), inventory increase (IR), and exports (EX). It is obvious that
Based on the above equations, the change of carbon emissions can further be decomposed as:
The four polynomials in Eq. 6 represent the contributions of four influencing factors to carbon emission changes: carbon intensity factor (CI), input-output structure factor (LF), final use structure factor (FS), and total final use factor (TF), respectively.
By applying the Taylor expansion, carbon emissions can be calculated as:
Combining Eq. 7 and the two-polar decomposition method, the carbon emission change can be calculated as:
Then, the contribution of different production layers to carbon emissions can be analyzed by Eq. 8.
Many transmission paths cause embodied carbon emission changes. In order to eliminate the paths with little contributions, the threshold of 0.5% aggregate embodied carbon emission changes during the research period was set to retain critical transmission paths and eliminate the trivial transmission paths. The ecological network utility analysis was used to study the pair-wise relationship among key sub sectors, the detailed process can be found in Zheng et al. (2021).
The newest input-output table of China is the 2018 table. In particular, we used 2007, 2010, 2012, 2015, 2017, and 2018 input-output tables to analyze China’s total sectoral carbon emissions. To make input-output data in different years comparable, we used the double deflation method to deflate the 2010, 2012, 2015, 2017, and 2018 data to the 2007 price level, the price indexes of different sectors are obtained from China's statistical yearbook in different years. Due to the different divisions of the input-output table and sectoral energy consumption data, we adjusted the input-output sectoral classification to match the sectoral data. The sectors in the original input-output table were integrated into 28 aggregate sectors, their names and IDs are presented in Supplementary Appendix SA. The carbon emission data issued by CEADs was used to calculate the aggregate embodied carbon emissions.
The aggregate embodied carbon emissions (AECE) of China have increased sharply from 2007 to 2012. In particular, they increased by 21.55% from 2007 to 2010, by 15.02% from 2010 to 2012, and by 39.80% from 2007 to 2012. Despite the fact that carbon emissions still show an increasing trend after 2012, the growing rate has slowed down. In particular, it grew by 1.32% from 2012 to 2015, by 0.37% from 2015 to 2017, by 3.27% from 2017 to 2018, and, surprisingly, by 5.01% from 2012 to 2018.
The changes of AECE were decomposed into contributions of four influencing factors, as shown in Figure 1.
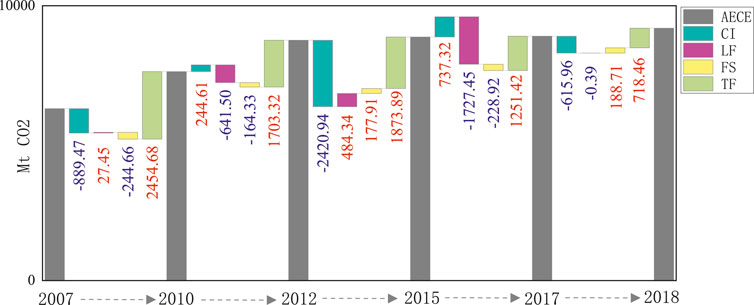
FIGURE 1. The aggregate embodied carbon emission (AECE) decomposition results from 2007 to 2018.
The contribution of the carbon intensity (CI) factor changed its direction along the considered five research periods. In particular, it inhibited the growth of AECE from 2007 to 2010 (by 889.47 Mt CO2), from 2012 to 2015 (by 2,420.94 Mt CO2), and from 2017 to 2018 (by 615.96 Mt CO2). However, it prompted the growth of AECE from 2010 to 2012 (by 244.61 Mt CO2) and from 2015 to 2017 (by 737.32 Mt CO2).
The input-output structure (LF) factor had a strong inhibitory effect on the increase of AECE from 2007 to 2018, especially from 2015 to 2017 (it restrained the growth of AECE from 2015 to 2017 by 1727.45 Mt CO2). Despite a tiny prompt effect on AECE decline from 2007 to 2010 and from 2017 to 2018, a larger inhibitory effect from 2012 to 2015 emerged as the key carbon reduction factor among these four factors.
Compared with the LF factor, the final use structure (FS) factor had a weaker inhibitory effect on the growth of AECE from 2007 to 2018. Even if it inhibited embodied carbon emissions from 2007 to 2012 and from 2015 to 2017, it prompted an increase of 188.71 Mt CO2 from 2017 to 2018. This contribution on carbon emission growth in just 1 year means that more attention needs to be paid to the changes of final use structure, especially when the contribution of the total final use (TF) factor to AECE shows a critical promoting effect in the five study periods (2454.68, 1703.32, 1873.89, 1251.42, and 718.46 Mt CO2 in five study periods, respectively). The optimization of final demand structure may play a key role in reducing AECE in the future. Considering the significant effect of the TF factor, it was necessary to further analyze the impact of final use on AECE.
From 2007 to 2018, the gross fixed capital formation (GF) category contributed significantly to the growth of AECE in four influencing factors. GF also played an important role in four influencing factors in five sub research periods. In other words, when these four influencing factors values changed, the GF category would trigger a relatively larger AECE change compared to other final use categories. It is worth noting that the urban consumption (UC) category would trigger larger AECE changes in the FS factor, as shown in Figure 2E.
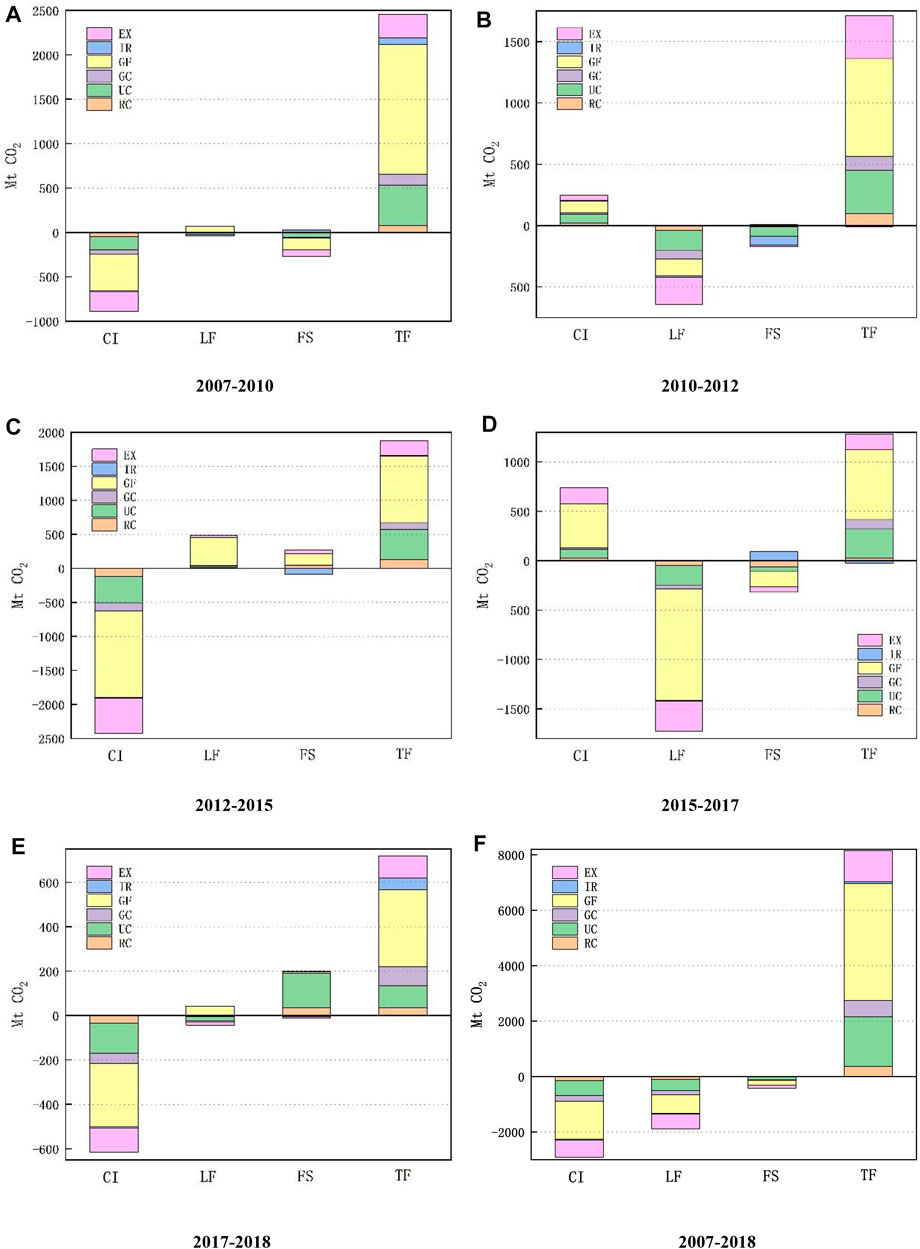
FIGURE 2. The contribution of influencing factors on the increase of aggregate embodied carbon emissions (AECE) by six final use categories. Figures refer to different year periods: (A) 2007–2010; (B) 2010–2012; (C) 2012–2015; (D) 2015–2017; (E) 2017–2018; (F) 2007–2018.
Among rural consumption (RC), urban consumption (UC), and government consumption (GC) categories, the UC category contributed larger AECE changes than the other two categories. Its contribution was similar to the export (EX) category. However, from 2007 to 2018, the UC contributed more to the AECE growth than EX in the TF factor. Thus, it can be inferred that the urban consumption of China increased sharply, while the consumption-driven economy had a steady development during the considered research period.
For change trend, the UC category in the TF factor gave its largest contribution in the research period from 2007 to 2010 (contribution ratio was 18.64%, 457.66 Mt CO2 increase). The AECE growth driven by the UC category in the TF factor then had small fluctuations from 2010 to 2015, while the amount declined sharply after 2015. Similarly, the GF category in the TF factor had its strongest prompt effect on AECE growth from 2007 to 2010 (contribution ratio was 59.47%, 1459.78 Mt CO2 increase), its pulling effect first weakened and then enhanced from 2010 to 2015, while the AECE growth driven by it decreased significantly after 2015. Although the GF category in the TF factor had less AECE growth after 2015 (706 Mt CO2 from 2015 to 2017 and 348.07 Mt CO2 from 2017 to 2018), its contribution ratio maintained a level of about 50%, and the ratio even increased by 4.28% from 2015 to 2017. Thus, it can be inferred that the key sectors, whose products are highly required by the GF category, may have played a stronger effect on AECE changes. The largest prompt effect of EX in the TF factor on AECE growth occurred during the 2010–2012 research period (contribution ratio was 20.52%, 349.5 Mt CO2 growth). Then, its prompt effect weakened after 2012.
It should be noted that there are different time spans in sub-research periods. In fact, the last sub research period only contained a 1-year span. Thus, the contribution effects of UC, GF, and EX may be magnified in the future. The FS and TF factors both directly related to final use, the CI and LF factors both indirectly related to final use, and GF, UC, and EX are three key final use categories in these four influencing factors driving AECE changes.
The differences and changes in the contribution proportion of various final uses lead to the further analysis of the transmission layers among sectors driven by final use. As shown in Figure 3, the strong prompt effect of the GF category on AECE was mainly from “S25-Construction”, “S25-Construction” needed more products from “S13-Manufacture of Non-metallic Mineral Products” and “S14-Smelting and Rolling of Metals”. These products delivery changes caused the growth of AECE, mainly depending on the product provided by S13. These two intermediate sectors needed products from themselves and “S22-Production and Supply of Electric Power and Heat Power”. Moreover, these products brought about the increase of AECE. In other words, the prompt effect of the TF factor on the AECE growth from 2007 to 2018 was mainly from the GF change of “S25-Construction”. This change pulled the embodied carbon emissions from the supply chains derived from “S25-Construction”, “S13-Manufacture of Non-metallic Mineral Products”, and “S14-Smelting and Rolling of Metals”, being key intermediate sectors, whose input changes would cause more AECE growth than other sectors. In parallel, the “S22-Production and Supply of Electric Power and Heat Power” was the key intermediate sector of S13 and S14.
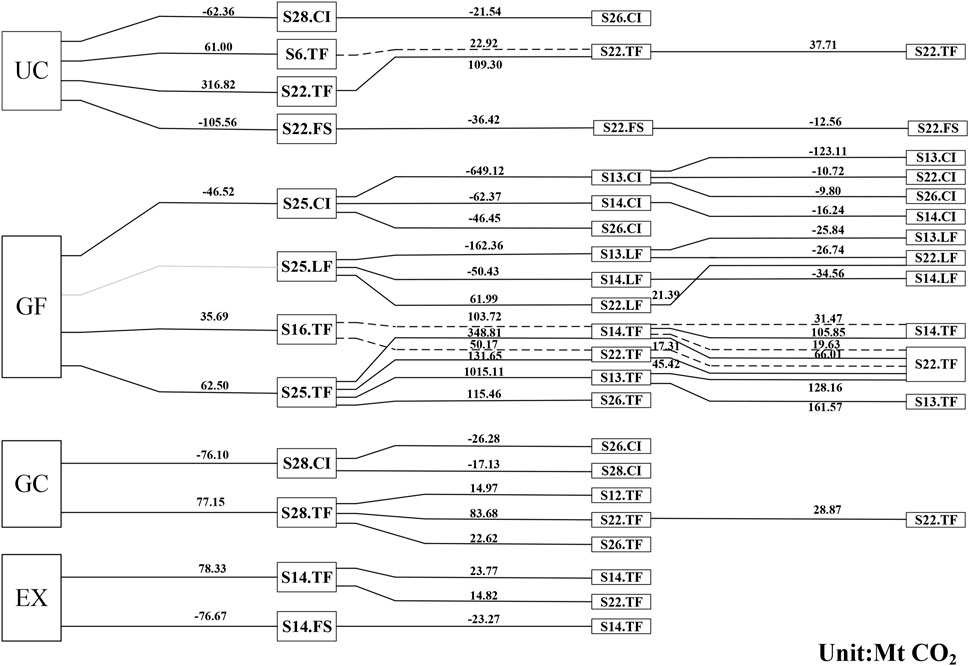
FIGURE 3. The top 30 supply chains of aggregate embodied carbon emission (AECE) changes during 2007–2018. The left column shows different final uses, the three columns on its right represent three transmission layers, the sectors in the rightmost column are also the upstream sectors of the supply chain (e.g., “S22.TF” means S22-caused AECE changes under the effect of total final use factor). The dotted line is only used to distinguish paths. The paths which AECE changes less than the threshold are not numbered.
Similar transmission paths also appeared on the CI and LF factors. The inhibition effect of the CI factor on AECE was mainly derived from the GF category. The contribution of the GF category to CI factor was mainly dependent on “S25-Construction”. Thus, under the products requirement of the GF category, the carbon intensity change of “S25-Construction” triggered the reduction of the largest AECE among 28 sectors. The effect was not directly dependent on its change, because the direct influence was relatively small on AECE, while the intensity change triggered a huge AECE decline on the intermediate product input from “S13-Manufacture of Non-metallic Mineral Products”, as shown in Figure 3. This critical carbon reduction path reflects that the low-carbon evolution of on-site construction in the construction industry has been fruitful. Due to the improvement of production efficiency, the products demand from the non-metallic mineral products sector also saw an obvious carbon reduction effect from 2007 to 2018.
Although the LF factor displayed almost the same key transmission paths as the CI factor, there was a tiny difference, because the input-output structure among various sectors did not appear on the first transmission layer. The input-output structure from the second transmission layer to the first transmission layer changed from 2007 to 2018. This change would inevitably pull AECE changes. The change of structure related to intermediate sectors on the second transmission layer, including “S13-Manufacture of Non-metallic Mineral Products” and “S14-Smelting and Rolling of Metals”, inhibited a larger AECE increase, while the input-output structure change between “S22-Production and Supply of Electric Power and Heat Power” and the construction sector caused a 61.99 Mt CO2 increase. The paths among the construction sector and the above three intermediate product input sectors indicate that the construction sector reduces the demand for high-carbon non-metallic mineral products and metal smelting products, and improves its own production efficiency. However, the use structure of power and thermal products in the construction industry is still not well optimized, which leads to high embodied carbon emissions.
The transmission path originated by “S22-Production and Supply of Electric Power and Heat Power”, driven by UC, also carried significant AECE changes. The UC changes of “S22-Production and Supply of Electric Power and Heat Power” prompted large AECE growth directly (316.82 Mt CO2). This change also affected the intermediate input of S22 to its own, which also increased AECE growth. Correspondingly, the changes of the UC ratio of “S22-Production and Supply of Electric Power and Heat Power” to total sectoral UC inhibited large AECE growth directly (105.56 Mt CO2).
It is worth noting that, if the “S22-Production and Supply of Electric Power and Heat Power” appeared on the first transmission layer, the sector on the higher transmission layer of this transmission path must be “S22-Production and Supply of Electric Power and Heat Power” too. This is because “S22-Production and Supply of Electric Power and Heat Power” needs some of its own products to fulfill its production requirements, including some energy recycling processes. As one of the largest carbon emission sectors, its embodied carbon emission per unit is higher than other sectors which is in accordance with the actual case, especially when its demand for its own products is huge, the rise of the embodied carbon emissions of the intermediate input process would be more obvious.
For the GC category, the main transmission path with apparent AECE changes came from “S28-Other Services”. Specifically, the GC change of “S28-Other Services” prompted the AECE to increase by 77.15 Mt CO2. This change further triggered the change of the product input from “S22-Production and Supply of Electric Power and Heat Power” to “S28-Other Services”, which created an AECE increase of 83.68 Mt CO2. On the other side, the carbon intensity changes of S28 reduced the emissions by 70.1 Mt CO2 directly, and this change drove a 26.28 Mt CO2 reduction along the transmission path from the intermediate input process of “S26-Transport, Storage, and Post”.
In the listed top 30 paths, the EX category only had two transmission paths which were both from the export change of “S14-Smelting and Rolling of Metals”, while the change of total export and export proportion brought the opposite contribution effects. The total export change of S14 created 78.33 Mt CO2 directly, while its export ratio change inhibited the AECE increase by 76.67 Mt CO2, both further affecting the product reuse process of S14, which, in turn, created 23.77 AECE growth and inhibited the AECE increase by 23.27 Mt CO2. For the other two final use categories, RC and IR, no key transmission paths among the listed top 30 paths were observed from 2007 to 2018. This is consistent with their weak contributions reflected in Figure 2.
The top 30 supply chains in the five sub research periods are presented in Supplementary Appendix SB and the total embodied carbon emission values of these supply chains are presented in Supplementary Appendix SC. Firstly, although there were contribution changes of final use categories on AECE, the largest AECE changes caused by influencing factors derived from the GF category, then the UC and EX categories. Secondly, for the other three final use categories, the RC category did not have a supply chain in the listed top 30 supply chains before 2012. During the last three sub research periods after 2012, the RC category had one or two supply chains, and its supply chains all belonged to “S22-Production and Supply of Electric Power and Heat Power”. Consequently, among all the 28 sectors, the carbon intensity changes (from 2012 to 2015) and final use structure changes (from 2012 to 2018) of S22 generated the largest AECE changes under the demand of rural consumption. Similarly, the supply chains of the GC category all belonged to “S28-Other Services” in the selected five sub research periods, while the supply chains of the IR category belonged to “S14-Smelting and Rolling of Metals” from 2012 to 2017 (it did not have a supply chain in the listed top 30 supply chains in other sub research periods). Thirdly, despite relatively more diverse supply chains in GF, UC, and EX categories, these three final use categories also had similar characteristics of “key sectors” in their supply chains. Specifically, under the products demand of the GF category to “S25-Construction”, the carbon intensity, final use structure, and the gross fixed capital formation changes of “S25-Construction” always caused large AECE changes indirectly. Moreover, the input-output structure changes among “S13-Manufacture of Non-metallic Mineral Products”, “S14-Smelting and Rolling of Metals”, “S22-Production and Supply of Electric Power and Heat Power”, “S25-Construction”, and “S26-Transport, Storage, and Post” also contributed to large AECE changes. For the UC category, its key sectors converged at “S22-Production and Supply of Electric Power and Heat Power” and “S28-Other Services”. The most evident AECE change was observed in the case of “S22-Production and Supply of Electric Power and Heat Power”. For the EX category, its key sectors on listed supply chains changed more briskly in different sub research periods than other final use categories. This reflects the changes in the trade situation and risks faced by exports in different periods. From 2007 to 2010, its key sector was “S14-Smelting and Rolling of Metals”, whose final use structure change gave a larger contribution to AECE decline under the demand of export. In particular, its key sector turned to “S7-Manufacture of Textile” from 2010 to 2012. Then, “S13-Manufacture of Non-metallic Mineral Products” and “S14-Smelting and Rolling of Metals” were the key sectors from 2012 to 2017.
The contributions of the key transmission paths to AECE growth changed from 2007 to 2018. The transmission path of “S13→S13→S25→GF” driven by the total final use changes of S25 prompted 361.32 Mt CO2 AECE growth from 2007 to 2010. Conversely, from 2010 to 2012 and from 2015 to 2017, this transmission path only prompted 164.02 and 147.31 Mt AECE, despite the fact that it was still the largest contributor to AECE growth. In the other two sub research periods, this transmission path prompted 201.76 (from 2012 to 2015) and 68.49 (from 2017 to 2018) Mt AECE growth, reducing its relevance as an AECE increase contributor from 2017 to 2018. As one of the typical sectors with significant indirect carbon emissions, the largest contribution to the AECE growth, driven by the gross fixed capital formation changes of construction sector, occurred at the second transmission layer, consisting in the process from “S13-Manufacture of Non-metallic Mineral Products” to “S25-Construction”. In parallel, the AECE growth directly induced by the gross fixed capital formation of the construction sector was tiny, as shown in the path diagrams. The AECE contribution decline of this transmission path after 2012 was due to the promulgation of a series of energy conservation and emission reduction policies in the construction industry and the rapid development of green buildings in recent years. The path diagrams also show that, with the promotion of energy conservation and emission reduction in the construction industry after 2015, the energy efficiency of the construction industry has been improved, the input-output structure between “S13-Manufacture of Non-metallic Mineral Products” and “S25-Construction” has been optimized, which inhibit significant AECE growth.
Apart from the above transmission paths, there are some other paths that need special attention. For example, the GF change of “S16-Manufacture of General and Special Purpose Machinery” caused large AECE increase from 2007 to 2018, while its carbon intensity change caused a large AECE decline, and the input-output structure between this sector and S14 had a trend of prompting AECE decline. This path result indicated that the optimization of the use structure of metal smelting products in this sector can effectively reduce AECE. In addition, the urban consumption changes of the products from “S6-Manufacture of Foods and Tobacco” drove larger AECE growth, and this contribution mainly occurred on the first transmission layer, which indicates that the emission reduction measures for urban food and tobacco consumption can effectively reduce AECE, such as actions against food waste.
The second transmission layer gave a larger contribution to AECE changes than the first transmission layer, as shown in Figure 4.
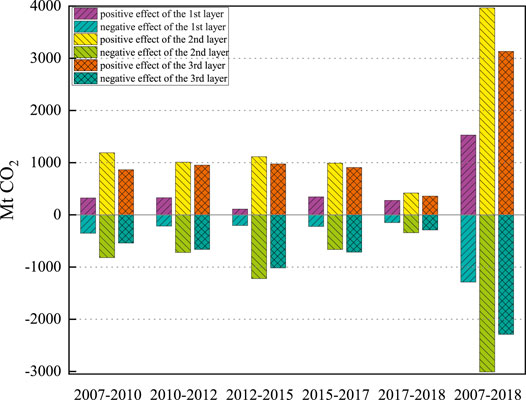
FIGURE 4. The contributions of transmission layers to aggregate embodied carbon emission (AECE) changes in different research periods.
This is a practical demonstration that AECE changes mainly resulted from high transmission layers. Instead, the carbon emissions, which occurred on the direct product requirement of final use, were lower compared to the carbon emission on the sectoral products supply chains. This is true, especially, on the second transmission layer, where each sector needs products from other sectors to meet its final use requirement.
The above results have shown that several key sectors significantly contribute to AECE changes. In particular, the second transmission layer has the largest contribution on AECE changes. Consequently, the detailed relationships among these key sectors are analyzed in this section to show clearer path results.
Due to the different division schemes of input-output tables in different years, in order to reflect the current sub sectoral relationships, the 2017 and 2018 input-output tables are further analyzed in this section. To reflect detailed sectoral relationships, the integrated sectors, such as “S13-Manufacture of Non-metallic Mineral Products”, were restored to multiple sub sectors, like cement, lime and gypsum, brick, tile, stone, and other building materials. The direct carbon intensities of these sub sectors were assumed to be the same as their integrated sector, for the direct carbon emission data of these sub sectors are missing. The sub sectoral names and IDs can be found in Supplementary Appendix SD.
The ecological relationships and their strength among these sub sectors reflected the key embodied carbon emission sources, as shown in Figure 5. Considering the key exploitation relationships, “S25-1-Building construction” mainly exploited the products from “S13-2-Gypsum, cement products and similar products”, “S13-3-Brick, tile, stone and other building materials”, “S13-5-Ceramic products”, and “S14-2-Steel rolling products”. In parallel, “S25-3-Construction installation” and “S28-Other Services” mainly exploited the products from “S22-Production and Supply of Electric Power and Heat Power” in 2017 and 2018. These exploitation relationships are the concrete manifestations of the key transmission paths that drove significant AECE changes.
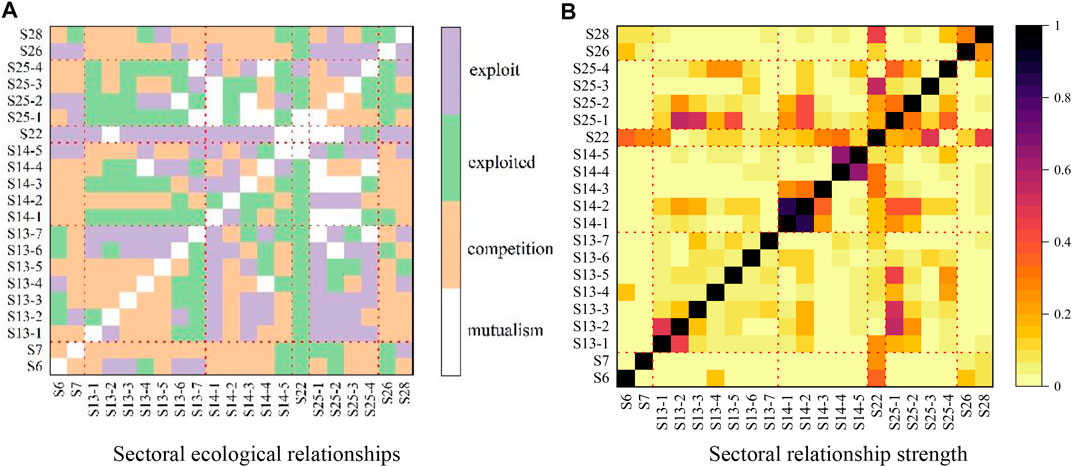
FIGURE 5. The ecological relationships and relationship strength among key sectors. Both maps are diagonally separated, the upper left half corresponds to 2018 and the lower right half corresponds to 2017. The exploitation relationships (exploit and exploited) in (A) are illustrated from the row to the column (e.g., S7 exploits S13-2 in 2018, S13-4 is exploited by S6 in 2017). The color of the squares in (B) indicates the strength of the ecological relationship between sectors. The darker the color, the stronger the ecological relationship.
There are also other important exploitation relationships derived from the results represented in Figure 5. In detail, “S14-2-Steel rolling products” exploited products from “S14-1-Steel”, while “S14-5-Non-ferrous metal rolling products” exploited products from “S14-4-Non-ferrous metal and alloy”. However, these two exploitation relationships are strict up-down industry relationships, considering that the exploiting sector must rely on the products of the exploited sector to carry out its production activities. Moreover, these relationships do not drive larger AECE changes than the former exploitation relationships.
The ecological relationships presented in Figure 5 also prove the competition system among these key sub sectors, with a high consistency between 2017 and 2018. Excluding the impact of industrial cycle and research interval, input-output structure and energy efficiency of these key sub sectors still have great room for optimization to reduce embodied carbon emissions.
Growing research focuses on the study of embodied carbon emissions on transmission paths among sectors. Compared with relevant studies which use the structural path decomposition method such as Tian et al. (2018) who studied China’s manufacture industry's carbon transmission paths from 1992 to 2012 and Li et al. (2021c) who studied the critical embodied carbon emission path of China from 2002 to 2017, this paper presents a more detailed research with multiple coherent study periods and all six different final use. The ecological relationships of sub sectors of key intermediate product input sectors with high embodied carbon emissions are further analyzed to provide more detailed information of sectoral products’ contribution to embodied carbon emission changes.
In order to truly reflect the actual sectoral input-output situation, the data processing must be rigorous to eliminate the influence of some factors, such as price fluctuation or inconsistent division of sectors, especially when the study contains several research years. The price deflation process is important not just because one input-output table is compiled at the current year’s price level, but the choice of price deflation method will directly affect the follow-up research results. The deflation process used the GDP index and double deflation method which are two common methods to make input-output tables in different years comparable, the GDP index method is more simple and it retains the data proportion relationships of the original table basically, while the double deflation method considers the heterogeneity of sectors and has more reliable results of comparable input-output tables. The GDP index method was therefore used to find the discrepancy with the result obtained above, and the corresponding chart results are in Supplementary Appendix SE.
Compared with the double deflation method, the factor decomposition result obtained by using the GDP index method has minor changes, only the input-output structure factor has changed its contribution direction from 2007 to 2010 and from 2012 to 2015, while the contributions of the other three influencing factors only have numerical difference and no change in their directions in each research period. The carbon intensity factor has a weaker effect on inhibiting the AECE growth in the GDP index deflation framework, while the inhibition effect of the input-output structure factor and the prompt effect of total final use factor have magnified. No matter the effect directions, the final use structure factor has a small contribution value than that in the double deflation framework. For the path decomposition results, the path “S13→S13→S25→GF” carried the largest AECE changes from 2007 to 2018 under both deflation frameworks, and even if the key path with largest AECE changed from “S13→S13→S25→GF” during 2007–2012 to “S22→S22→S22→UC” during 2017–2018, this change is also consistent in the two deflation frameworks. Besides, the listed top 30 key transmission paths are almost the same in each sub research and used the above two deflation method, only the AECE change values on these paths are different. The comparison between these two methods indicates that the choice of the two deflation methods has a small impact on the identification of key transmission paths of AECE changes under the contributions of sectoral influencing factors, but it will indeed affect the contribution value and even the contribution direction of influencing factors, especially for the input-output structure factor. So it is better to choose the double deflation method to truly reflect the sectoral input-output relationships in different research years at the same price level.
By analyzing the changes of the sectoral supply chains driven by the final use and four influencing factors, this paper studied the aggregate embodied carbon emission changes in China from 2007 to 2018. The results indicated that China’s aggregate embodied carbon emissions increased from 2007 to 2012, and slowed down from 2012 to 2018. The input-output structure among sectors displayed an obvious optimization, which not only showed the improvement of the sectoral production efficiency, but also proved that the sectoral dependence on high-carbon products has weakened during the research period. However, the sectoral final uses changes triggered the embodied carbon emissions, depending on the changes of gross fixed capital formation category, urban consumption, and exports categories. The gross fixed capital formation changes of the construction sector drove a huge embodied carbon emission increase through the supply chains, which contains the manufacture of non-metallic mineral products sector, the smelting and rolling of metals sector, and the production and supply of electric power and heat power sector as the key intermediate products input sectors. From 2017 to 2018, urban consumption changes influenced the production and supply of electric power and heat power sector, which caused the largest embodied carbon emission growth. The supply chains, driven by the gross fixed capital formation changes of the construction sector, still prompt a significant embodied carbon emission growth. The demand of materials from the building construction sector caused significant embodied carbon emissions. The demand from the construction installation sector and other services sector, in relation to the production and supply of electric power and heat sector, contain large embodied carbon emissions, which provides a reference for effective emission reduction measures.
Based on the above results, this study can impact on policy recommendations. Firstly, the policy makers should consider the innovation and application of low carbon building materials in building construction. For example, promoting the production technology innovation of building materials with high resource consumption such as cement and ceramics, optimizing their original production process, and looking for possible lower carbon building materials products should be attempted. It is necessary to give full play to the advantages of the building materials industry in absorbing solid industrial waste and municipal waste and to prompt the development of a circular and low-carbon economy by eliminating outdated production capacity and adhering to continuous technological innovation. Secondly, special attention should be paid to the carbon emissions contained in the process of construction installation and residents’ power and heat consumption. The power and heat consumption on the construction and installation site should be supervised strictly, and appropriate power supply equipment should be selected on the basis of rigorous estimation of power consumption. The power saving propaganda for urban residents and novel power saving activities design should be enhanced. Thirdly, structural transformation and development of emission reduction technologies of the power industry should be prompted, especially for the positioning adjustment of traditional coal power generation and the technological innovation of new energy power generation. These may have important contributions to China’s carbon peak and carbon neutrality targets.
The original contributions presented in the study are included in the article/Supplementary Material, further inquiries can be directed to the corresponding author.
GL was responsible for overall project supervision, conceptualization, data curation, and project management; DX, GL, and MC contributed to methodology development, conducted validation, and contributed to the writing of early drafts and final draft review and editing; CC, LX, FM, HL, and WZ were instrumental in formal analysis of data.
This work is supported by the Fund for the National Natural Science Foundation of China (No. 52070021) and the 111 Project (No. B17005).
The authors declare that the research was conducted in the absence of any commercial or financial relationships that could be construed as a potential conflict of interest.
All claims expressed in this article are solely those of the authors and do not necessarily represent those of their affiliated organizations, or those of the publisher, the editors and the reviewers. Any product that may be evaluated in this article, or claim that may be made by its manufacturer, is not guaranteed or endorsed by the publisher.
The Supplementary Material for this article can be found online at: https://www.frontiersin.org/articles/10.3389/fenrg.2022.842061/full#supplementary-material
AECE, Aggregate embodied carbon emission; RC, Rural consumption; UC, Urban consumption; GC, Government consumption; GF, Gross fixed capital formation; IR, Inventory increase; EX, Exports; CI, Carbon intensity; LF, Input-output structure; FS, Final use structure; TF, Total final use.
Cansino, J. M., Román, R., and Ordóñez, M. (2016). Main Drivers of Changes in CO2 Emissions in the Spanish Economy: A Structural Decomposition Analysis. Energy Policy 89, 150–159. doi:10.1016/j.enpol.2015.11.020
Chen, Q., Su, M., Meng, F., Liu, Y., Cai, Y., Zhou, Y., et al. (2020). Analysis of Urban Carbon Metabolism Characteristics Based on Provincial Input-Output Tables. J. Environ. Manage. 265, 110561. doi:10.1016/j.jenvman.2020.110561
Dietzenbacher, E., and Los, B. (1998). Structural Decomposition Techniques: Sense and Sensitivity. Econ. Syst. Res. 10 (4), 307–324. doi:10.1080/09535319800000023
Duan, C., Chen, B., Feng, K., Liu, Z., Hayat, T., Alsaedi, A., et al. (2018). Interregional Carbon Flows of China. Appl. Energ. 227, 342–352. doi:10.1016/j.apenergy.2018.01.028
Ehrlich, P. R., and Holdren, J. P. (1971). Impact of Population Growth. Science 171 (3977), 1212–1217. doi:10.1126/science.171.3977.1212
Fang, D., and Chen, B. (2019). Information-based Ecological Network Analysis for Carbon Emissions. Appl. Energ. 238, 45–53. doi:10.1016/j.apenergy.2019.01.066
Gao, P., Yue, S. J., and Chen, H. T. (2021). Carbon Emission Efficiency of China's Industry Sectors: From the Perspective of Embodied Carbon Emissions. J. Clean. Prod. 283, 124655. doi:10.1016/j.jclepro.2020.124655
Gong, P. Q., Tang, B. J., Xiao, Y. C., Lin, G. J., and Liu, J. Y. (2016). Research on China export Structure Adjustment: an Embodied Carbon Perspective. Nat. Hazards 84, S129–S151. doi:10.1007/s11069-015-1948-7
Guan, Y., Huang, G., Liu, L., Huang, C. Z., and Zhai, M. (2019). Ecological Network Analysis for an Industrial Solid Waste Metabolism System. Environ. Pollut. 244, 279–287. doi:10.1016/j.envpol.2018.10.052
Hoekstra, R., and van den Bergh, J. C. J. M. (2003). Comparing Structural Decomposition Analysis and index. Energ. Econ. 25 (1), 39–64. doi:10.1016/s0140-9883(02)00059-2
Huang, R., Chen, G. W., Lv, G. N., Malik, A., Shi, X. P., and Xie, X. T. (2020). The Effect of Technology Spillover on CO2 Emissions Embodied in China-Australia Trade. Energy Policy 144, 111544. doi:10.1016/j.enpol.2020.111544
Kayacetin, N. C., and Tanyer, A. M. (2020). Embodied Carbon Assessment of Residential Housing at Urban Scale. Renew. Sust. Energ. Rev. 117, 109470. doi:10.1016/j.rser.2019.109470
Li, H., Luo, Z. X., Xu, X. D., Cang, Y. J., and Yang, L. (2021a). Assessing the Embodied Carbon Reduction Potential of Straw Bale Rural Houses by Hybrid Life Cycle Assessment: A Four-Case Study. J. Clean. Prod. 303, 127002. doi:10.1016/j.jclepro.2021.127002
Li, Q., Wu, S., Lei, Y., Li, S., and Li, L. (2021b). Evolutionary Path and Driving Forces of Inter-industry Transfer of CO2 Emissions in China: Evidence from Structural Path and Decomposition Analysis. Sci. Total Environ. 765, 142773. doi:10.1016/j.scitotenv.2020.142773
Li, Y. M., Li, T. T., and Lu, S. S. (2021c). Forecast of Urban Traffic Carbon Emission and Analysis of Influencing Factors. Energy Efficiency 14 (8), 84. doi:10.1007/s12053-021-10001-0
Ma, J.-J., Du, G., and Xie, B.-C. (2019). CO2 Emission Changes of China's Power Generation System: Input-Output Subsystem Analysis. Energy Policy 124, 1–12. doi:10.1016/j.enpol.2018.09.030
Shao, L., Li, Y., Feng, K., Meng, J., Shan, Y., and Guan, D. (2018). Carbon Emission Imbalances and the Structural Paths of Chinese Regions. Appl. Energ. 215, 396–404. doi:10.1016/j.apenergy.2018.01.090
Shi, Q., Chen, J., and Shen, L. (2017). Driving Factors of the Changes in the Carbon Emissions in the Chinese Construction Industry. J. Clean. Prod. 166, 615–627. doi:10.1016/j.jclepro.2017.08.056
Shi, J., Li, H., An, H., Guan, J., and Arif, A. (2019). Tracing Carbon Emissions Embodied in 2012 Chinese Supply Chains. J. Clean. Prod. 226, 28–36. doi:10.1016/j.jclepro.2019.04.015
Su, B., and Ang, B. W. (2012). Structural Decomposition Analysis Applied to Energy and Emissions: Some Methodological Developments. Energ. Econ. 34 (1), 177–188. doi:10.1016/j.eneco.2011.10.009
Tian, Y., Xiong, S., Ma, X., and Ji, J. (2018). Structural Path Decomposition of Carbon Emission: A Study of China's Manufacturing Industry. J. Clean. Prod. 193, 563–574. doi:10.1016/j.jclepro.2018.05.047
Vukic, L., Mikulic, D., and Kecek, D. (2021). The Impact of Transportation on the Croatian Economy: The Input-Output Approach. Economies 9 (1), 7. doi:10.3390/economies9010007
Wang, C., Wang, F., Zhang, X., and Deng, H. (2017a). Analysis of Influence Mechanism of Energy-Related Carbon Emissions in Guangdong: Evidence from Regional China Based on the Input-Output and Structural Decomposition Analysis. Environ. Sci. Pollut. Res. 24 (32), 25190–25203. doi:10.1007/s11356-017-0114-z
Wang, H., Ang, B. W., and Su, B. (2017b). Assessing Drivers of Economy-wide Energy Use and Emissions: IDA versus SDA. Energy Policy 107, 585–599. doi:10.1016/j.enpol.2017.05.034
Wang, Z., Wei, L., Niu, B., Liu, Y., and Bin, G. (2017c). Controlling Embedded Carbon Emissions of Sectors along the Supply Chains: A Perspective of the Power-Of-Pull Approach. Appl. Energ. 206, 1544–1551. doi:10.1016/j.apenergy.2017.09.108
Wang, X. J., Zhang, Y., and Yu, X. Y. (2019). Characteristics of Tianjin's Material Metabolism from the Perspective of Ecological Network Analysis. J. Clean. Prod. 239, 118115. doi:10.1016/j.jclepro.2019.118115
Wei, J., Huang, K., Yang, S., Li, Y., Hu, T., and Zhang, Y. (2017). Driving Forces Analysis of Energy-Related Carbon Dioxide (CO 2 ) Emissions in Beijing: an Input-Output Structural Decomposition Analysis. J. Clean. Prod. 163, 58–68. doi:10.1016/j.jclepro.2016.05.086
Wei, W., Hao, S., Yao, M., Chen, W., Wang, S., Wang, Z., et al. (2020). Unbalanced Economic Benefits and the Electricity-Related Carbon Emissions Embodied in China's Interprovincial Trade. J. Environ. Manage. 263, 110390. doi:10.1016/j.jenvman.2020.110390
Wood, R., and Lenzen, M. (2009). Structural Path Decomposition. Energ. Econ. 31 (3), 335–341. doi:10.1016/j.eneco.2008.11.003
Wu, B., Zeng, W., Chen, H., and Zhao, Y. (2016). Grey Water Footprint Combined with Ecological Network Analysis for Assessing Regional Water Quality Metabolism. J. Clean. Prod. 112, 3138–3151. doi:10.1016/j.jclepro.2015.11.009
Xie, P., Gao, S., and Sun, F. (2019). An Analysis of the Decoupling Relationship between CO2 Emission in Power Industry and GDP in China Based on LMDI Method. J. Clean. Prod. 211, 598–606. doi:10.1016/j.jclepro.2018.11.212
Xu, J.-H., Fleiter, T., Eichhammer, W., and Fan, Y. (2012). Energy Consumption and CO2 Emissions in China's Cement Industry: A Perspective from LMDI Decomposition Analysis. Energy Policy 50, 821–832. doi:10.1016/j.enpol.2012.08.038
Yang, J., Cai, W., Ma, M. D., Li, L., Liu, C. H., Ma, X., et al. (2020a). Driving Forces of China's CO2 Emissions from Energy Consumption Based on Kaya-LMDI Methods. Sci. Total Environ. 711, 134569. doi:10.1016/j.scitotenv.2019.134569
Yang, L., Li, L., Zhu, K., Xie, R., and Wang, Z. (2020b). Structural Path Analysis of China's Coal Consumption Using Input-Output Frameworks. Environ. Sci. Pollut. Res. 27 (7), 6796–6812. doi:10.1007/s11356-019-07176-6
York, R., Rosa, E. A., and Dietz, T. (2002). Bridging Environmental Science with Environmental Policy: Plasticity of Population, Affluence, and Technology. Social Sci. Q 83 (1), 18–34. doi:10.1111/1540-6237.00068
Zhang, Y., Yang, Z., Fath, B. D., and Li, S. (2010). Ecological Network Analysis of an Urban Energy Metabolic System: Model Development, and a Case Study of Four Chinese Cities. Ecol. Model. 221 (16), 1865–1879. doi:10.1016/j.ecolmodel.2010.05.006
Zhang, Y., Li, Y., Hubacek, K., Tian, X., and Lu, Z. (2019). Analysis of CO2 Transfer Processes Involved in Global Trade Based on Ecological Network Analysis. Appl. Energ. 233-234, 576–583. doi:10.1016/j.apenergy.2018.10.051
Zhao, Y. H., Cao, Y., Shi, X. P., Wang, S., Yang, H., Shi, L., et al. (2021). Critical Transmission Paths and Nodes of Carbon Emissions in Electricity Supply Chain. Sci. Total Environ. 755, 142530. doi:10.1016/j.scitotenv.2020.142530
Zheng, H., Li, A., Meng, F., Liu, G., Hu, Y., Zhang, Y., et al. (2021). Ecological Network Analysis of Carbon Emissions from Four Chinese Metropoles in Multiscale Economies. J. Clean. Prod. 279, 123226. doi:10.1016/j.jclepro.2020.123226
Keywords: China, aggregate embodied carbon emission, structural path decomposition, transmission path, low-carbon building materials
Citation: Xu D, Liu G, Xu L, Chen C, Meng F, Li H, Zhang W and Casazza M (2022) Critical Transmission Paths of Aggregate Embodied Carbon Emission Influencing Factors in China. Front. Energy Res. 10:842061. doi: 10.3389/fenrg.2022.842061
Received: 23 December 2021; Accepted: 28 January 2022;
Published: 04 March 2022.
Edited by:
Xiangping Hu, Norwegian University of Science and Technology, NorwayCopyright © 2022 Xu, Liu, Xu, Chen, Meng, Li, Zhang and Casazza. This is an open-access article distributed under the terms of the Creative Commons Attribution License (CC BY). The use, distribution or reproduction in other forums is permitted, provided the original author(s) and the copyright owner(s) are credited and that the original publication in this journal is cited, in accordance with accepted academic practice. No use, distribution or reproduction is permitted which does not comply with these terms.
*Correspondence: Gengyuan Liu, bGl1Z2VuZ3l1YW5AYm51LmVkdS5jbg==
Disclaimer: All claims expressed in this article are solely those of the authors and do not necessarily represent those of their affiliated organizations, or those of the publisher, the editors and the reviewers. Any product that may be evaluated in this article or claim that may be made by its manufacturer is not guaranteed or endorsed by the publisher.
Research integrity at Frontiers
Learn more about the work of our research integrity team to safeguard the quality of each article we publish.