 Dylan S. Cousins1
 William G. Otto1Asif Hasan Rony2Kristian P. Pedersen1John E. Aston2
 David B. Hodge1,3*
- 1Department of Chemical and Biological Engineering, Montana State University, Bozeman, MT, United States
- 2Idaho National Laboratory, Idaho Falls, ID, United States
- 3Division of Sustainable Process Engineering, Luleå University of Technology, Luleå, Sweden
Feedstock heterogeneity is a key challenge impacting the deconstruction and conversion of herbaceous lignocellulosic biomass to biobased fuels, chemicals, and materials. Upstream processing to homogenize biomass feedstock streams into their anatomical components via air classification allows for a more tailored approach to subsequent mechanical and chemical processing. Here, we show that differing corn stover anatomical tissues respond differently to pretreatment and enzymatic hydrolysis and therefore, a one-size-fits-all approach to chemical processing biomass is inappropriate. To inform on-line downstream processing, a robust and high-throughput analytical technique is needed to quantitatively characterize the separated biomass. Predictive correlation of near-infrared spectra to biomass chemical composition is such a technique. Here, we demonstrate the capability of models developed using an “off-the-shelf,” industrially relevant spectrometer with limited spectral range to make strong predictions of both cell wall chemical composition and the relative abundance of anatomical components of the corn stover, the latter for the first time ever. Gaussian process regression (GPR) yields stronger correlations (average R2v = 88% for chemical composition and 95% for anatomical relative abundance) than the more commonly used partial least squares (PLS) regression (average R2v = 84% for chemical composition and 92% for anatomical relative abundance). In nearly all cases, both GPR and PLS outperform models generated using neural networks. These results highlight the potential for coupling NIRS with predictive models based on GPR due to the potential to yield more robust correlations.
Introduction
Lignocellulosic biomass offers enormous potential as a renewable feedstock for biorefining processes that can yield sustainable fuels, chemicals, and materials (Sharma et al., 2020). A wide range of technological approaches are available for biorefining of lignocellulose that include thermochemical, catalytic, chemical, and biological processes for deconstruction and conversion of the cell wall biopolymers contained within lignocellulose to these bio-based fuels and products (Brown and Brown, 2013; Qureshi et al., 2014). One approach for biorefining of lignocellulosic biomass involves a chemical pretreatment to facilitate the subsequent depolymerization of plant cell wall polysaccharides using cellulolytic enzymes to yield monosaccharides that can be further processed to biofuels or biobased chemicals (Kumar et al., 2016). Additional pre-processing operations on the biomass may be necessary to facilitate optimal storage, transport, and processing of heterogeneous, geographically dispersed biomass feedstocks. These feedstock pre-processing operations can include comminution, cleaning, physical or chemical fractionation, drying, pretreatment, and densification (Carolan et al., 2007; Lamers et al., 2015).
Corn stover is a high-volume co-product of corn production that has been identified as having significant potential for sustainable biofuel production in the U.S. (Langholtz et al., 2016). Importantly, corn stover, like other gramineous feedstocks for biorefining processes, exhibits significant within-plant heterogeneity as a consequence of the differences in the cell wall composition and higher order structures between different cell types, tissues, or anatomical fractions (e.g., cob, leaf, husk, stem). In addition to this heterogeneity, variability within a single feedstock can arise from differences in feedstock biological origin, agronomic practices, local environment during growth, harvest time and approach, and biomass storage time and conditions (Morrison et al., 1998).
Feedstock variability resulting from differences in chemical composition and physical properties can significantly impact process performance during both pre-processing and downstream biorefining operations. Moreover, differences in the physical properties of individual corn stover particles are largely derived from anatomical differences in the tissues. Such differences can impact the mechanical handling of biomass, have been shown to contribute to process upsets and can be detrimental to overall process throughput (Sievers et al., 2020). Since different anatomical tissues respond differently to both pre-processing (e.g., comminution) and deconstruction (e.g., chemical pretreatment and enzymatic hydrolysis), on-line knowledge of the tissue type, composition, and moisture content could prove to be a fundamental requirement for commercial-scale biorefineries (Garlock et al., 2009; Crowe et al., 2017; Li et al., 2018). To this end, a high-throughput analytical technique that is potentially deployable as an on-line measurement, would be needed to inform not only the feedstock chemical composition, but also anatomical relative abundance for a given sample of corn stover.
A suite of laboratory analysis procedures developed by the National Renewable Energy Laboratory (NREL) have become the de facto analysis techniques to determine the composition of both feedstocks and pretreated biomass slurries (Sluiter and Sluiter, 2011a; b). However, the wet laboratory procedures for these techniques are time consuming and expensive (Lupoi et al., 2014; Sykes et al., 2015). Therefore, near-infrared (NIR) spectroscopy (NIRS) has become widely used to characterize the composition of biomass (Xu et al., 2013). Predictions of cell wall composition via NIRS have been developed for corn stover (Hames et al., 2003; Templeton et al., 2009), pretreated corn stover (Wolfrum and Sluiter, 2009; Sluiter and Wolfrum, 2013), sorghum (Wolfrum et al., 2013; Li et al., 2017a), switchgrass (Vogel et al., 2011; Park et al., 2012), poplar (Robinson and Mansfield, 2009; Nkansah et al., 2010) and cereal grains (Bruno-Soares et al., 1998; Caporaso et al., 2018). However, cell wall composition alone cannot predict other physical properties of the feedstock, yet this information would benefit biomass processing. Therefore, a principal objective of the present work is to demonstrate the predictive capability of NIRS for not only cell wall composition in corn stover, but also feedstock anatomical origin (e.g., husk, cob, or stalk rind) that greatly impacts both response to mechanical operations (e.g., comminution and feeding) and subsequent biorefining operations.
NIRS gained widespread use in the food industry in the 1980s due to advancement in chemometric techniques to correlate convoluted absorbance peaks to the chemical composition of the analytes using various mathematical tools like principal component analysis (PCA) and partial least squares (PLS) regression (Scotter, 1990). NIR is a commonly used technology for quality control in grain processing facilities (Gradenecker, 2003) as well as crude protein content in livestock forage and feeds (Vincent and Dardenne, 2021). Early work on analysis of biomass energy feedstocks showed the viability of NIRS with PLS to accurately predict corn stover cell wall composition (glucan, xylan, lignin, acetate, and ash) (Sanderson et al., 1996; Gao et al., 2018). Quantification of cell wall composition by NIRS demonstrated varying polysaccharide levels of anatomical fractions of corn stover (Ye et al., 2008) and differences between feedstock corn stover and that pretreated with dilute sulfuric acid (Wolfrum and Sluiter, 2009). Further work at NREL demonstrated a large variation in the cell wall composition of corn stover from various harvests as predicted by NIRS (Templeton et al., 2009). Lately, the same group has demonstrated that potentially low-cost and portable spectrometers with limited spectral range provide predictions that are nearly as accurate as those of well-developed laboratory instruments (Wolfrum et al., 2020). Here, we demonstrate that a comparable “off the shelf” instrument is adequate to predict not only composition, but further extend the predictive capability to anatomical tissue type.
Various chemometric tools have been implemented to make predictions of chemical composition from NIR spectra with PLS being the most common technique. Neural networks (NNs) (Li X. et al., 2015; Jin et al., 2017; Ahmed et al., 2019), support vector machines (SVMs) (Balabin and Lomakina, 2011) and Gaussian process regression (GPR) have also been applied to NIR spectra to predict the moisture content of biomass. GPR is commonly used to predict biomass properties in remote sensing but lacks any significant use in NIRS predictions of biomass properties (Hultquist et al., 2014). In this work, we investigate the efficacy of PLS, GRP, and NN for prediction of chemical composition and anatomical abundance in corn stover.
Air classification is a preprocessing technique of great interest that separates corn stover based on differences in density and surface area (Bilanski and Lai, 1965; Stessel Richard and Peirce, 1983; Lacey et al., 2015). These physical characteristics differ within the anatomical tissue types of corn stover. Additionally, since chemical composition varies with anatomy, we aim to demonstrate that models developed from NIRS can predict not only chemical composition of fractionated biomass, but also the relative abundance of tissue type. The utility of this technique is two-fold: 1) from an experimental perspective, NIRS is a high-throughput tool to validate air classification during process development and 2) in an applied setting, NIRS can inform downstream processes about the relative abundance of incoming corn stover (i.e., “stringy” with many husks vs. more “chip-like” with many stalk rinds and cobs). In the present work, we compare the predictive capabilities of NIRS by traditional PLS methods then explore the use of GPR and NNs to expand the state-of-the-art. Further, we demonstrate that NIRS can provide reliable predictions for not only composition, but also a further level of abstraction to anatomical tissue type.
Experimental
Materials
A diverse range of corn stover samples were used in the present study. Corn stover diversity panel samples were the same as those described in previous work (Li et al., 2017b). Briefly, the maize was grown at a different density and plants were harvested at grain maturity using a single pass, Case IH® 2144 axial-flow, combine for better separation of corn stover and grain. The samples for NIR scanning were taken from a commercial hybrid corn stover bale harvested on 28 October 2017 from Story, Iowa using an AGCO 2270 XD Large Square Baler (Duluth, Georgia) set to a 4-inch cut. The bales were sent to Iowa State University for storage under dry, stable conditions until 24 October 2019, when they were delivered to Idaho National Laboratory (INL). At INL, they continued to be stored under dry (moisture content 8.7 to 9.7 wt%), stable conditions until use.
Methods
Sample Preparation
To generate manually sorted anatomical fractions, 50 kg of flakes from the end sections of unprocessed, square corn stover bales was set aside. As detailed in Figure 1, the plant fractions of corn stover isolated consisted of leaf, sheath, stalk, pith, husk, shank, and cob. However, shank was not investigated in this study due to lower occurrence and similarity with the stalk fraction. The leaf fraction (Figure 1E) is often pulverized during the baling process and will usually be found in smaller pieces and fines. They are darker than most other tissues with a thick mid-rib. Husks (Figure 1G) are broad, thin tissues, lighter in color than the leaves, and do not fracture during the baling process. The sheath (Figure 1D) is usually found attached to the stalk. This is a thick, waxy, rigid tissue that must be broken off the stalk to collect. The stalk (Figure 1C) is long and usually cylindrical and consists of a rigid outer layer (rind), and spongy inner tissue (pith). The shank (Figure 1H) is a branch-like structure that grows out from a leaf node and it is from this shank that an ear of corn will grow. Cobs (Figure 1B) are usually found in larger pieces and have a “fuzzy” outer layer (beeswing/chaff) and contain pith inside a rigid ring of tissue (woody ring).
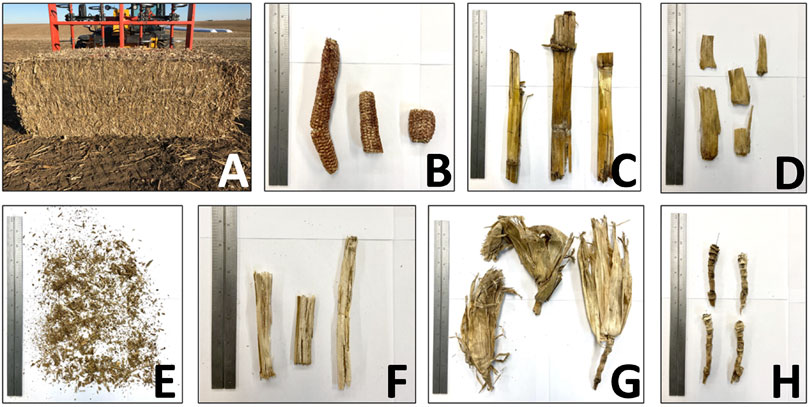
FIGURE 1. Images of the harvested corn stover and respective plant fractions of interest for further isolation. These include (A) the corn stover rectangular bale as harvested, (B) cob, (C) stalk, (D) sheath, (E) leaf fractions pulverized during harvesting operations, (F) pith isolated from stalk fractions, (G) is the husk with attached shank, and (H) isolated shank found attached to the stalk and husk plant fractions.
To further separate and isolate 25 g for subsequent testing of each anatomical fraction, 50 kg of the whole stover was slowly removed and manually sorted to provide a near-pure baseline of the different anatomical fractions. The larger plant fractions were isolated to control mass loss and minimize variance in overall anatomical composition of the unprocessed bale. To isolate 25 g of pith (Figure 1F), the tissue was scraped off the rind portion and reviewed for purity of anatomy. The cobs were mostly unattached to the husk and stalk from harvest operations and are the densest of the fractions, making manual separation quickly identifiable. The husks identified in Figure 1G tend to segregate from the other plant fractions and were hand-picked off the remaining unprocessed material. The shanks were pulled from the broad husk portion of the plant and separated as seen in Figure 1H. To ensure purity and integrity of the leaf isolation, the darker and scattered pieces were gently brushed from the collapsed section of the bale. Any contaminates such as twine, plastic, and metal objects were identified and removed.
Composition analysis was conducted on both alkaline pretreated (see Section 2.2.2) and raw milled (#20 standard mesh, 0.85 mm) pure anatomical fractions (sheath, leaf, pith, husk, rind, and cob) of corn stover to determine structural polysaccharides, lignin, extractive, and ash content according to NREL/TP-510-42618 and 510-48087 with modifications as reported in our prior work (Sluiter et al., 2008; Sluiter and Sluiter, 2011a; Templeton et al., 2016; Singh et al., 2019). For composition analysis of pure tissues, several dozen pieces of a given tissue were milled and placed into a sealed bag. These were mixed by shaking and subsequently, aliquots of the mixture were taken for composition analysis which was done in triplicate. Supplementary Table S2 provides summary data for samples used for prediction of chemical composition and Supplementary Table S5 gives complete composition information for all samples used for NIR modeling.
To generate anatomical tissues with varying moisture content to enhance predictive models, samples of unmilled anatomical fractions were hydrated at varying relative humidity. To achieve different relative humidity, samples were equilibrated in five separate sealed containers containing saturated aqueous solutions of various ionic compounds in the bottom of the container. These compounds govern the water activity, and therefore, relative humidity. By varying the species of the ionic compound, the relative humidity can be altered to cover a wide range. Samples were allowed to equilibrate for at least 72 h and until the mass change due to moisture uptake no longer increased (maximum 96 h). Supplementary Table S1 provides the salts and associated relative humidity used for moisture sorption experiments (Greenspan, 1977). Supplementary Table S3 provides the associated moisture content of anatomical tissues that were equilibrated at varying relative humidity.
Alkaline Pretreatment
Anatomical tissues milled to #20 standard mesh using a benchtop Wiley mill were separately treated in an aqueous alkaline solution at 10% solids (w/v) with 10% sodium hydroxide (w/w) on a 3 g dry biomass basis in a 100 ml AMAR reactor. The vessel was continuously stirred at 200 rpm and temperature was ramped to 90°C over the course of 20 min where it was then held for an additional 60 min and then cooled to room temperature over the course of 10 min. The biomass was then vacuum filtered and washed with DI water until the effluent was of neutral pH. Prior to enzymatic hydrolysis, the pH was adjusted to 5 by adding the biomass to 300 ml of water and titrating with sulfuric acid. Pretreated samples were then vacuum filtered and stored in this moist state in a sealable polyethylene bag at 4°C until further use. Supplementary Table S4 presents the moisture content during storage of these materials.
Enzymatic Hydrolysis
Enzymatic hydrolysis was performed on both raw and pretreated samples according to the procedure described by Yuan et al (Yuan et al., 2019). Briefly, pure anatomical tissues of corn stover (sheath, leaf, stalk pith, husk, stalk rind, and cob) were milled to pass a 20-mesh screen using a Wiley mini-mill (Thomas Scientific, Swedesboro, NJ). Hydrolysis was carried out in 15-ml centrifuge tubes at 10% (w/v) solids loading with 15 mg CTec3 enzyme per g of glucan buffered using a 50 mM sodium citrate buffer (pH 5) in a rotating incubator (198° of rotation) at 60 rpm for 72 h at 50°C. Glucose yields were determined by diluting the hydrolysis liquor ten-fold and measuring the concentration on an Agilent 1260 series HPLC equipped with an Aminex HPX-87H column (Bio-Rad, Hercules, CA) using 5 mM aqueous H2SO4 as the mobile phase coupled with RI detection. Hydrolysis yields are given in terms of percent of maximum theoretical glucose produced. Enzymatic hydrolysis was conducted on both raw and alkaline pretreated samples. Pretreated samples were used for enzymatic hydrolysis no more than 5 days after pretreatment to limit microbial growth.
Spectra Acquisition
NIR spectra were collected on a Foss InfraXact 7,500 non-contact spectrometer over wavelengths from 570 to 1850 nm in reflectance with the empty cup (air) serving as a baseline. This is a reduced wavelength range compared to many studies using NIR for chemical composition prediction (typically covering the full NIR range from 800 to 2500 nm), but recent work has confirmed little reduction in model predictive capability when using reduced spectral range (Wolfrum et al., 2020). For correlation of chemical composition (i.e. glucan, xylan, etc.) specimens from the corn stover diversity panel were used in addition to pure fractions that were isolated from the bale described above. In total, there were 62 specimens available for correlation of chemical composition (only 36 for extractives and moisture content). It should be noted that some of these specimens were milled (those from corn stover diversity and ambient humidity anatomical fractions) to #20 standard mesh, while some were not (those tissues that were hydrated at varying relative humidity as previously described).
Milled specimens were added to a cup with a transparent bottom (approximately 2 inches in diameter) to a depth of no less than 1 cm. Specimens were measured over three replicates except for hydrated tissues, for which spectra were collected in duplicate to minimize water loss due to drying. These hydrated tissues were not milled prior to scanning, but all other samples were milled to pass a #20 standard mesh. Specimens were stirred between replicate measurements. Hydrated, unmilled tissues were removed from their sealed containers and duplicate scans were performed quickly to limit moisture desorption from the material, though the samples were briefly mixed between scans. The duration of each scan is approximately 30 s, therefore relatively little time was available for desorption of water during the measurement. Nevertheless, inconsistency due to effects of moisture desorption means that these results should be interpreted for their trends rather than as tabulations of well-defined thermodynamic hydration states.
In general, the anatomical relative abundance of a given sample of corn stover is not explicitly known, therefore, to generate a dataset for calibration of the models, mixtures of pure anatomical fractions which had been previously manually sorted and subsequently milled to pass a #20 standard mesh screen were prepared by “remixing” to obtain samples with known anatomical quantities. These mixtures were at least 3 g in quantity and were thoroughly agitated in sealed plastic bags prior to scanning. Thus, 60 total specimens were combined and scanned to generate the data set for determining anatomical relative abundance.
Modeling
Several techniques were used to process spectra prior to training models for prediction. Standard normal variate (SNV) pretreatment was applied to the absorbance spectra by subtracting the mean of absorbances over all wavelengths for a given observation and normalizing by the standard deviation. In this way, the mean values of all spectra were normalized to zero with a standard deviation of one. The second derivative of the absorbance spectra with respect to wavelength was calculated numerically over the sampling increment of the instrument (2 nm). Another common preprocessing technique is multiplicative scatter correction (MSC) to reduce the effects of scattering and differing path length between measurements (Rinnan et al., 2009). MSC regresses each spectrum to the mean spectrum of the dataset by ordinary least squares, then corrects each spectrum by the regressed linear parameters. The second derivative (2D) of the absorbance spectra is used to achieve higher correlations between the actual and predicted composition values. For all regressed spectra and correlations compared here, SNV, MSC, and the second derivative were applied.
Preliminary model screening was conducted using the Regression Learner Application in MATLAB (release R2021b; MathWorks, Natick, MA), which can quickly screen linear regression, decision trees, known nearest neighbor, SVMs, and GPR. Of these methods, GPR yielded the lowest mean squared error in preliminary screening when predicting both chemical and anatomical composition of corn stover. Therefore, in this work, GPR is compared to more commonly used PLS regression and NNs using MATLAB’s fitrgp, plsregress, and fitrnet functions, respectively. For model testing in each training case, the data were partitioned into training and test data with a 70/30 split for holdout cross-validation. Root-mean-squared-error of validation (RMSEV) and R2v (coefficient of determination of validation) were used to assess model performance on the holdout sets. In the case of the cell wall composition, the RMSE was normalized by the range of the predicted values. For each algorithm, the model was trained 100 times each with a new training/test split. R2v and RMSEV are those for the average of the 100 model runs.
Gaussian processes leverage the expectation that samples with similar predictors will have similar targets. In this case the predictors are the absorbance values at varying wavelengths and the targets are the chemical or anatomical composition. Briefly, the process fits a distribution of functions to the predictors in order to predict a target (e.g., chemical or anatomical composition). The variance of the assumed distribution of functions (prior) is designated by a kernel, which can take various forms. We screened common kernels and found that the rational quadratic form outperformed the Matern 5/2 and 3/2, squared exponential, and exponential kernels as screened by the Regression Learner Application in MATLAB. Therefore, in the fitrgp MATLAB function, the rational quadratic kernel was used to describe the covariance between predictors. All other hyperparameters were held at default settings.
plsregress implements the SIMPLS algorithm developed by de Jong (de Jong, 1993). All default parameters were used for plsregress and the number of components was varied from 1 to 20. The R2v and RMSEV values tabulated for PLS are the maxima and minima over this range of components, respectively. Standard deviations over the 100 model runs were calculated at the number of components that maximized the R2v value or minimized the RMSEV.
NNs trained using fitrnet used Bayesian optimization, with the default NN structure for the function: two fully connected layers with the first having 10 nodes and the second having a single output. The first fully connected layer has a rectified linear unit activation function while the second layer corresponds to the output target. The training iteration limit was set to 1,000 and both the gradient tolerance and the tolerance for the function loss were set to 10−6. Principal component analysis was conducted using the pca function in MATLAB. Default parameters for the function were used (data are centered and singular value decomposition is the algorithm).
Results and Discussion
Composition, Enzymatic Hydrolysis, and Moisture of Corn Stover Anatomical Tissues
While NIRS has been used in a number of studies and applications in the past to predict the composition of corn stover, the three objectives of the present study differentiate this work from the prior literature. The first objective is to identify differences in composition and responses to pretreatment and enzymatic hydrolysis between manually fractionated corn stover anatomical fractions. The second objective is to employ these corn stover samples to develop models for prediction of differences in chemical composition, relative abundance of anatomical fractions, and response to pretreatment and enzymatic hydrolysis using an industrially relevant NIR system with limited spectral range. The final objective is to compare both the utility and performance of three chemometric/machine learning algorithms (PLS, NN, GPR) to make these predictions from the NIR data sets. For correlative models to be useful, the dataset must cover the desired prediction range. To achieve this, we use anatomically pure samples to bound the design space for all samples of corn stover. That is, no mixture of corn stover will have chemical composition (e.g., glucan content) that is greater or lesser than the pure anatomical fractions that have the maximum or minimum chemical content. Corn stover from our previous work was also used to develop correlations of chemical composition (Li et al., 2017b). Table 1 shows the summary composition data for the corn stover samples used in this study and Figure 2A shows the composition for manually sorted anatomical tissues on a dry basis. The range of compositions found here are comparable to other studies (Hames et al., 2003; Templeton et al., 2009).
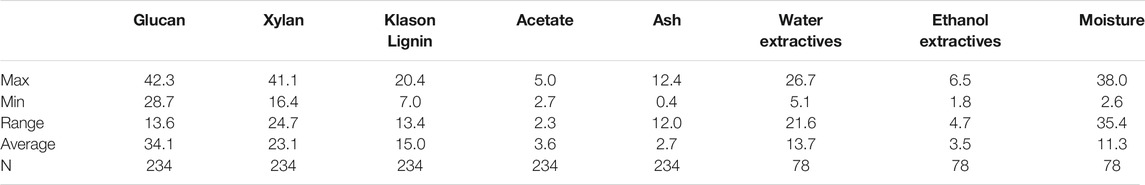
TABLE 1. Summary of composition data for the specimens analyzed in this work. Maximum, minimum, range and average for chemicals are given as wt% on a dry basis. N refers to the number of NIR spectra available for correlation with a given parameter.
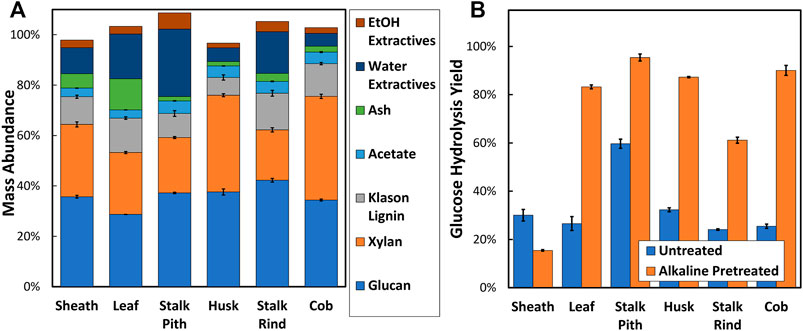
FIGURE 2. (A) Composition of manually sorted anatomical tissues of corn stover on a dry basis and (B) glucose hydrolysis following enzymatic hydrolysis (as % of theoretical maximum) for anatomical tissues of untreated corn stover and those pretreated under alkaline conditions.
Several key differences in composition between the anatomical fractions can be observed within this data (Figure 2A). First, it can be observed that the stalk rind fraction had the highest glucan content (42.3% by mass), which is consistent with other prior work for the stems of graminaceous feedstocks such as corn stover (Li et al., 2012) and Miscanthus × giganteus (Williams et al., 2015). Another key observation is that the cob fraction exhibits the highest xylan content. It is well-established that cobs are more highly enriched in xylan (Takada et al., 2018) and the lower recalcitrance and potential for collection/recovery have made cobs a target feedstock for biorefining (Brown and Brown, 2013). The leaf fraction exhibits the highest ash content and is consistent with prior studies that have found the most abundant ash content in leaf fractions of corn stover (Li et al., 2012) and wheat straw (Atik and Ates, 2012), presumably due to the abundance of structural inorganics such as silicates. A final observation is the low lignin contents observed in stalk pith (9.5%), sheath (11.0%), and husk (7.0%). Low lignin contents for pith has been observed in corn stover (Li et al., 2012) and have been linked to high enzymatic hydrolysis yields in sorghums (Li et al., 2018). Results for the response to enzymatic hydrolysis show significant differences between the six anatomical fractions for both untreated and following pretreatment (Figure 2B). From these results it can be observed that the stalk pith has the highest yield (59.7%) of the untreated anatomical fractions. It has been well-documented that untreated pith from diverse grasses are known to be more susceptible to digestion by rumen microbiota or cellulolytic enzymes due to their lower lignin content (Akin, 2008). Following pretreatment, the leaf, pith, husk, and cob fractions exhibit glucose yields greater than 80%. Leaf, husk, and cob show the most improvement in glucose yields between untreated and pretreated samples, while the sheath is particularly recalcitrant. Since this recalcitrance is fundamentally rooted in cell wall structure and chemical composition, we investigate later whether yields can be correlated to NIR spectra. Because different tissues of corn stover have different responses to pretreatment and hydrolysis, a preprocessing technique that can enrich the process streams in various anatomies would be highly advantageous.
In addition to chemical composition and enzymatic hydrolysis yields, moisture content is a critical parameter affecting both mechanical processes (e.g., comminution, conveying) and (bio)chemical processes (e.g., pretreatment, enzymatic hydrolysis) (Laureano-Perez et al., 2005; Liebmann et al., 2010; Ozaki, 2012; Sievers et al., 2020). Indeed, many processes utilizing materials of biological origin have utilized NIRS for decades to monitor moisture content. Therefore, it is a sensible candidate for prediction; strong correlations for moisture content are expected so it acts as a baseline check for model development. To obtain a range of moisture content across anatomical tissues, unmilled corn stover tissues were equilibrated at varying relative humidity as presented in Supplementary Figure S1. Generally, the moisture content increases rapidly at the end of the moisture sorption curves and the stalk components (rind and pith) demonstrating the greatest hygroscopicity.
Correlation of Spectra to Chemical and Anatomical Composition
The principal focus of this work is to demonstrate that an “off the shelf” NIR spectrometer with limited spectral range (570–1850 nm) can be used to generate predictive models on a relatively small sample set of corn stover. Chemical functional groups govern absorbance of NIR spectra and these groups appear in different quantities in the cell wall biopolymers that make up anatomical tissues. Therefore, chemical composition predictions can be made from the spectral signatures. Predictions of anatomical relative abundance are also rooted in the fact that the varying chemicals absorb IR radiation differently and different tissues have varying quantities of these chemicals. A correlation map was developed (Figure 3) to first identify NIR spectral correlations to the cell wall composition, relative abundance of anatomical fractions, and responses to pretreatment and enzymatic hydrolysis. This plot shows the strength of the Pearson correlation coefficient between these quantities and the second derivative of wavelength absorbance. Red areas indicate negative correlations while green areas indicate positive correlations. The magnitude of the second derivative gives an indication of the degree of concavity in the raw spectra. A larger magnitude of the second derivative in the negative direction corresponds to a more defined absorbance peak in the raw spectra. Positive peaks in the second derivative spectra are often coupled with negative peaks. These coupled peaks are often correlated to chemical composition or anatomical tissues (Figure 3) as transitions from positive to negative correlation (or vice versa). Such transitions are observed at 970 nm, 1,100 nm, and 1,238 nm, among others, and are important for model prediction. Chemical structures (polysaccharides, lignin, etc.) and anatomical tissues that share similar correlation patters are likely to be correlated (e.g., xylan and cob).
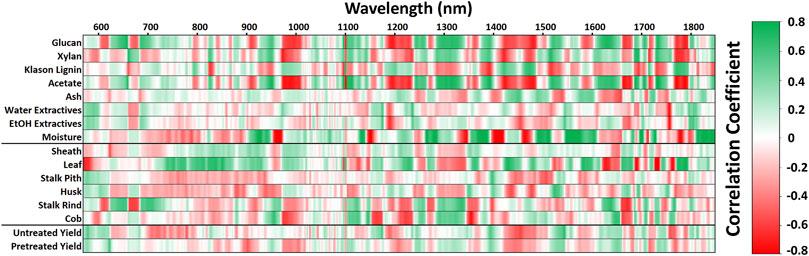
FIGURE 3. Pearson correlation coefficients between NIR absorption from 570 to 1850 nm and corn stover compositional components, relative abundance of anatomical components, and response to pretreatment and enzymatic hydrolysis.
Several key differences within the NIR spectra contributing these correlations can be highlighted (Figure 4). First, starting at the lower end of the spectra, the first peak of interest occurs at 970 nm (Figure 3), where matching correlations between glucan, xylan, acetate, stalk rind, and cob can be observed. This peak is associated with amorphous hydroxyl content (Ahmed et al., 2019) and stronger peak signals are observed for rind and cob compared to other tissues (Figure 4A). These specimens are dried to approximately 5% moisture content so the signal increased hydroxyl absorbance may be due to higher relative abundance of these groups present on polysaccharides. Though weaker than the correlations previously described, lignin and water extractives show similar positive correlations to sheath, leaf, and husk. Because the second derivative of the spectra is negative for wavelengths greater than 970 nm (up to about 1,015 nm), a positive correlation between the absorbance and the chemical composition implies that the relative chemical quantity is decreasing with an increasing absorbance peak.
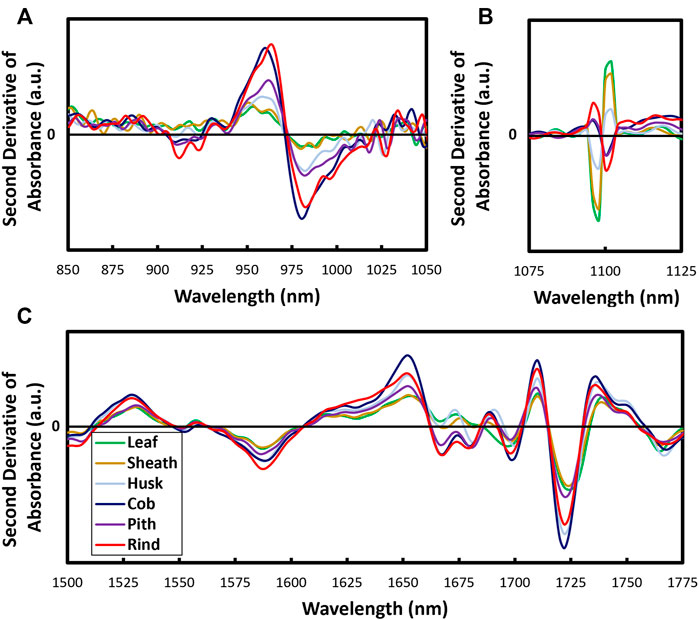
FIGURE 4. Second derivative of NIR absorbance spectra for anatomically pure fractions of corn stover in the region from (A) 850–1,050 nm, (B) 1,075 nm–1,125 nm, and (C) 1,500 nm–1775 nm.
The peak that appears at 1,100 nm (Figure 4B) shows unique properties in that related tissues display similar behavior as the peaks transition from negative to positive. For example, sheath, leaf, and husk group together and have matching correlation patterns to lignin at 1,100 nm (Figure 3). Similarly, stalk rind, stalk pith, and cob group together and have matching correlation patterns to polysaccharides at 1,100 nm (Figure 3). Other reports have also shown positive correlation between absorbance and reference compositions of hemicellulose and cellulose at 1,096 nm and 1,100 nm, respectively, and negative correlation at 1,098 nm for lignin (Jin et al., 2017). The peak at 1,100 nm is one of the only significant peaks observed in this spectrum that shows a segregation of anatomical tissues into positive and negative second derivatives of absorbance.
Prediction of chemical composition is one key component of feedstock quality and can be used to inform pre-processing or downstream pretreatment. Peaks in NIR spectra associated with crystalline cellulose can be observed at 1,592 nm (Figure 4C) for which stalk rind is observed to have the sharpest absorbance (Tsuchikawa et al., 2003). Higher up the spectrum, the segregation of the data into positive and negative peaks at 1,668 nm distinguishes anatomical tissues in a similar way to the peak at 1,100 nm. These two areas appear to be the only two significant wavelengths at which this phenomenon occurs. In previous work, our group has shown guaiacyl lignin to be correlated to a negative peak at 1726 nm (Li et al., 2017b). Previous authors have attributed this peak to pentose sugars (furanose or pyranose) from the presence of hemicellulose (Tsuchikawa et al., 2003). That the xylan-rich cob shows the largest peak is therefore likely attributable to the polysaccharides rather than the guaiacyl lignin in the present case.
Besides the spectra of specific anatomical fractions, it is informative to investigate the spectra for a single anatomical tissue that has been equilibrated at varying relative humidity. Our results show (Figure 5) the effect of moisture sorption on the amorphous hydroxyl band that is associated with wavelengths from 1,350 to 1,450 nm (Henri et al., 2002) for stalk pith that has been equilibrated at varying relative humidity. The band between 1,400 and 1,420 nm is related to the O-H first bending overtone (Gergely and Salgó, 2005). Increased moisture content is observed to lower the wavelength at which radiation is absorbed. In the raw spectra (Supplementary Figure S2), the magnitude of absorbance in this region is also observed to increase with increasing moisture content. At low moisture content, the water molecules can strongly associate with biopolymers through hydrogen bonding but as the moisture content increases, available sites for such interactions are decreased and the spectra becomes more dominated by unbound or amorphous water molecules. The contributions to the absorbance from hydroxyl groups present on the biopolymers are also diminished as the moisture content increases. These subtle shifts in absorbance enable predictive models to be developed from these spectra later in this work.
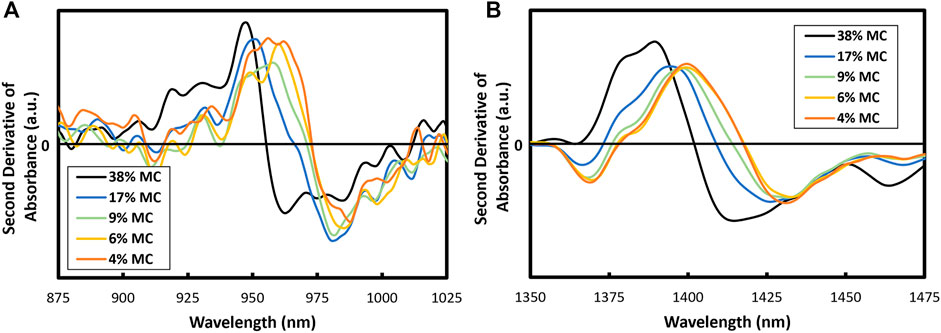
FIGURE 5. Second derivative of NIR absorbance spectra for stalk pith in the range of the amorphous -OH groups at 970 nm (A) and 1,424 nm (B) equilibrated at varying % moisture content (MC).
Of principal interest for the present study is identification of corn stover samples which may be more amenable to subsequent processing. For example, stalk pith requires no pretreatment to achieve the same glucose yields during enzymatic hydrolysis compared to pretreated stalk rind (Figure 2A). Therefore, samples enriched in pith can be targeted in upstream processing and the anatomical composition could be verified by NIR predictive models. Though correlation of chemical components to NIR spectra has been previously shown using PLS, here we also investigate GPR and NN to test whether these can provide more accurate predictions. The chemical components of interest are glucan, xylan, Klason lignin, acetate, ash, water extractives, ethanol extractives, and moisture content.
Use of high throughput screening for determination of biomass composition could be used in various applications within a biorefinery process. Variability of lignocellulosic biomass poses a challenge for scale-up; but on-line NIRS could be used to predict composition, such as glucan, to inform downstream process parameters, such as enzyme loading for hydrolysis. The average R2v value and range-normalized RMSEV (RNRMSEV) between the actual and predicted responses for cell wall composition for models that could inform such predictions are presented in Figure 6 (full data set in Supplementary Tables S8, S9, S14). For PLS, the reported R2v values are those that are the averages of the maximum R2v for any loop over varying number of components in the model (up to 20 components). Supplementary Figure S3 demonstrates how the number of components affects the correlation between the actual and predicted values. Generally, R2v for the correlation plateaus at its maximum value by 10 PLS components.
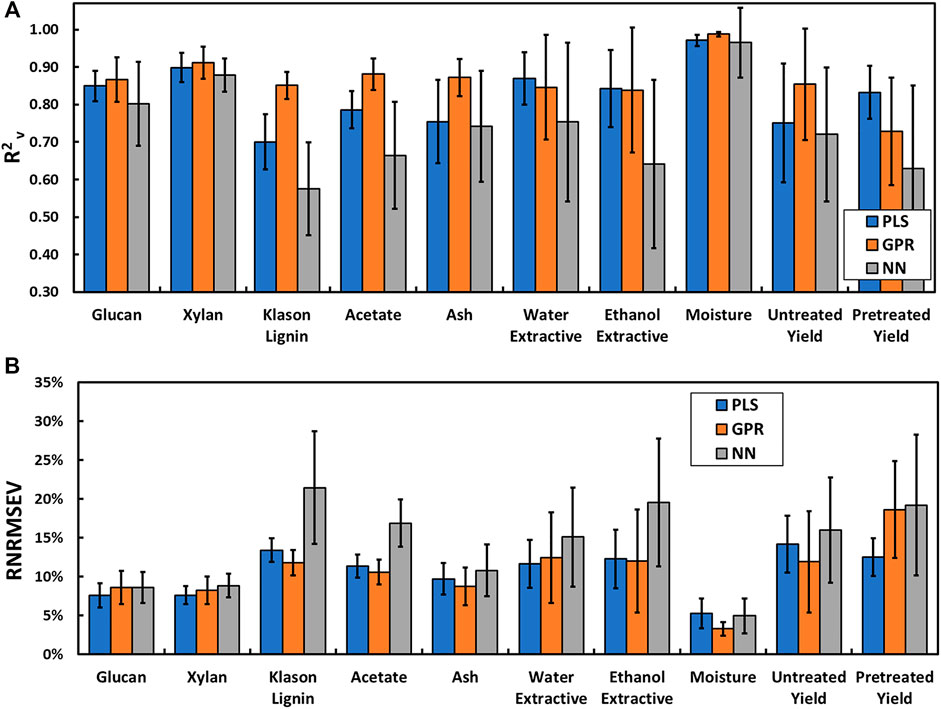
FIGURE 6. R2v (A) and RNRMSEV (B) for chemical composition and response to pretreatment and enzymatic hydrolysis of corn stover predicted from NIR spectra using partial least squares (PLS), Gaussian process regression (GPR) and neural networks (NN). Bars represent standard deviations over 100 model runs. Tabular data are provided in the Supplementary Material.
Of the chemical composition parameters, it is observed that moisture content is the most easily predicted parameter. Indeed, NIR has been used extensively for moisture content prediction (Cozzolino et al., 2013). Well-defined peak shifts associated with increasing moisture content (Figure 5) at 970 and 1,420 nm likely contribute to these strong correlations. Polysaccharides (glucan and xylan) as well as extractives (both ethanol- and water-extractable) show relatively strong correlations between predicted and actual values (R2v > 0.80). In all model cases, xylan is the best-predicted chemical component besides moisture content. Minor components (lignin, acetate and ash) have weaker correlation coefficients. The correlation between actual and predicted values for minor components (lignin, acetate, and ash) are about 10–15% higher for GPR compared to PLS. That these minor components can be well-predicted by GPR is an advancement of the state of the art. Ash can be difficult to correlate due to the fact that the mineral components that make up ash do not directly absorb NIR radiation and only affect the absorbance of proximal functional groups (Gao et al., 2018). This trend can be observed in Figure 3 where ash has comparatively weak correlations when compared to major components like glucan, xylan, and lignin. Nevertheless, even subtle correlations prove useful for predictive modeling as ash content still has a relatively high R2v value (0.87 for GPR).
The first three component loadings from PLS regression show strong positive and negative correlations for both anatomical and compositional components at 1,100 nm (Supplementary Figure S4), which correspond to the behavior of the positive and negative spectral derivatives at that wavelength (Figure 4B). Only a few wavelengths appear to have high or low loadings in the first three PLS components for chemical composition. Interestingly, loadings are extreme in the visible spectra (from 570 nm to about 720 nm). The first PLS component for composition regression also shows a strong loading around 1,394 nm. This pattern is observed for the moisture content present in the biomass samples. Importantly, this transition is slightly lower than those observed for polysaccharides (approximately 1,404 nm) so this may provide an important wavelength to distinguish the difference between hydroxyl content associated with water vs. those associated with polysaccharides that are not well-distinguished at 970 nm. Range-normalized PLS regression coefficients do not have similar patterning between observations (anatomical or chemical composition) (Supplementary Figures S5, S6A,B) unlike the Pearson correlation coefficients of those values.
GPR is able to achieve an R2v of 0.85 for the raw yield from enzymatic hydrolysis and PLS is able to achieve an R2v of 0.83 for the pretreated enzymatic hydrolysis yield. This ability to predict hydrolysis yields of corn stover by spectral analysis of incoming feedstock could be of great utility in an industrial setting. Prior work has employed PLS coupled to NIR to predict in vitro digestibility in corn stover fractionated by anatomy (Hansey et al., 2010) and our previous work for predicted enzymatic hydrolysis yields in corn stover both before and after alkaline pretreatment (Li et al., 2017b). Notably, our previous work was not able to obtain robust prediction models for enzymatic hydrolysis yields following pretreatment.
While composition is useful to inform downstream chemical processing, knowledge of the anatomical tissue type can also inform process operations. Particularly, work from the Integrated Biorefinery Research Facility at NREL showed that certain anatomical types can be problematic for conveyance machinery (Sievers et al., 2020). That work found husk material from corn stover tends to form “bird nests” that can overload rotating equipment and cause large spikes in machinery energy requirements. Foreknowledge of the tissue type and quantity would be advantageous so that material flow or equipment specifications could be altered to prevent process bottlenecks or equipment damage. Moreover, corn stover feedstock quality can be improved via air classification, which separates different anatomical tissues based on surface area and density (Lacey et al., 2016; Thompson et al., 2016). To that end, Figure 7 presents the goodness-of-fit (full data set in Supplementary Tables S11, S12, S13, S15) and RMSEV between actual and predicted model values for the relative abundance of differing anatomical fractions, which has hitherto not been described in the literature, despite instances of anatomical separation used to introduce variation in the cell wall composition to the sample dataset (Pordesimo et al., 2005; Liu et al., 2010; Gao et al., 2018). Prior work found that the first three principal components of NIR spectra of remixed anatomical fractions of Miscanthus × giganteus were able to predict the structural carbohydrate, lignin, and ash content (Williams et al., 2015). However, that work stopped short of making predictions of the anatomical relative abundance of the remixed anatomical samples. Because the dataset for anatomical composition covers the complete range (mass fraction from 0 to 1), the RMSEV does not require normalization. The anatomical relative abundance is well-predicted by all methods with average R2v values of 0.92, 0.95, and 0.89 for PLS, GPR, and NN, respectively.
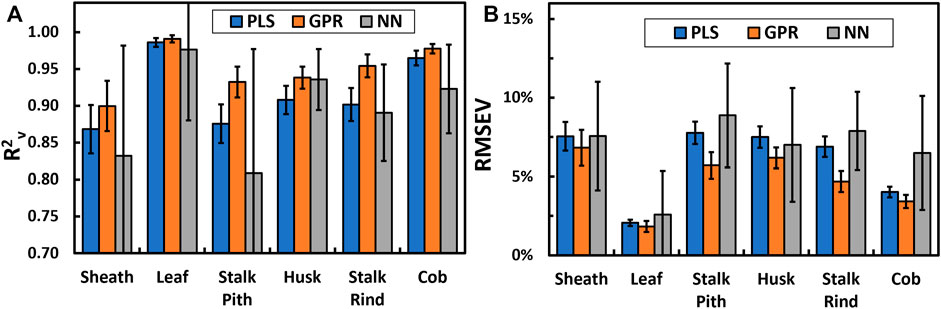
FIGURE 7. R2v (A) and RMSEV (B) for anatomical relative abundance of corn stover predicted by various modeling algorithms. Bars represent standard deviations over 100 model runs. Tabular data are provided in the Supplementary Material.
Because the chemical composition of biomass can be discerned by the principal components of NIR spectra, we applied principal component analysis to the spectra for pure anatomical fractions of corn stover (Figure 8). In this analysis, the first three principal components explained 92.9% of the variance in the NIR spectra. The anatomical fractions are shown to segregate into distinct bundles besides cob and husk which tend to group together. That husk and cob have distinct overlap of their principal component grouping is counterintuitive because their correlations with NIR absorbance are generally opposite (Figure 3).
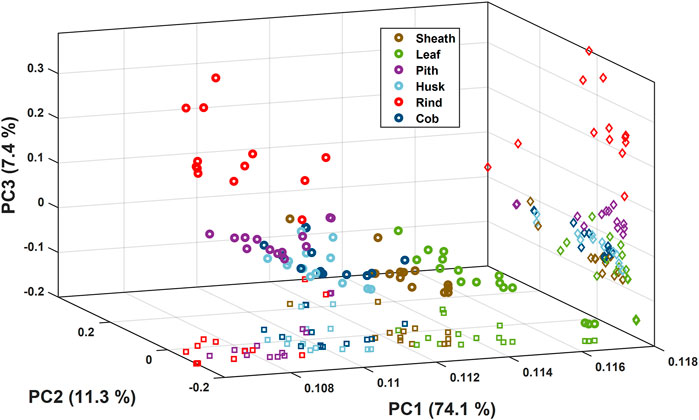
FIGURE 8. First three principal components of the NIR spectra for pure components of corn stover. Circles represent the position in the 3-dimensional space, squares represent the position in the PC1-PC2 plane and diamonds represent the position in the PC2-PC3 plane.
Interestingly, the average correlation coefficient is higher for the anatomical relative abundance predictions than for the composition. Since the anatomical relative abundance can be thought of as another level of abstraction from composition, which governs NIR absorbance, one might expect these parameters to correlate less strongly. Composition analysis of corn stover for this study was conducted at Michigan State University in 2014 for corn stover diversity panel specimens (Li M. et al., 2015) and in 2021 for anatomical fractions at Montana State University. Measurements of chemical composition of biomass can vary by up to 20% between laboratories (Templeton et al., 2016), though other studies found much less error (Templeton et al., 2010). However, the quantity of corn stover anatomical tissues can be accurately and precisely controlled when preparing mixtures. Therefore, the higher correlation coefficient and lower RMSEV for the anatomical relative abundance compared to composition may be due in part to interlaboratory data variance in the composition. Nonetheless, these models still demonstrate utility to predict the chemical and anatomical constituents of corn stover over a relatively small data set. Here, we show that GPR as modeling approach may yield better predictions for both chemical composition and anatomical relative abundance in corn stover, but many different algorithmic approaches and other hyperparameter tuning options exist for each of the three models presented here. It is beyond the scope of this study to investigate these parameters; we aim to demonstrate that GPR is a viable and presently under-investigated modeling technique that should be given more attention in the NIRS community.
Conclusion
In this work, we show for the first time that anatomical relative abundance can be predicted by NIRS models. This has important implications for the biomass processing by adding additional information about the feedstock beyond chemical composition. We demonstrate the stalk pith has the highest glucose hydrolysis yield (60% and 95% of theoretical for untreated and alkaline pretreated, respectively) among anatomical fractions of corn stover. If coupled with a physical fractionation strategy to recover fractions enriched or depleted in select features such as the relative abundance of a target anatomical fraction, those streams can be treated differently to improve overall conversion. Despite the limited spectral range of the spectrometer used in this work, strong correlative models were still developed with a relatively small data set. We show that predictive models from GPR give the strongest correlations for these data; this regression technique should certainly garner more attention in future investigations. Future work will demonstrate the utility of these models on predicting composition, anatomical relative abundance, response to pretreatment, and hydrolysis yields for air-classified fractions of biomass.
Data Availability Statement
The original contributions presented in the study are included in the article/Supplementary Material, further inquiries can be directed to the corresponding author.
Author Contributions
DC developed the design of experiments, prepared and scanned samples, developed and implemented correlative models and wrote the working draft of the manuscript. WO prepared samples and conducted experiments and data analysis for pretreatment and enzymatic hydrolysis. AR prepared manually fractionated anatomical tissues. KP prepared samples and scanned them on the NIR instrument. JA supervised the project and provided critical advice to advance the ideas and methods. DH is the principal investigator and conceived of the project plan, supervised its implementation and provided major edits to the writing.
Funding
This material is based upon work supported by the U.S. Department of Energy’s Office of Energy Efficiency and Renewable Energy (EERE) Bioenergy Technologies Office (BETO) and FOA-0002029 under the Award Number DE-EE0008907 “Enhanced Feedstock Characterization and Modeling to Facilitate Optimal Preprocessing and Deconstruction of Corn Stover”.
Conflict of Interest
The authors declare that the research was conducted in the absence of any commercial or financial relationships that could be construed as a potential conflict of interest.
Publisher’s Note
All claims expressed in this article are solely those of the authors and do not necessarily represent those of their affiliated organizations, or those of the publisher, the editors and the reviewers. Any product that may be evaluated in this article, or claim that may be made by its manufacturer, is not guaranteed or endorsed by the publisher.
Acknowledgments
The authors thank Dr. Al Parker (Department of Mathematical Sciences, Montana State University) for his insightful advice regarding modeling statistics.
Supplementary Material
The Supplementary Material for this article can be found online at: https://www.frontiersin.org/articles/10.3389/fenrg.2022.836690/full#supplementary-material
References
Ahmed, M. U., Andersson, P., Andersson, T., Aparicio, E. T., Baaz, H., Barua, S., et al. (2019). A Machine Learning Approach for Biomass Characterization. Energ. Proced. 158, 1279–1287. doi:10.1016/j.egypro.2019.01.316
Akin, D. E. (2008). Plant Cell wall Aromatics: Influence on Degradation of Biomass. Biofuels, Bioprod. Bioref. 2 (4), 288–303. doi:10.1002/bbb.76
Atik, C., and Ates, S. (2012). Mass Balance of Silica in Straw from the Perspective of Silica Reduction in Straw Pulp. BioResources 7 (3), 3274–3282. doi:10.15376/BIORES.7.3.3274-3282
Balabin, R. M., and Lomakina, E. I. (2011). Support Vector Machine Regression (SVR/LS-SVM)-an Alternative to Neural Networks (ANN) for Analytical Chemistry Comparison of Nonlinear Methods on Near Infrared (NIR) Spectroscopy Data. Analyst 136 (8), 1703–1712. doi:10.1039/C0AN00387E
Bilanski, W. K., and Lai, R. (1965). Behavior of Threshed Materials in a Vertical Wind Tunnel. Trans. ASAE 8 (3), 411–0413. doi:10.13031/2013.40533
Brown, T. R., and Brown, R. C. (2013). A Review of Cellulosic Biofuel Commercial-Scale Projects in the United States. Biofuels, Bioprod. Bioref. 7 (3), 235–245. doi:10.1002/bbb.1387
Bruno-Soares, A. M., Murray, I., Paterson, R. M., and Abreu, J. M. F. (1998). Use of Near Infrared Reflectance Spectroscopy (NIRS) for the Prediction of the Chemical Composition and Nutritional Attributes of green Crop Cereals. Anim. Feed Sci. Tech. 75 (1), 15–25. doi:10.1016/S0377-8401(98)00190-4
Caporaso, N., Whitworth, M. B., and Fisk, I. D. (2018). Near-Infrared Spectroscopy and Hyperspectral Imaging for Non-destructive Quality Assessment of Cereal Grains. Appl. Spectrosc. Rev. 53 (8), 667–687. doi:10.1080/05704928.2018.1425214
Carolan, J. E., Joshi, S. V., and Dale, B. E. (2007). Technical and Financial Feasibility Analysis of Distributed Bioprocessing Using Regional Biomass Pre-processing Centers. J. Agric. Food Ind. Organ. 5 (2), 1203. doi:10.2202/1542-0485.1203
Cozzolino, D., Roumeliotis, S., and Eglinton, J. (2013). Monitoring Water Uptake in Whole Barley (Hordeum vulgare L.) Grain during Steeping Using Near Infrared Reflectance Spectroscopy. J. Food Eng. 114 (4), 545–549. doi:10.1016/j.jfoodeng.2012.09.010
Crowe, J. D., Feringa, N., Pattathil, S., Merritt, B., Foster, C., Dines, D., et al. (2017). Identification of Developmental Stage and Anatomical Fraction Contributions to Cell wall Recalcitrance in Switchgrass. Biotechnol. Biofuels 10 (1), 184. doi:10.1186/s13068-017-0870-5
de Jong, S. (1993). SIMPLS: An Alternative Approach to Partial Least Squares Regression. Chemometrics Intell. Lab. Syst. 18 (3), 251–263. doi:10.1016/0169-7439(93)85002-X
Gao, L., Chen, S., and Zhang, D. (2018). Neural Network Prediction of Corn Stover Saccharification Based on its Structural Features. Biomed. Res. Int. 2018, 9167508. doi:10.1155/2018/9167508
Garlock, R. J., Chundawat, S. P., Balan, V., and Dale, B. E. (2009). Optimizing Harvest of Corn stover Fractions Based on Overall Sugar Yields Following Ammonia Fiber Expansion Pretreatment and Enzymatic Hydrolysis. Biotechnol. Biofuels 2 (1), 29. doi:10.1186/1754-6834-2-29
Gergely, S., and Salgó, A. (2005). Changes in Carbohydrate Content during Wheat Maturation-What Is Measured by Near Infrared Spectroscopy. J. Near Infrared Spectrosc. 13 (1), 9–17. doi:10.1255/jnirs.452
Greenspan, L. (1977). Humidity Fixed Points of Binary Saturated Aqueous Solutions. J. Res. Natl. Bur. Stan. Sect. A. 81A (1), 89–96. doi:10.6028/jres.081a.011
Hames, B. R., Thomas, S. R., Sluiter, A. D., Roth, C. J., and Templeton, D. W. (2003). Rapid Biomass Analysis. Appl. Biochem. Biotechnol. 105 (1), 5–16. doi:10.1385/ABAB10.1007/978-1-4612-0057-4_1
Hansey, C. N., Lorenz, A. J., and de Leon, N. (2010). Cell wall Composition and Ruminant Digestibility of Various Maize Tissues across Development. Bioenerg. Res. 3 (1), 28–37. doi:10.1007/s12155-009-9068-4
Henri, B., Fabrice, D., and Frédérique, H.-P. (2002). Near Infrared Analysis as a Tool for Rapid Screening of Some Major wood Characteristics in a Eucalyptus Breeding Program. Ann. For. Sci. 59 (5-6), 479–490. doi:10.1051/forest.:2002032
Hultquist, C., Chen, G., and Zhao, K. (2014). A Comparison of Gaussian Process Regression, Random Forests and Support Vector Regression for Burn Severity Assessment in Diseased Forests. Remote Sensing Lett. 5 (8), 723–732. doi:10.1080/2150704X.2014.963733
Jin, X., Chen, X., Shi, C., Li, M., Guan, Y., Yu, C. Y., et al. (2017). Determination of Hemicellulose, Cellulose and Lignin Content Using Visible and Near Infrared Spectroscopy in Miscanthus sinensis. Bioresour. Tech. 241, 603–609. doi:10.1016/j.biortech.2017.05.047
Kumar, R., Tabatabaei, M., Karimi, K., and Sárvári Horváth, I. (2016). Recent Updates on Lignocellulosic Biomass Derived Ethanol - A Review. Biofuel Res. J. 3 (1), 347–356. doi:10.18331/BRJ2016.3.1.4
Lacey, J. A., Aston, J. E., Westover, T. L., Cherry, R. S., and Thompson, D. N. (2015). Removal of Introduced Inorganic Content from Chipped Forest Residues via Air Classification. Fuel 160, 265–273. doi:10.1016/j.fuel.2015.07.100
Lacey, J. A., Emerson, R. M., Thompson, D. N., and Westover, T. L. (2016). Ash Reduction Strategies in Corn stover Facilitated by Anatomical and Size Fractionation. Biomass and Bioenergy 90, 173–180. doi:10.1016/j.biombioe.2016.04.006
Lamers, P., Roni, M. S., Tumuluru, J. S., Jacobson, J. J., Cafferty, K. G., Hansen, J. K., et al. (2015). Techno-economic Analysis of Decentralized Biomass Processing Depots. Bioresour. Technol. 194, 205–213. doi:10.1016/j.biortech.2015.07.009
Langholtz, M. H., Stokes, B. J., and Eaton, L. M. (2016). Economic Availability of Feedstock. Oak Ridge National Laboratory, Oak Ridge, Tennessee, Managed by UT-Battelle, LLC for the US Department of Energy. Advancing Domest. Resour. a thriving bioeconomy Vol. 1, 1–411.
Laureano-Perez, L., Teymouri, F., Alizadeh, H., and Dale, B. E. (2005). Understanding Factors that Limit Enzymatic Hydrolysis of Biomass: Characterization of Pretreated Corn stover. Appl. Biochem. Biotechnol. 121-124 (1), 1081–1099. doi:10.1385/ABAB10.1385/abab:124:1-3:1081
Li, M., Heckwolf, M., Crowe, J. D., Williams, D. L., Magee, T. D., Kaeppler, S. M., et al. (2015a). Cell-wall Properties Contributing to Improved Deconstruction by Alkaline Pre-treatment and Enzymatic Hydrolysis in Diverse Maize (Zea mays L.) Lines. J. Exp. Bot. 66 (14), 4305–4315. doi:10.1093/jxb/erv016
Li, M., Wang, J., Du, F., Diallo, B., and Xie, G. H. (2017a). High-throughput Analysis of Chemical Components and Theoretical Ethanol Yield of Dedicated Bioenergy Sorghum Using Dual-Optimized Partial Least Squares Calibration Models. Biotechnol. Biofuels 10 (1), 206. doi:10.1186/s13068-017-0892-z
Li, M., Williams, D. L., Heckwolf, M., de Leon, N., Kaeppler, S., Sykes, R. W., et al. (2017b). Prediction of Cell Wall Properties and Response to Deconstruction Using Alkaline Pretreatment in Diverse Maize Genotypes Using Py-MBMS and NIR. Bioenerg. Res. 10 (2), 329–343. doi:10.1007/s12155-016-9798-z
Li, M., Yan, G., Bhalla, A., Maldonado-Pereira, L., Russell, P. R., Ding, S.-Y., et al. (2018). Physical Fractionation of Sweet Sorghum and Forage/energy Sorghum for Optimal Processing in a Biorefinery. Ind. Crops Prod. 124, 607–616. doi:10.1016/j.indcrop.2018.07.002
Li, X., Sun, C., Zhou, B., and He, Y. (2015b). Determination of Hemicellulose, Cellulose and Lignin in Moso Bamboo by Near Infrared Spectroscopy. Sci. Rep. 5 (1), 17210. doi:10.1038/srep17210
Li, Z., Zhai, H., Zhang, Y., and Yu, L. (2012). Cell Morphology and Chemical Characteristics of Corn stover Fractions. Ind. Crops Prod. 37 (1), 130–136. doi:10.1016/j.indcrop.2011.11.025
Liebmann, B., Friedl, A., and Varmuza, K. (2010). Applicability of Near-Infrared Spectroscopy for Process Monitoring in Bioethanol Production. Biochem. Eng. J. 52 (2), 187–193. doi:10.1016/j.bej.2010.08.006
Liu, L., Ye, X. P., Womac, A. R., and Sokhansanj, S. (2010). Variability of Biomass Chemical Composition and Rapid Analysis Using FT-NIR Techniques. Carbohydr. Polym. 81 (4), 820–829. doi:10.1016/j.carbpol.2010.03.058
Lupoi, J. S., Singh, S., Simmons, B. A., and Henry, R. J. (2014). Assessment of Lignocellulosic Biomass Using Analytical Spectroscopy: an Evolution to High-Throughput Techniques. Bioenerg. Res. 7 (1), 1–23. doi:10.1007/s12155-013-9352-1
Morrison, T. A., Jung, H. G., Buxton, D. R., and Hatfield, R. D. (1998). Cell-Wall Composition of Maize Internodes of Varying Maturity. Crop Sci. 38 (2). doi:10.2135/cropsci1998.0011183X003800020031x
Nkansah, K., Dawson-Andoh, B., and Slahor, J. (2010). Rapid Characterization of Biomass Using Near Infrared Spectroscopy Coupled with Multivariate Data Analysis: Part 1 Yellow-poplar (Liriodendron tulipifera L.). Bioresour. Tech. 101 (12), 4570–4576. doi:10.1016/j.biortech.2009.12.046
Ozaki, Y. (2012). Near-Infrared Spectroscopy-Its Versatility in Analytical Chemistry. Anal. Sci. 28 (6), 545–563. doi:10.2116/analsci.28.545
Park, J. I., Liu, L., Philip Ye, X., Jeong, M. K., and Jeong, Y.-S. (2012). Improved Prediction of Biomass Composition for Switchgrass Using Reproducing Kernel Methods with Wavelet Compressed FT-NIR Spectra. Expert Syst. Appl. 39 (1), 1555–1564. doi:10.1016/j.eswa.2011.05.012
Philip Ye, X., Liu, L., Hayes, D., Womac, A., Hong, K., and Sokhansanj, S. (2008). Fast Classification and Compositional Analysis of Cornstover Fractions Using Fourier Transform Near-Infrared Techniques. Bioresour. Tech. 99 (15), 7323–7332. doi:10.1016/j.biortech.2007.12.063
Pordesimo, L. O., Hames, B. R., Sokhansanj, S., and Edens, W. C. (2005). Variation in Corn stover Composition and Energy Content with Crop Maturity. Biomass and Bioenergy 28 (4), 366–374. doi:10.1016/j.biombioe.2004.09.003
Qureshi, N., Hodge, D., and Vertes, A. (2014). Biorefineries: Integrated Biochemical Processes for Liquid Biofuels Amsterdam: Elsevier.
Rinnan, Å., Berg, F. v. d., and Engelsen, S. B. (2009). Review of the Most Common Pre-processing Techniques for Near-Infrared Spectra. Trac Trends Anal. Chem. 28 (10), 1201–1222. doi:10.1016/j.trac.2009.07.007
Robinson, A. R., and Mansfield, S. D. (2009). Rapid Analysis of poplar Lignin Monomer Composition by a Streamlined Thioacidolysis Procedure and Near-Infrared Reflectance-Based Prediction Modeling. Plant J. 58 (4), 706–714. doi:10.1111/j.1365-313X.2009.03808.x
Sanderson, M. A., Agblevor, F., Collins, M., and Johnson, D. K. (1996). Compositional Analysis of Biomass Feedstocks by Near Infrared Reflectance Spectroscopy. Biomass and Bioenergy 11 (5), 365–370. doi:10.1016/S0961-9534(96)00039-6
Scotter, C. (1990). Use of Near Infrared Spectroscopy in the Food Industry with Particular Reference to its Applications to On/in-Line Food Processes. Food Control 1 (3), 142–149. doi:10.1016/0956-7135(90)90006-X
Sharma, B., Larroche, C., and Dussap, C.-G. (2020). Comprehensive Assessment of 2G Bioethanol Production. Bioresour. Tech. 313, 123630. doi:10.1016/j.biortech.2020.123630
Sievers, D. A., Kuhn, E. M., Thompson, V. S., Yancey, N. A., Hoover, A. N., Resch, M. G., et al. (2020). Throughput, Reliability, and Yields of a Pilot-Scale Conversion Process for Production of Fermentable Sugars from Lignocellulosic Biomass: A Study on Feedstock Ash and Moisture. ACS Sust. Chem. Eng. 8 (4), 2008–2015. doi:10.1021/acssuschemeng.9b06550
Singh, S. K., Savoy, A. W., Yuan, Z., Luo, H., Stahl, S. S., Hegg, E. L., et al. (2019). Integrated Two-Stage Alkaline-Oxidative Pretreatment of Hybrid Poplar. Part 1: Impact of Alkaline Pre-extraction Conditions on Process Performance and Lignin Properties. Ind. Eng. Chem. Res. 58 (35), 15989–15999. doi:10.1021/acs.iecr.9b01124
Sluiter, A. D., Hames, B. R., Ruiz, R., Scarlata, C., Sluiter, J., Templeton, D. W., et al. (2008). Determination of Structural Carbohydrates and Lignin in Biomass. National Renewable Energy Laboratory, Technical Report NREL/TP-510–42618. doi:10.17504/protocols.io.bumtnu6n
Sluiter, A., and Wolfrum, E. (2013). Near Infrared Calibration Models for Pretreated Corn Stover Slurry Solids, Isolated and In Situ. J. Near Infrared Spectrosc. 21 (4), 249–257. doi:10.1255/jnirs.1065
Sluiter, J. B., and Sluiter, A. D. (2011a). Laboratory Analytical Procedure (LAP) Review and Integration. National Renewable Energy Laboratory, Technical Report NREL/TP-510-48087.
Sluiter, J. B., and Sluiter, A. D. (2011b). Summative Mass Closure Laboratory Analytical Procedure (LAP) Review and Integration: Pretreated Slurries. National Renewable Energy Laboratory, Technical Report NREL/TP-510-48825.
Stessel, R. I., and Peirce, J. J. (1983). Pulsed‐Flow Air Classification for Waste‐to‐Energy. J. Energ. Eng. 109 (2), 60–73. doi:10.1061/(ASCE)0733-9402(1983)10910.1061/(asce)0733-9402(1983)109:2(60)
Sykes, R. W., Gjersing, E. L., Doeppke, C. L., and Davis, M. F. (2015). High-Throughput Method for Determining the Sugar Content in Biomass with Pyrolysis Molecular Beam Mass Spectrometry. Bioenerg. Res. 8 (3), 964–972. doi:10.1007/s12155-015-9610-5
Takada, M., Niu, R., Minami, E., and Saka, S. (2018). Characterization of Three Tissue Fractions in Corn (Zea mays) Cob. Biomass and Bioenergy 115, 130–135. doi:10.1016/j.biombioe.2018.04.023
Templeton, D. W., Scarlata, C. J., Sluiter, J. B., and Wolfrum, E. J. (2010). Compositional Analysis of Lignocellulosic Feedstocks. 2. Method Uncertainties. J. Agric. Food Chem. 58 (16), 9054–9062. doi:10.1021/jf100807b
Templeton, D. W., Sluiter, A. D., Hayward, T. K., Hames, B. R., and Thomas, S. R. (2009). Assessing Corn stover Composition and Sources of Variability via NIRS. Cellulose 16 (4), 621–639. doi:10.1007/s10570-009-9325-x
Templeton, D. W., Wolfrum, E. J., Yen, J. H., and Sharpless, K. E. (2016). Compositional Analysis of Biomass Reference Materials: Results from an Interlaboratory Study. Bioenerg. Res. 9 (1), 303–314. doi:10.1007/s12155-015-9675-1
Thompson, V. S., Lacey, J. A., Hartley, D., Jindra, M. A., Aston, J. E., and Thompson, D. N. (2016). Application of Air Classification and Formulation to Manage Feedstock Cost, Quality and Availability for Bioenergy. Fuel 180, 497–505. doi:10.1016/j.fuel.2016.04.040
Tsuchikawa, S., Murata, A., Kohara, M., and Mitsui, K. (2003). Spectroscopic Monitoring of Biomass Modification by Light-Irradiation and Heat Treatment. J. Near Infrared Spectrosc. 11 (5), 401–405. doi:10.1255/jnirs.391
Vincent, B., and Dardenne, P. (2021). Application of NIR in Agriculture. Singapore: Springer, 331–345. doi:10.1007/978-981-15-8648-4_14
Vogel, K. P., Dien, B. S., Jung, H. G., Casler, M. D., Masterson, S. D., and Mitchell, R. B. (2011). Quantifying Actual and Theoretical Ethanol Yields for Switchgrass Strains Using NIRS Analyses. Bioenerg. Res. 4 (2), 96–110. doi:10.1007/s12155-010-9104-4
Williams, D. A., Danao, M.-G. C., Rausch, K. D., Paulsen, M. R., and Singh, V. (2015). Variability in Composition of Individual Botanical Fractions of Miscanthus giganteus and Their Blends. Biofuels 6 (1-2), 63–70. doi:10.1080/17597269.2015.1050641
Wolfrum, E. J., Payne, C., Schwartz, A., Jacobs, J., and Kressin, R. W. (2020). A Performance Comparison of Low-Cost Near-Infrared (NIR) Spectrometers to a Conventional Laboratory Spectrometer for Rapid Biomass Compositional Analysis. Bioenerg. Res. 13 (4), 1121–1129. doi:10.1007/s12155-020-10135-6
Wolfrum, E. J., and Sluiter, A. D. (2009). Improved Multivariate Calibration Models for Corn Stover Feedstock and Dilute-Acid Pretreated Corn stover. Cellulose 16 (4), 567–576. doi:10.1007/s10570-009-9320-2
Wolfrum, E., Payne, C., Stefaniak, T., Rooney, W., Dighe, N., Bean, B., et al. (2013). Multivariate Calibration Models for Sorghum Composition Using Near-Infrared Spectroscopy. National Renewable Energy Laboratory, Technical Report NREL/TP-5100-56838. doi:10.2172/1071953
Xu, F., Yu, J., Tesso, T., Dowell, F., and Wang, D. (2013). Qualitative and Quantitative Analysis of Lignocellulosic Biomass Using Infrared Techniques: A Mini-Review. Appl. Energ. 104, 801–809. doi:10.1016/j.apenergy.2012.12.019
Yuan, Z., Singh, S. K., Bals, B., Hodge, D. B., and Hegg, E. L. (2019). Integrated Two-Stage Alkaline-Oxidative Pretreatment of Hybrid Poplar. Part 2: Impact of Cu-Catalyzed Alkaline Hydrogen Peroxide Pretreatment Conditions on Process Performance and Economics. Ind. Eng. Chem. Res. 58 (35), 16000–16008. doi:10.1021/acs.iecr.9b00901
Keywords: near-infrared spectrocopy, corn stover, bioenergy, biomass pre-processing, biomass characterization
Citation: Cousins DS, Otto WG, Rony AH, Pedersen KP, Aston JE and Hodge DB (2022) Near-Infrared Spectroscopy can Predict Anatomical Abundance in Corn Stover. Front. Energy Res. 10:836690. doi: 10.3389/fenrg.2022.836690
Received: 15 December 2021; Accepted: 04 February 2022;
Published: 17 February 2022.
Edited by:
Timothy G. Rials, The University of Tennessee, Knoxville, United StatesReviewed by:
Nicole Labbe, The University of Tennessee, Knoxville, United StatesMaobing Tu, University of Cincinnati, United States
Edward Wolfrum, National Renewable Energy Laboratory (DOE), United States
Copyright © 2022 Cousins, Otto, Rony, Pedersen, Aston and Hodge. This is an open-access article distributed under the terms of the Creative Commons Attribution License (CC BY). The use, distribution or reproduction in other forums is permitted, provided the original author(s) and the copyright owner(s) are credited and that the original publication in this journal is cited, in accordance with accepted academic practice. No use, distribution or reproduction is permitted which does not comply with these terms.
*Correspondence: David B. Hodge, ZGF2aWQuaG9kZ2UzQG1vbnRhbmEuZWR1